#### 1. Opening Theme: Geopolitical Shadows Over the Global Cycle
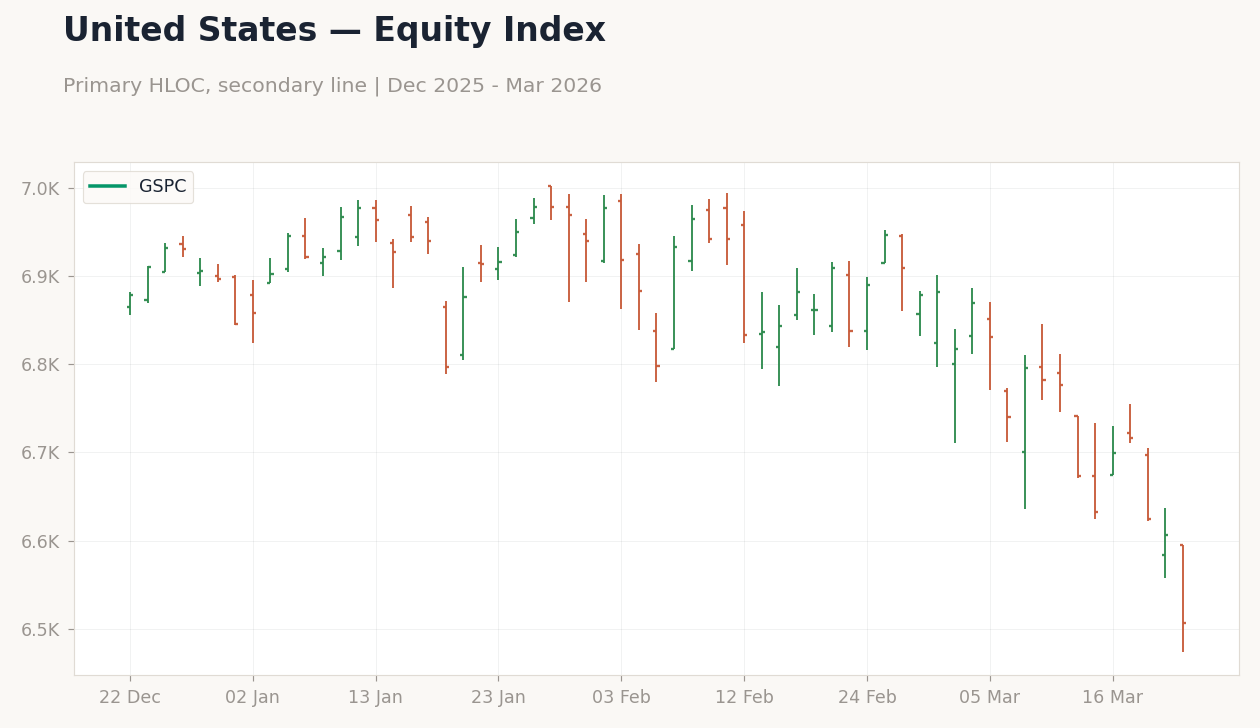
As we navigate the mid-point of Q1 2026, the global economic cycle remains ensnared in a precarious balance between tentative recovery signals and resurgent external shocks, with the week of March 16-20 dominated by escalating geopolitical tensions in the Middle East. Iran's reported targeting of US-allied bases on March 18 not only propelled WTI crude prices up 0.98% to $184.25 but also amplified risk-off sentiment across asset classes, underscoring how exogenous factors are increasingly dictating the macro narrative. We note that this development overshadowed pockets of economic resilience, such as Japan's February trade surplus of ¥57.3 billion, which defied consensus forecasts of a ¥483.2 billion deficit, highlighting export strength amid global headwinds. Yet, the broader data flow suggests the world economy is in a late-cycle phase, with growth momentum cooling—evidenced by the S&P 500's 1.9% weekly decline to 6,506—and inflation pressures re-emerging from energy volatility, as Brent crude's 6.19% rise on March 19 pressured consumer and producer prices.
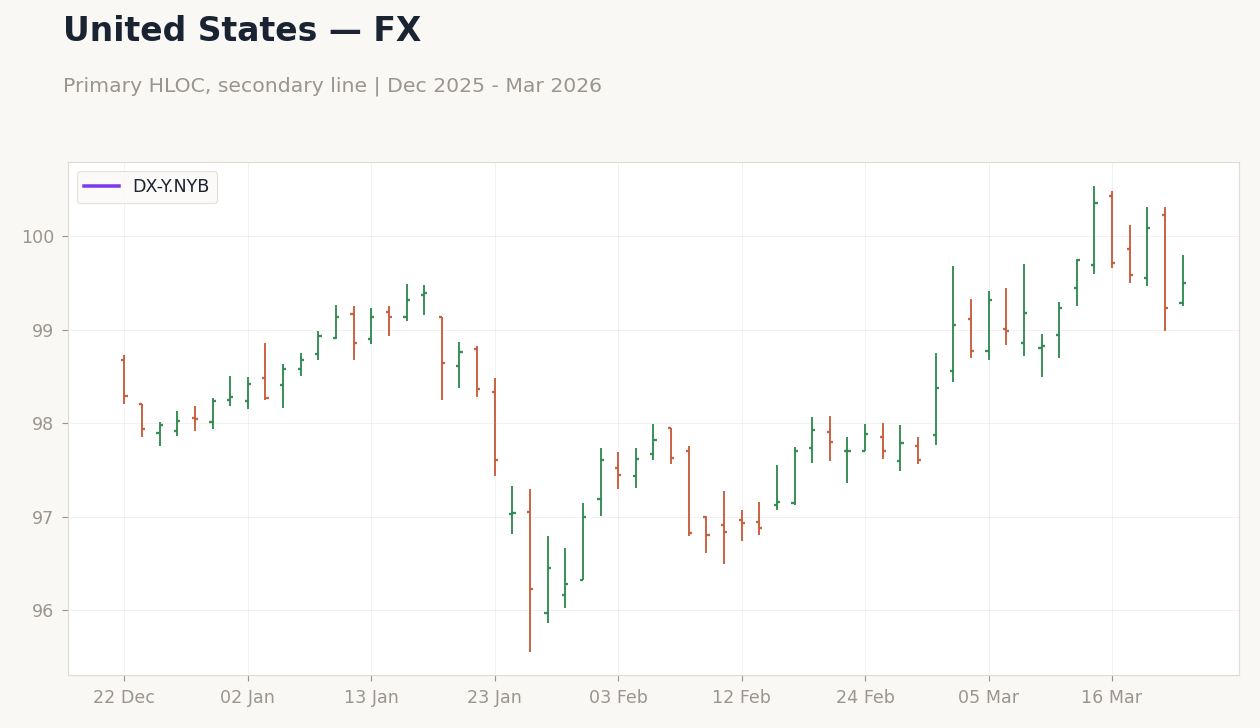
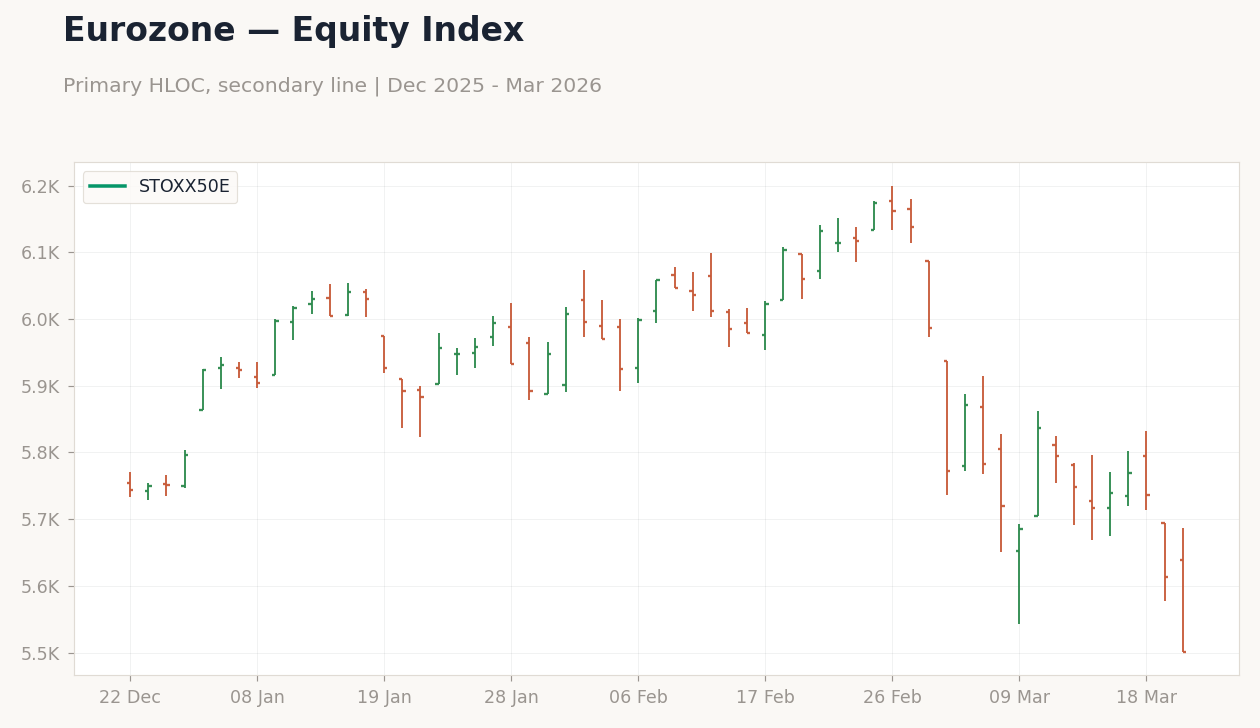
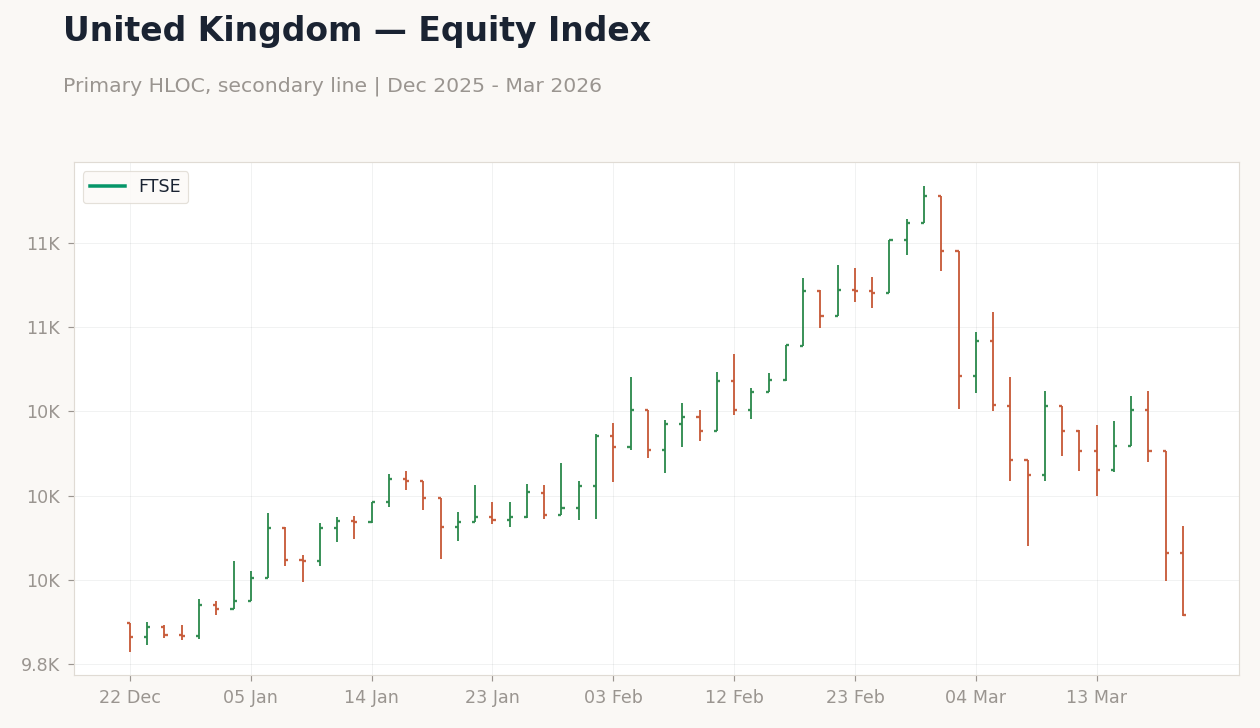
This week's dominant narrative revolves around the interplay of geopolitical risks and policy caution, where Iran's actions spilled over into currency markets, initially bolstering the US dollar before a partial reversal saw the DXY index fall 0.8% to 99.50 by March 20. The data suggests that while developed markets (DMs) are grappling with sticky inflation—US 10Y yields climbed 11bp to 4.39%—emerging markets (EMs) face amplified vulnerabilities from commodity swings, with global equities like the Euro Stoxx 50 dropping 3.8% to 5,501. We observe that this risk amplification comes at a time when the global cycle is transitioning from post-pandemic normalization to a potential slowdown, as indicated by the Nasdaq 100's 2.0% weekly loss to 23,898, reflecting tech sector sensitivity to higher-for-longer rates. Policy implications are profound: central banks are now contending with a trifecta of elevated oil prices, safe-haven flows, and uneven data, which could delay anticipated rate cuts. For instance, the UK's January employment change of +84,000, surpassing expectations of -4,000, provided some labor market ballast, yet it was insufficient to counter the FTSE 100's 3.3% slide to 9,918 amid Iran-driven energy volatility on March 18.
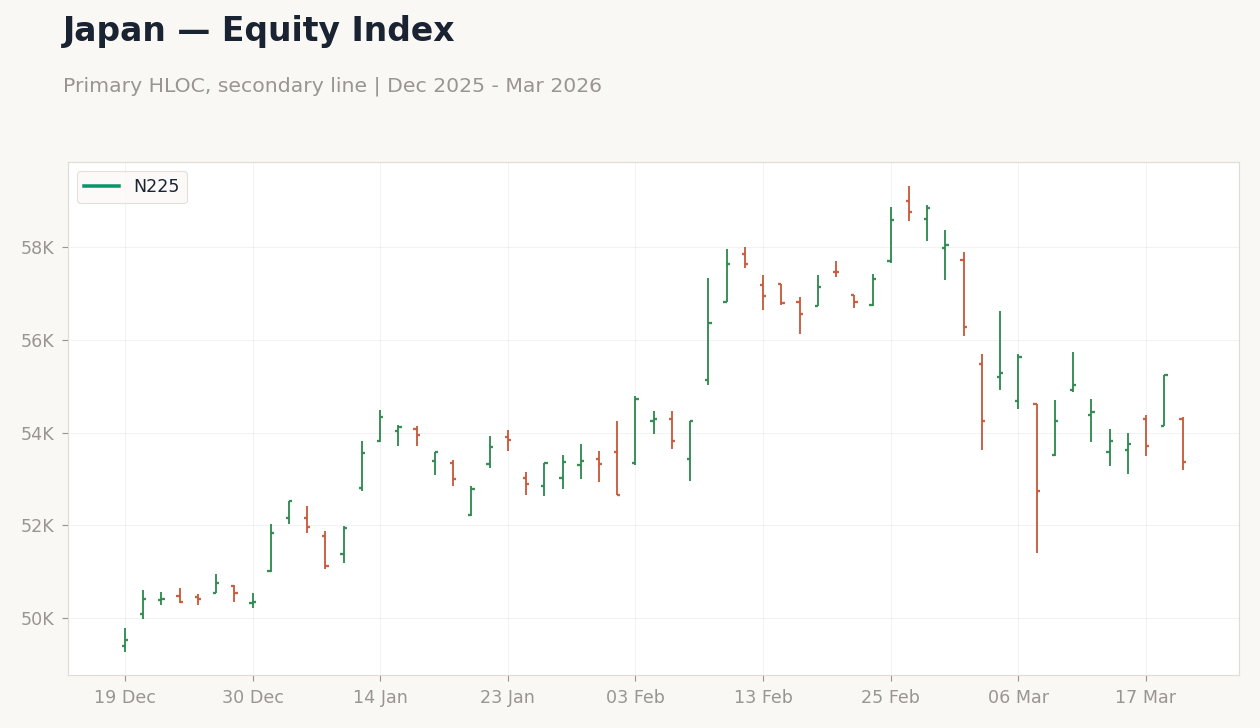
Looking across regions, the narrative coalesces around a theme of divergence: while DMs like the US and Eurozone exhibit mixed equity performance—with the DAX falling 4.5% to 22,380—the global spillover from March 16's initial Iran reports exacerbated volatility, as seen in the Nikkei 225's 2.0% weekly drop to 53,373 despite a mid-week 2.87% surge on positive trade data. We argue this points to a macro environment where geopolitical tail risks are eroding confidence, with implications for investment positioning; hedge funds likely increased short exposure, given the Russell 2000's 1.7% decline to 2,438. Ultimately, the week's events reinforce our view that the global cycle is at an inflection point, where March 2026 data could tip the balance toward recessionary fears if tensions persist, potentially forcing policymakers to prioritize stability over normalization.
(412 words)
#### 2. DM Theme: Resilience Tested in Core Economies
In developed markets, the read-across from this week's data underscores a theme of resilience under duress, as US, Eurozone, Japan, and UK indicators revealed pockets of strength amid geopolitical headwinds that drove broad equity corrections. We note that US equities bore the brunt, with the S&P 500 tumbling 1.9% to 6,506 by March 20, largely due to Iran's March 18 base targeting, which heightened risk premiums and pushed WTI crude to $184.25. This pressure extended to fixed income, where US 2Y yields rose 14bp to 4.01%, signaling market bets on sustained inflation from energy costs, while the 2s10s spread widened to +38bp, indicating less inversion and potential growth optimism despite the noise.
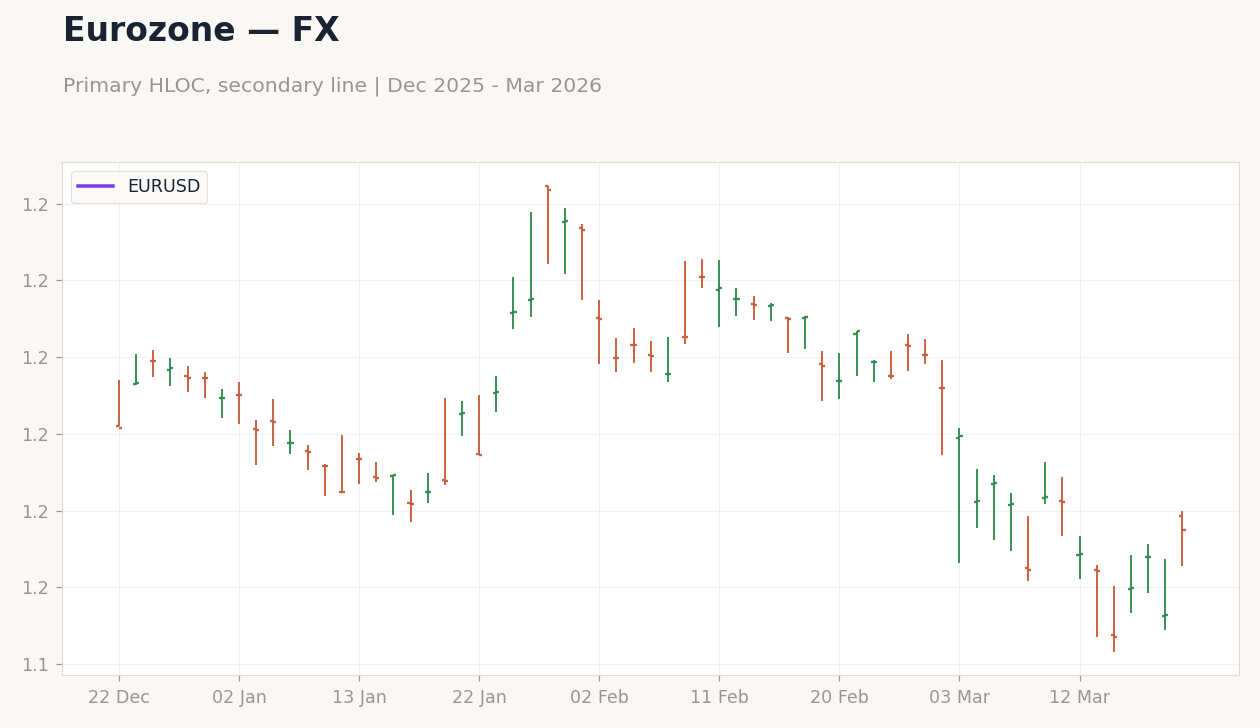
Across the Eurozone, mixed equity signals emerged, with the Euro Stoxx 50 declining 3.8% to 5,501, yet the DAX's 4.5% drop to 22,380 contrasted with industrial resilience that limited losses earlier in the week. Brent crude's volatility—plunging 8.39% to $4,574.90 mid-week before recovering—eased some inflation fears, supporting ECB rate cut expectations for Q2 2026, as EUR/USD strengthened 0.5% to 1.1575 by March 20. In Japan, the Bank of Japan's decision to hold rates at 0.75% on March 19, coupled with Governor Ueda's emphasis on data-dependent policy, aligned with the February trade surplus of ¥57.3 billion, which bolstered the Nikkei 225's brief 2.87% surge on March 18 before a 3.38% plunge the next day amid risk-off flows.
The UK provided a counterpoint of labor market vigor, with January's +84,000 employment change beating forecasts, yet this was overshadowed by the FTSE 100's 3.3% fall to 9,918 on March 20, driven by Brent's 6.19% rise. Policy-wise, the Bank of England's unanimous 9-0 vote to maintain 3.75% rates on March 19 marked a shift from prior divisions, reflecting heightened inflation vigilance from Middle East conflicts. Overall, the DM theme suggests policy divergence may widen, as US yield curves steepen while Eurozone easing bets firm, potentially pressuring cross-regional capital flows in the coming months.
(348 words)
#### 3. EM Theme: Vulnerabilities Amplified by External Shocks
Emerging markets this week highlighted a narrative of vulnerability to global shocks, with data flows, central bank actions, and FX moves reflecting amplified pressures from Iran's geopolitical escalations on March 18. We observe that while some EM equities showed relative resilience—such as the KOSPI surging 5.4% to 5,781 amid tech export gains—broader indices like the CSI 300 fell 2.2% to 4,567, underscoring China's exposure to commodity volatility as Brent crude fluctuated wildly.
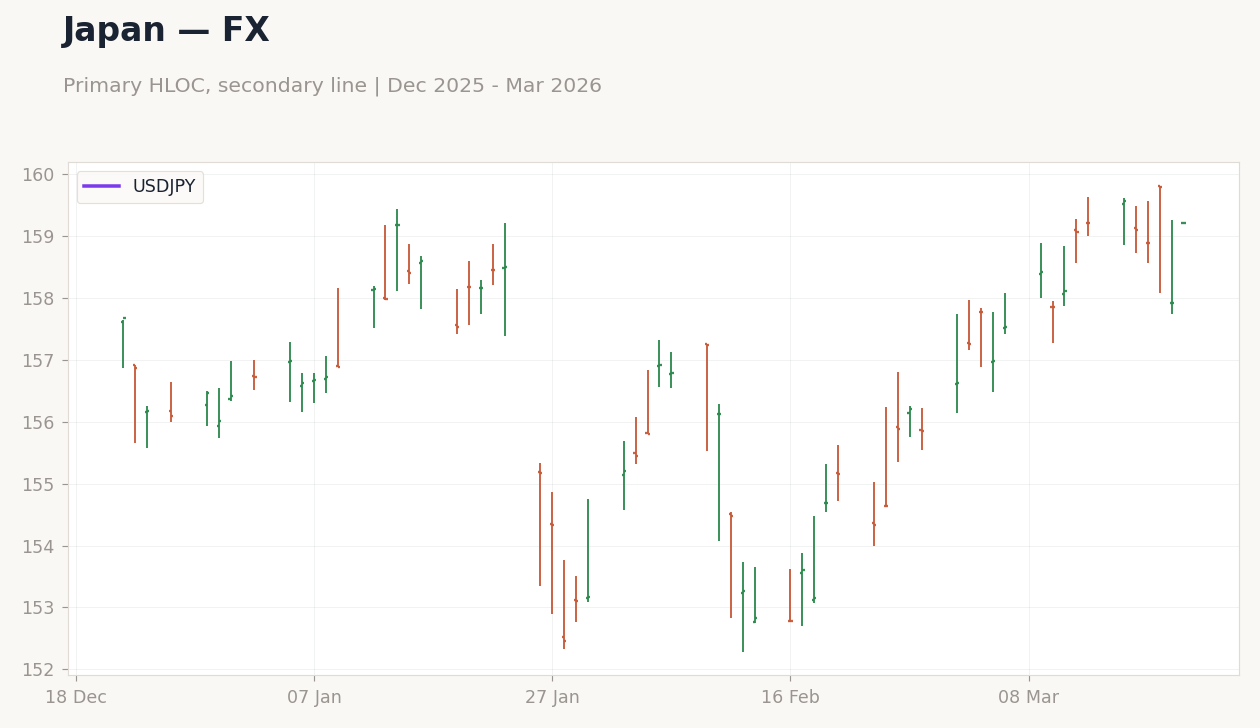
Central bank responses in EMs leaned toward caution, mirroring DM steadiness but with greater FX implications; for instance, though specific rate moves were absent, implied policy from data like India's Nifty 50 dipping 0.2% to 23,114 suggests inflation watchfulness amid YTD -11.6% losses. FX dynamics were telling, with USD/JPY easing 0.2% to 159.22 by March 20, reflecting safe-haven yen flows, while broader EM currencies faced depreciation pressures from DXY's initial strength before its 0.8% weekly decline.
In Latin America, Brazil's Ibovespa edged down 0.8% to 176,219, buoyed by commodity ties, yet Mexico's IPC fell 3.0% to 64,135, highlighting trade sensitivities to US tensions. South Africa's JSE Top 40 plunged 5.3% to 6,442, exacerbated by gold's 8.39% drop on March 19. The data suggests EM policy will increasingly diverge, with commodity exporters like Brazil potentially benefiting from oil at $184.25, while importers face headwinds, setting up FX volatility into April 2026.