US Macro Daily(Beta Mode)
Fed Holds Steady Amid Iran Tensions
Market Snapshot
| Asset | Level | Change |
|---|---|---|
| S&P 500 | 6,624.70 | -1.36% |
| Nasdaq 100 | 24,425.09 | -1.43% |
| Dow Jones | 46,225.15 | -1.63% |
| Russell 2000 | 2,478.64 | -1.64% |
| USD/JPY | 159.13 | +0.15% |
| EUR/USD | 1.15 | -0.54% |
| GBP/USD | 1.33 | -0.59% |
| Gold | 4,685.90 | -4.17% |
| WTI Crude | 95.99 | -0.34% |
| Bitcoin | 70,122.31 | -1.58% |
| US 2Y Treasury | 3.68% | +0.00% |
| US 10Y Treasury | 4.20% | -0.71% |
Prior Economic Events
| Data | Prior | Cons | Actual |
|---|---|---|---|
| NY Empire State Manufacturing Index | 7.10 | 3.20 | -0.20 |
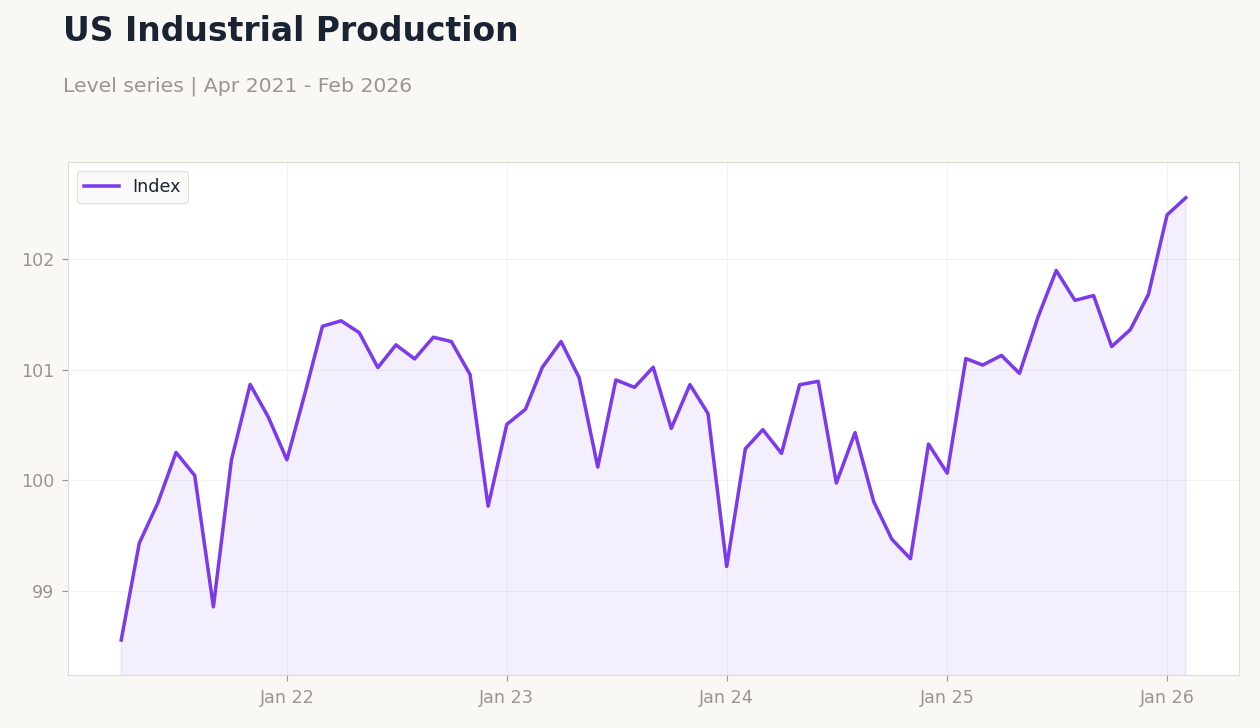
| Industrial Production Month-over-Month | 0.70 | 0.10 | 0.20 |
| NAHB Housing Market Index | 37 | 37 | 38 |
| ADP Employment Change Weekly | 14,750 | - | 9,000 |
| Pending Home Sales Month-over-Month | -1 | -0.50 | 1.80 |
| Pending Home Sales Year-over-Year | -0.40 | - | -0.80 |
| API Weekly Crude Oil Stocks | -1.7m | -600,000 | 6.6m |
| MBA 30-Year Mortgage Rate | 6.19 | - | 6.30 |
| Producer Price Index Month-over-Month | 0.50 | 0.30 | 0.70 |
| Core Producer Price Index Month-over-Month | 0.80 | 0.30 | 0.50 |
 US Producer Price Index YoY | Type: macro_line | PPI YoY %: 267.8 (2026-02-01) | Range: 217.9–280.3 | Trend(6pt): 217.9,280.3,257.7,253.1,261,267.8
Today's Economic Events
| Data | Prior | Cons | Time |
|---|---|---|---|
| Philadelphia Fed Manufacturing Index | 16.30 | 10 | 04:30 |
| Weekly Jobless Claims | 213,000 | 215,000 | 04:30 |
| New Home Sales | 745,000 | 720,000 | 06:00 |
| New Home Sales Month-over-Month | -1.70 | - | 06:00 |
| Saturday (2026-03-21) | |||
| Speech by Fed's Chair Powell | - | - | 09:30 |
- Federal Reserve keeps rates at 3.75%, citing Middle East uncertainty on inflation.
- PPI beats forecasts at 0.7% MoM, underscoring ongoing price pressures.
- Stocks drop over 1%, gold falls 4.17% on risk-off sentiment.
Yesterday's Recap
US data presented mixed signals, with NY Empire State Manufacturing Index at -0.20, below consensus of 3.2, indicating regional contraction. Industrial production rose 0.2% MoM, slightly above 0.1% expected. NAHB Housing Market Index improved to 38 from 37.
ADP employment change slowed to 9,000 from 14,750 prior. Pending home sales increased 1.8% MoM, beating -0.5% consensus, but fell 0.8% YoY. PPI surprised higher at 0.7% MoM versus 0.3% forecast, with core at 0.5% against 0.3%.
Factory orders met expectations at 0.1% MoM. Oil inventories rose sharply, API crude stocks up 6.6 million barrels versus -0.6 million expected, EIA crude at +6.156 million against 0.4 million consensus, and gasoline at -5.436 million below -1.6 million forecast, pressuring WTI down 0.34% to 95.99. MBA 30-year mortgage rate rose to 6.3% from 6.19%.
Equities declined, S&P 500 -1.36% to 6,624.70, Nasdaq 100 -1.43% to 24,425.09, Dow Jones -1.63% to 46,225.15, Russell 2000 -1.64% to 2,478.64. USD/JPY rose 0.15% to 159.13, EUR/USD fell 0.54% to 1.15, GBP/USD down 0.59% to 1.33. Gold dropped 4.17% to 4,685.90, Bitcoin -1.58% to 70,122.31.
US 10Y yield fell 0.71% to 4.20%, 2Y unchanged at 3.68%.
The Day Ahead
Attention turns to Philadelphia Fed Manufacturing Index at 4:30 ET, with prior data signaling potential weakness in regional activity. No other major US releases today, shifting focus to Fed Chair Powell's remarks for insights on rate trajectory amid geopolitical risks. Markets may react to any Iran conflict updates, influencing energy prices and yields.
Treasury dynamics could evolve with safe-haven demand, while currency pairs like EUR/USD at 1.15 face volatility from global crosswinds. Broader sentiment depends on Middle East developments, potentially affecting inflation outlooks and equity rebounds.
Other Economic Notes
Housing shows adaptability despite 30-year mortgage rates at 6.3%, as pending sales beat MoM forecasts, though YoY declines persist. Labor softness evident in ADP's 9,000 additions, consistent with unemployment at 4.40%, possibly easing wage inflation. (cont...)