US Macro Daily(Beta Mode)
PMIs Mixed, Oil Slumps
Market Snapshot
| Asset | Level | Change |
|---|---|---|
| S&P 500 | 6,556.37 | -0.37% |
| Nasdaq 100 | 24,002.45 | -0.77% |
| Dow Jones | 46,124.06 | -0.18% |
| Russell 2000 | 2,505.44 | +0.45% |
| USD/JPY | 158.87 | +0.25% |
| EUR/USD | 1.16 | +0.00% |
| GBP/USD | 1.34 | -0.10% |
| Gold | 4,557.30 | +3.59% |
| WTI Crude | 87.37 | -5.39% |
| Bitcoin | 71,525.19 | +1.43% |
| US 2Y Treasury | 3.83% | -1.29% |
| US 10Y Treasury | 4.34% | -1.14% |
Prior Economic Events
| Data | Prior | Cons | Actual |
|---|---|---|---|
| Chicago Fed National Activity Index | 0.20 | - | -0.11 |
| ADP Employment Change Weekly | 9,000 | - | 10,000 |
| S&P Global Composite PMI Flash | 51.90 | - | 51.40 |
| S&P Global Manufacturing PMI Flash | 51.60 | 51.30 | 52.40 |
| S&P Global Services PMI Flash | 51.70 | 51.50 | 51.10 |
| API Weekly Crude Oil Stocks | 6.6m | -1.3m | 2.3m |
| Speech by Fed's Barr | - | - | - |
| MBA 30-Year Mortgage Rate | 6.30 | - | - |
 US Crude Oil Prices | Type: macro_line | WTI Crude Oil Price: 93.39 (2026-03-16) | Range: 55.44–123.6 | Trend(5pt): 60.93,110.5,90.13,70.25,93.39
Today's Economic Events
| Data | Prior | Cons | Time |
|---|---|---|---|
| Current Account Balance | -226,400m | -211,000m | 04:30 |
| Export Prices Month-over-Month | 0.60 | 0.50 | 04:30 |
| Import Prices Month-over-Month | 0.20 | 0.50 | 04:30 |
| EIA Weekly Crude Oil Inventory | 6.2m | 500,000 | 06:30 |
| EIA Weekly Gasoline Inventory | -5.4m | -2.1m | 06:30 |
| Speech by Fed's Miran | - | - | 12:10 |
- US flash PMIs showed divergence with manufacturing beating expectations at 52.4 while services softened to 51.1, signaling uneven growth amid global tensions.
- Equity markets dipped modestly, with S&P 500 down 0.37% and Nasdaq 100 off 0.77%, as oil prices plunged 5.39% on supply builds.
- Gold surged 3.59% as a safe haven, while Treasuries rallied with 10Y yields falling 1.14% on economic uncertainty.
Yesterday's Recap
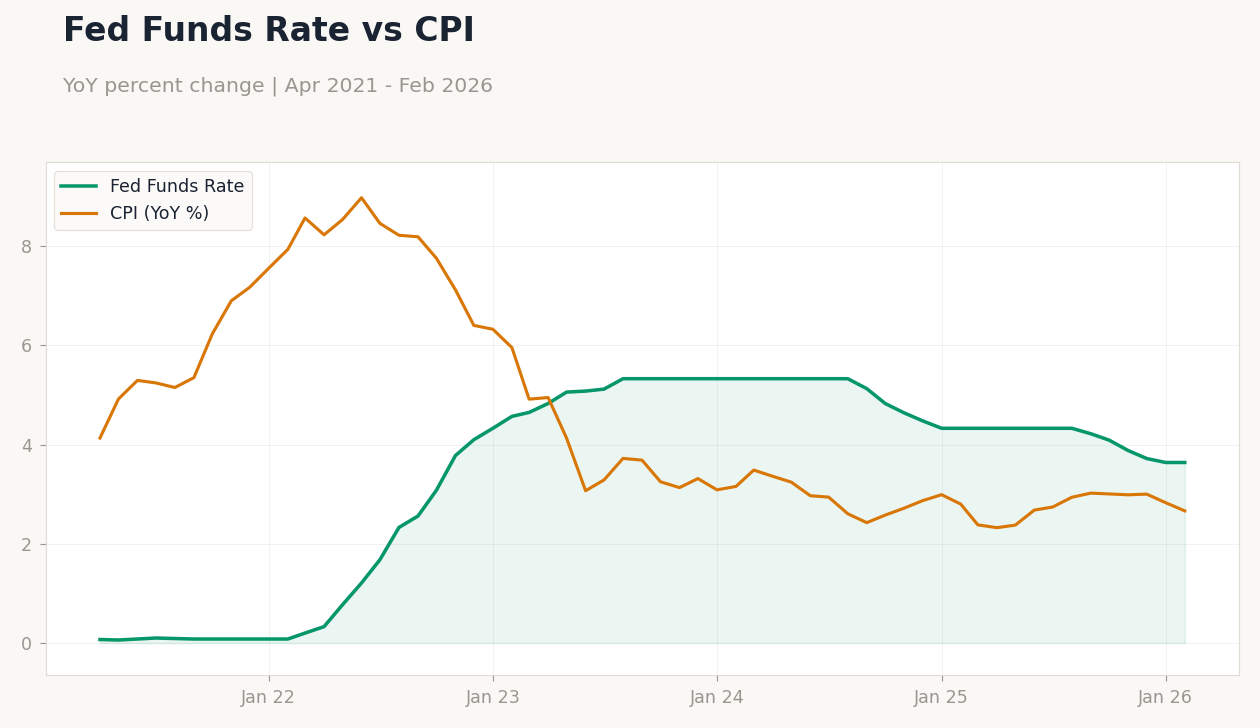
US economic data released mixed signals, with the Chicago Fed National Activity Index dropping to -0.11 from 0.20, indicating a slowdown in overall activity. ADP Employment Change edged up to 10,000 from 9,000, suggesting modest weekly job gains. S&P Global flash PMIs diverged: Composite fell to 51.4 from 51.9, Manufacturing rose to 52.4 beating consensus of 51.3, and Services dipped to 51.1 missing 51.5, pointing to resilient factories but weakening services.
API Weekly Crude Oil Stocks surprised with a build of 2.3 million barrels against expectations of a 1.3 million draw, pressuring energy prices. Markets reacted with equities mostly lower—S&P 500 closed at 6,556.37 down 0.37%, Nasdaq 100 at 24,002.45 off 0.77%, Dow Jones at 46,124.06 down 0.18%, while Russell 2000 gained 0.45% to 2,505.44. WTI Crude tumbled 5.39% to $87.37 amid inventory builds, but Gold jumped 3.59% to $4,557.30 as investors sought safety.
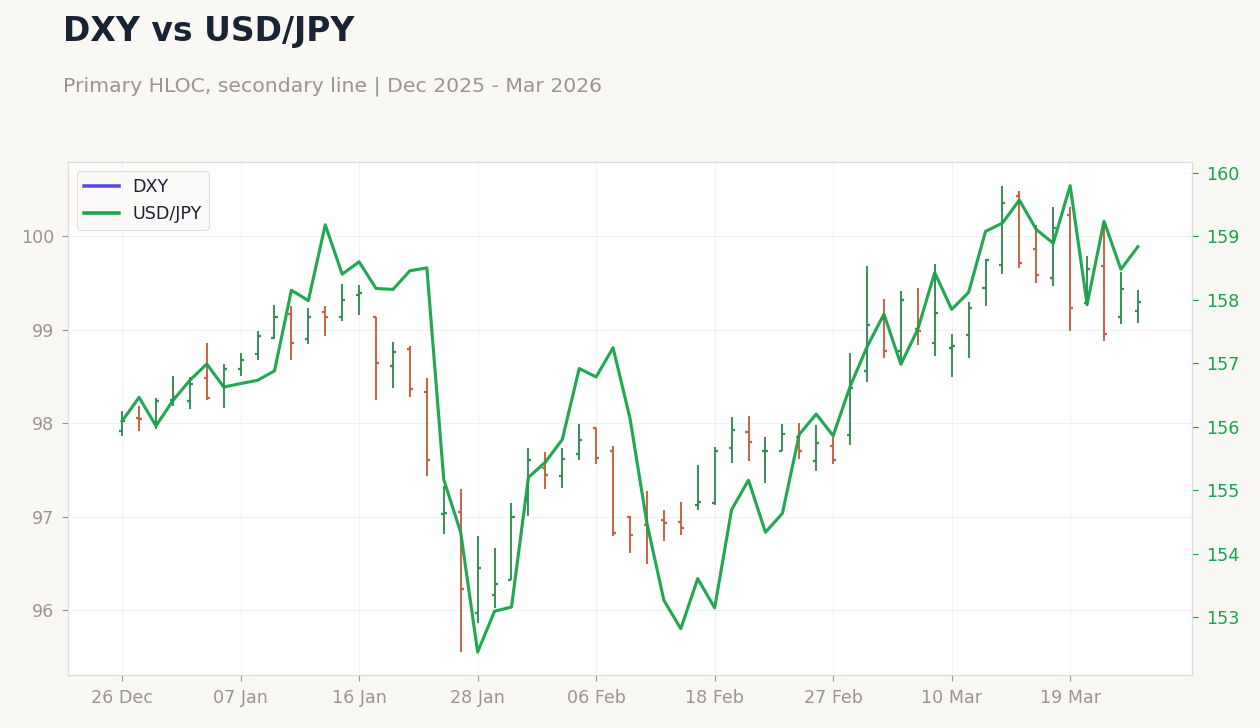
Currency moves were muted, with USD/JPY up 0.25% to 158.87 and EUR/USD flat at 1.16, while Treasuries rallied with 2Y yields down 1.29% to 3.83% and 10Y down 1.14% to 4.34%.
The Day Ahead
Today's US releases include the Current Account Balance at 04:30 ET, expected at -$211 billion versus prior -$226.4 billion, offering insights into trade dynamics amid global disruptions. Export Prices and Import Prices MoM, both forecasted at 0.5% from 0.6% and 0.2% respectively, will gauge inflationary pressures from trade. EIA Weekly Crude Oil Inventory at 06:30 ET is projected at +500,000 barrels after +6.156 million prior, with Gasoline Inventory expected at -2.1 million versus -5.436 million, critical for energy market sentiment.
Fed's Miran speaks at 12:10 ET, potentially addressing policy amid geopolitical risks. These data points could influence Treasury yields and equity volatility, especially if oil inventories confirm supply glut trends. No major market closures, but focus remains on how releases interact with ongoing Iran war uncertainties.
Other Economic Notes
Broader US themes highlight resilience in manufacturing offsetting services weakness, with unemployment steady at 4.40% supporting consumer spending despite CPI YoY at 2.31% signaling tame inflation. (cont...)