US Macro Daily(Beta Mode)
Mixed PMIs, Oil Jumps
Market Snapshot
| Asset | Level | Change |
|---|---|---|
| S&P 500 | 6,591.90 | +0.54% |
| Nasdaq 100 | 24,162.98 | +0.67% |
| Dow Jones | 46,429.49 | +0.66% |
| Russell 2000 | 2,536.38 | +1.23% |
| USD/JPY | 158.72 | +0.15% |
| EUR/USD | 1.16 | -0.56% |
| GBP/USD | 1.34 | -0.41% |
| Gold | 4,461.00 | -1.95% |
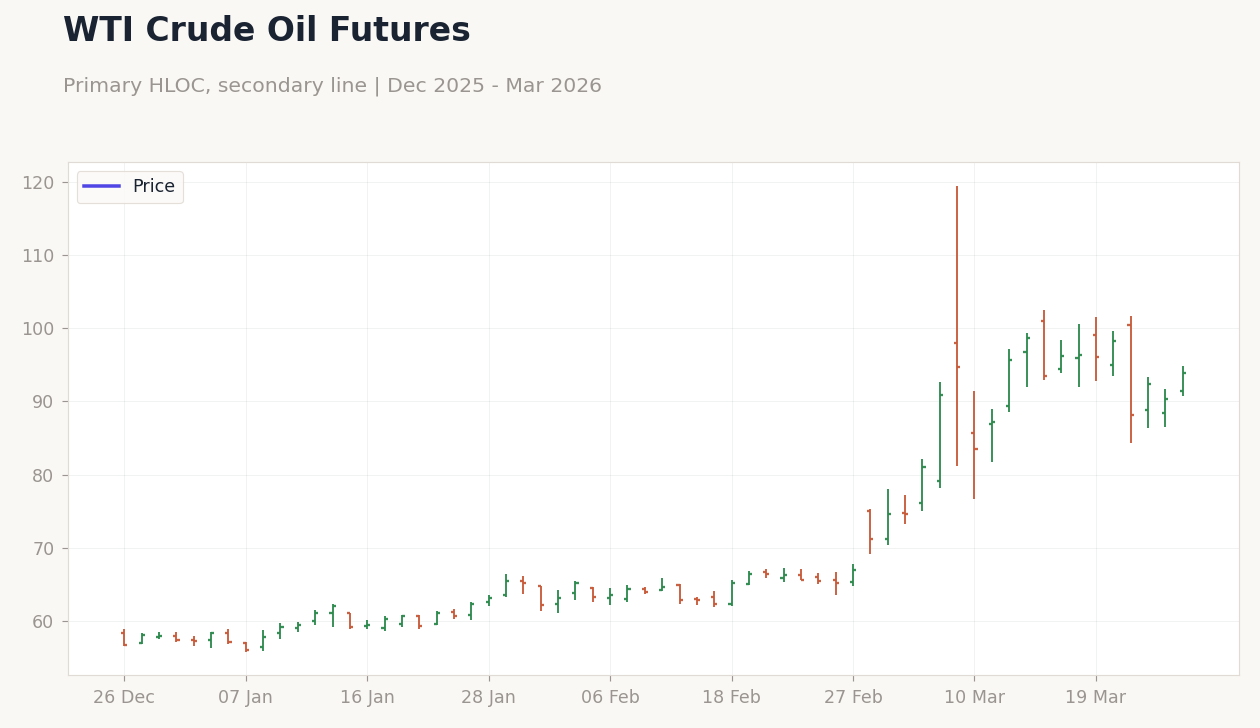
| WTI Crude | 93.64 | +3.68% |
| Bitcoin | 69,260.43 | -2.87% |
| US 2Y Treasury | 3.90% | +1.83% |
| US 10Y Treasury | 4.39% | +1.15% |
Prior Economic Events
| Data | Prior | Cons | Actual |
|---|---|---|---|
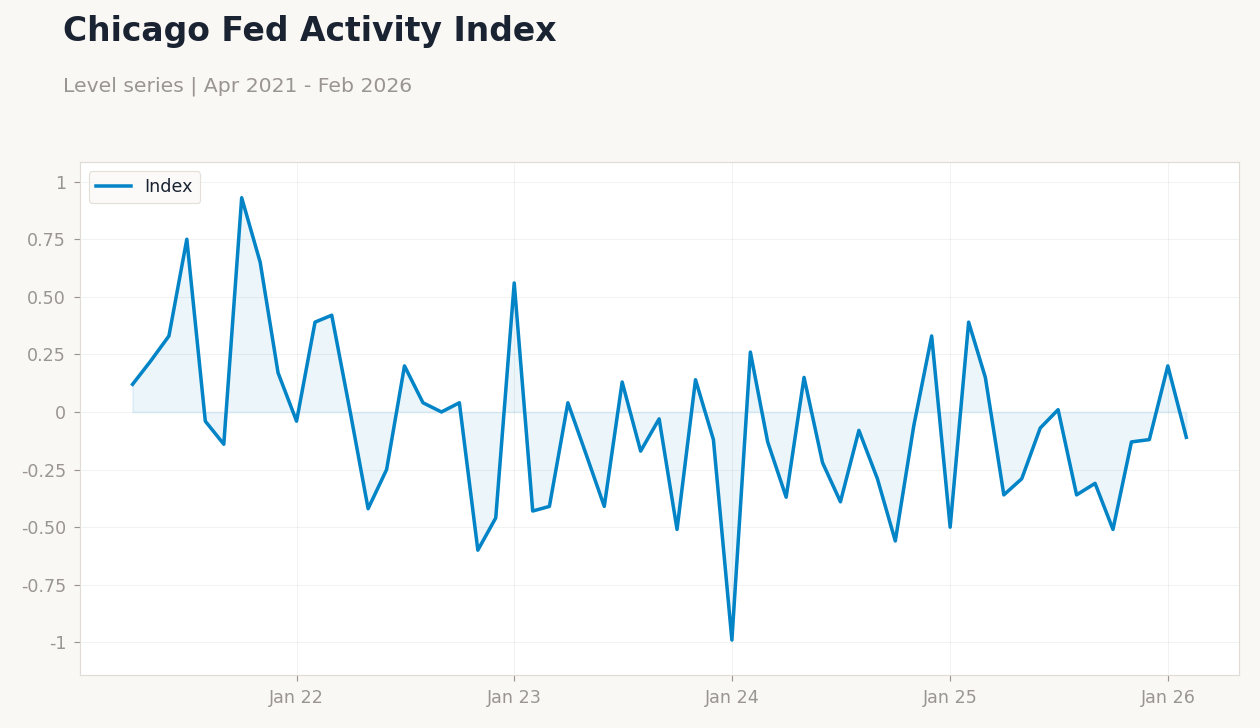
| Chicago Fed National Activity Index | 0.20 | - | -0.11 |
| ADP Employment Change Weekly | 9,000 | - | 10,000 |
| S&P Global Composite PMI Flash | 51.90 | - | 51.40 |
| S&P Global Manufacturing PMI Flash | 51.60 | 51.30 | 52.40 |
| S&P Global Services PMI Flash | 51.70 | 51.50 | 51.10 |
| API Weekly Crude Oil Stocks | 6.6m | -1.3m | 2.3m |
| Speech by Fed's Barr | - | - | - |
| MBA 30-Year Mortgage Rate | 6.30 | - | 6.43 |
| Current Account Balance | -239,100m | -211,000m | -190,700m |
| Export Prices Month-over-Month | 0.60 | 0.50 | 1.50 |
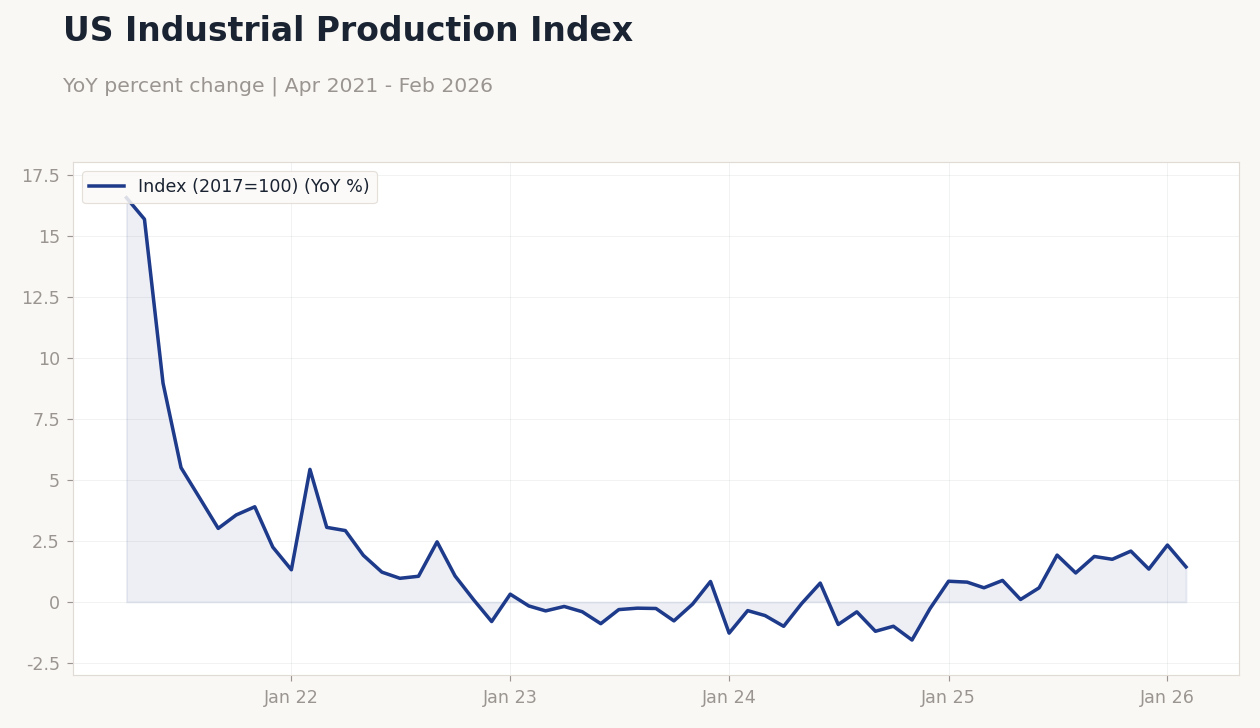 US Industrial Production Index | Type: macro_line | Index (2017=100): 1.436 (2026-02-01) | Range: -1.558–16.55 | Trend(6pt): 16.55,1.222,-0.2542,-0.9947,1.346,1.436
Today's Economic Events
| Data | Prior | Cons | Time |
|---|---|---|---|
| Fed Cook Speech | - | - | 12:00 |
| Speech by Fed's Miran | - | - | 14:30 |
| Speech by Fed's Jefferson | - | - | 15:00 |
| Speech by Fed's Barr | - | - | 15:10 |
| Friday (2026-03-27) | |||
| Michigan Consumer Sentiment Final | 56.60 | 54 | 06:00 |
| Fed Daly Speech | - | - | 07:30 |
- US PMIs showed softening services but manufacturing resilience, while oil inventories built unexpectedly amid rising prices.
- Stocks advanced on value rotation, with yields climbing as data tempered rate cut bets.
- Fed speeches and global tensions, including Iran attacks, influenced risk sentiment.
Yesterday's Recap
US economic data released on March 25 painted a mixed picture, with the Chicago Fed National Activity Index dropping to -0.11 from 0.20, signaling broader slowdown pressures. The S&P Global Composite PMI Flash eased to 51.4 from 51.9, driven by a services PMI decline to 51.1 versus 51.7, though manufacturing PMI surprised higher at 52.4 against 51.3 consensus. Current account balance improved to -$190.7 billion, beating consensus of -$211 billion, while export prices rose 1.5% MoM and import prices 1.3% MoM, both exceeding 0.5% expectations.
EIA crude oil inventories built by 6.926 million barrels, far above the 0.5 million consensus, yet WTI crude surged 3.68% to $93.64 amid geopolitical risks. Equity markets rallied, with S&P 500 up 0.54% to 6,591.90, Nasdaq 100 gaining 0.67% to 24,162.98, and Russell 2000 leading at 1.23% to 2,536.38 on small-cap strength. Treasury yields rose, with the 2-year at 3.90% (+1.83%) and 10-year at 4.39% (+1.15%), reflecting digestion of resilient data against Fed funds at 3.64%.
Gold fell 1.95% to $4,461.00 as safe-haven demand waned, while Bitcoin dropped 2.87% to $69,260.43.
The Day Ahead
March 26 brings weekly jobless claims at 4:30 ET, with consensus at 210,000 from previous 205,000 amid unemployment steady at 4.40%. This release will gauge labor market health, potentially influencing Fed rate path if claims rise unexpectedly. Fed Cook speech at 12:00 ET could provide policy insights.
No other major US data drops, but markets eye any follow-up from Fed speeches yesterday by Barr and Miran. Broader focus remains on Treasury auctions, with recent ones showing war-related anxiety per reports. Equity and bond traders will watch for volatility tied to global energy risks.
Overall, a quiet day unless claims surprise, keeping attention on USD crosses like USD/JPY at 158.72.
Other Economic Notes
Broader US themes highlight rising recession odds on Wall Street, with underlying economic cracks emerging despite solid headline growth. CPI YoY at 2.31% underscores persistent but moderating inflation, pressuring the Fed amid stagflation concerns.