US Macro Daily(Beta Mode)
Stocks Tumble, PMIs Soften
Market Snapshot
| Asset | Level | Change |
|---|---|---|
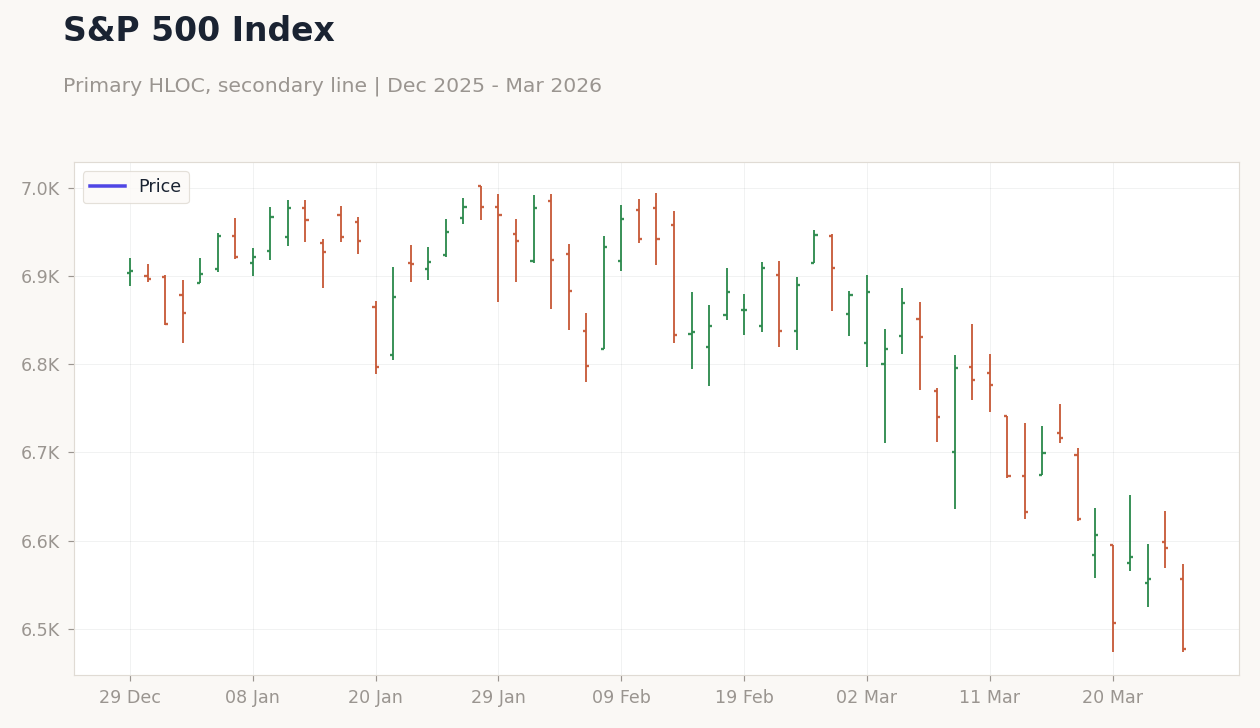
| S&P 500 | 6,477.16 | -1.74% |
| Nasdaq 100 | 23,586.99 | -2.38% |
| Dow Jones | 45,960.11 | -1.01% |
| Russell 2000 | 2,493.32 | -1.70% |
| USD/JPY | 159.91 | +0.33% |
| EUR/USD | 1.15 | -0.41% |
| GBP/USD | 1.33 | -0.46% |
| Gold | 4,443.50 | +1.55% |
| WTI Crude | 96.67 | +2.32% |
| Bitcoin | 66,473.45 | -3.37% |
| US 2Y Treasury | 3.84% | -1.54% |
| US 10Y Treasury | 4.33% | -1.37% |
Prior Economic Events
| Data | Prior | Cons | Actual |
|---|---|---|---|
| Chicago Fed National Activity Index | 0.20 | - | -0.11 |
| ADP Employment Change Weekly | 9,000 | - | 10,000 |
| S&P Global Composite PMI Flash | 51.90 | - | 51.40 |
| S&P Global Manufacturing PMI Flash | 51.60 | 51.30 | 52.40 |
| S&P Global Services PMI Flash | 51.70 | 51.50 | 51.10 |
| API Weekly Crude Oil Stocks | 6.6m | -1.3m | 2.3m |
| Speech by Fed's Barr | - | - | - |
| MBA 30-Year Mortgage Rate | 6.30 | - | 6.43 |
| Current Account Balance | -239,100m | -211,000m | -190,700m |
| Export Prices Month-over-Month | 0.60 | 0.50 | 1.50 |
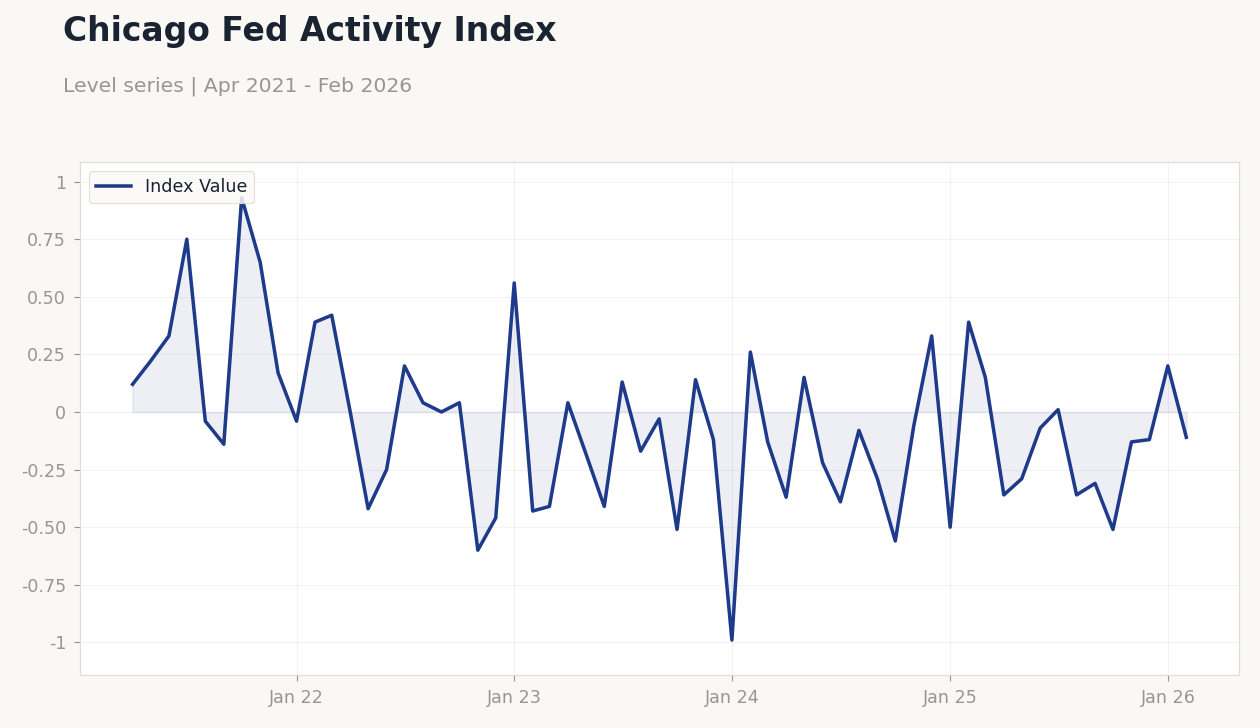 Chicago Fed Activity Index | Type: macro_line | Index Value: -0.11 (2026-02-01) | Range: -0.99–0.93 | Trend(6pt): 0.12,-0.25,-0.17,-0.56,-0.12,-0.11
Today's Economic Events
| Data | Prior | Cons | Time |
|---|---|---|---|
| Michigan Consumer Sentiment Final | 56.60 | 54 | 06:00 |
| Fed Daly Speech | - | - | 07:30 |
- US equities fell sharply amid mixed PMI data and rising recession fears, with S&P 500 down 1.74%.
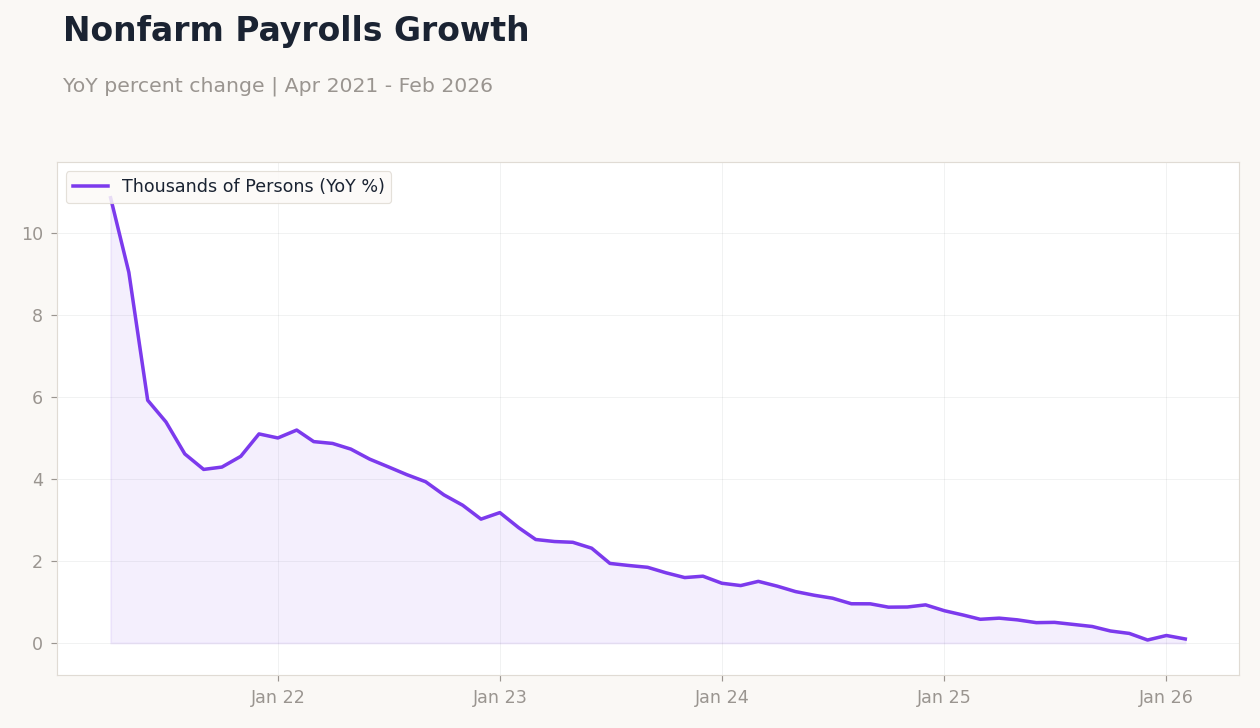
- Flash PMIs showed manufacturing expansion but services slowdown, while jobless claims met expectations at 210,000.
- Treasury yields declined as oil inventories built unexpectedly, boosting crude prices by 2.32%.
Yesterday's Recap
US economic data released over the past few days painted a mixed picture, with the Chicago Fed National Activity Index dropping to -0.11, below the prior 0.20 and signaling softer growth. Flash S&P Global PMIs showed manufacturing at 52.4, beating consensus of 51.3, but services slipped to 51.1 against expectations of 51.5, dragging the composite to 51.4. Weekly jobless claims held steady at 210,000, in line with forecasts, while the current account balance improved to -$190.7 billion, better than the expected -$211 billion.
Import and export prices rose more than anticipated, with imports up 1.3% month-over-month versus 0.5% consensus. Energy data showed EIA crude inventories built by 6.926 million barrels against a 0.5 million draw expectation, with WTI crude up 2.32% to $96.67. Equity markets reacted negatively, with the S&P 500 closing down 1.74% at 6,477.16, Nasdaq 100 off 2.38% at 23,586.99, and Dow Jones falling 1.01% to 45,960.11.
Treasury yields eased, with the 10-year at 4.33% after a 1.37% drop, reflecting safe-haven flows amid broader market weakness.
The Day Ahead
Key releases include the Michigan Consumer Sentiment Final, with previous at 56.6. This could confirm consumer trends amid recent softening signals. No other major events are detailed, but focus remains on labor and inflation indicators like upcoming jobless claims and PCE data to gauge market reactions.
The MBA 30-year mortgage rate rose to 6.43%, potentially impacting housing data. No major Fed speeches are scheduled, keeping attention on data-driven sentiment.
Other Economic Notes
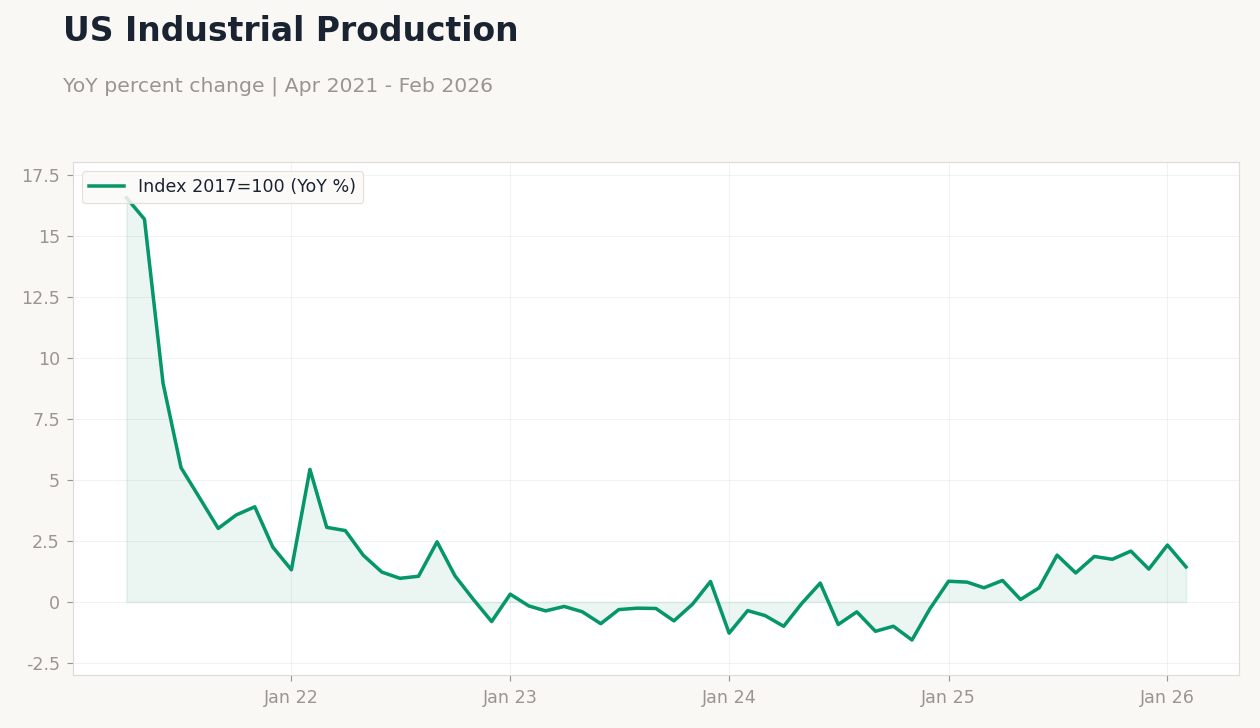
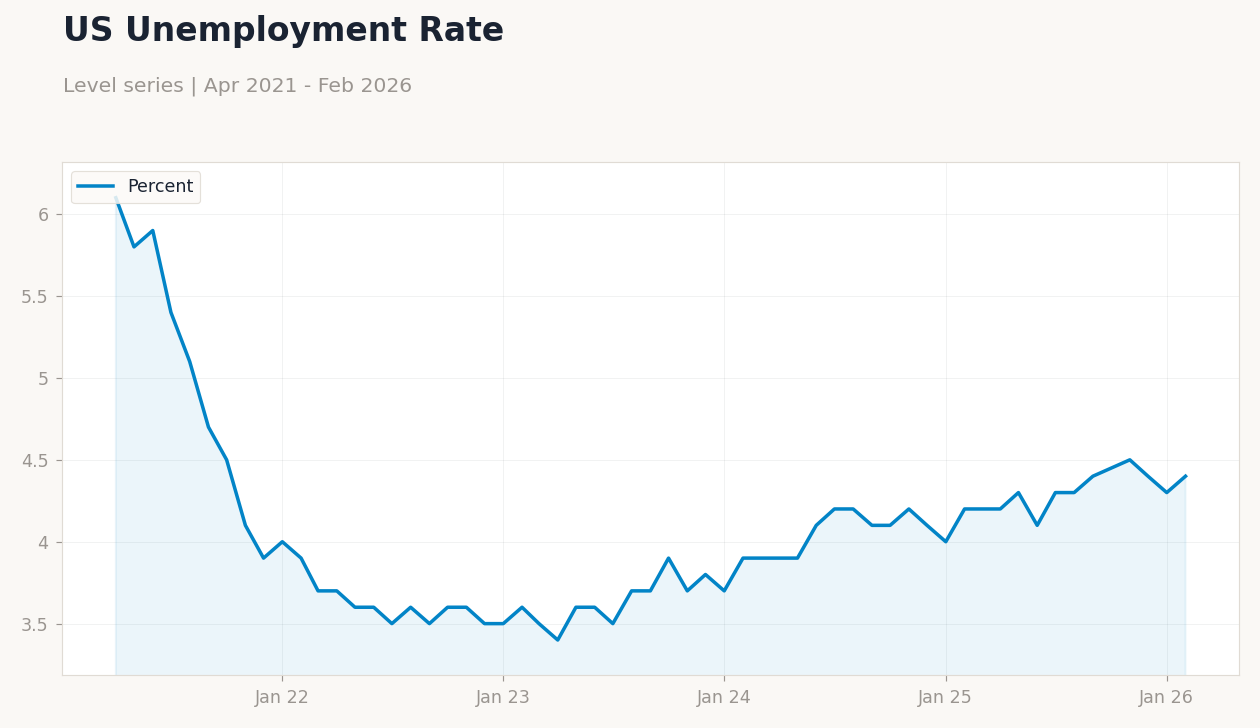
Broader US economic themes highlight increasing recession risks, as Wall Street analysts note cracks beneath the surface with flattened yield curves and softening indicators like the services PMI. Unemployment stands at 4.40% as of February, while CPI year-over-year is at 2.31%, suggesting inflation is cooling but growth momentum may be waning. Fiscal policy remains in flux, with discussions on reforming Fed-Treasury ties potentially affecting long-term monetary independence.