US Macro Daily(Beta Mode)
GDP Misses, Yields Drop
Market Snapshot
| Asset | Level | Change |
|---|---|---|
| S&P 500 | 6,824.66 | +0.62% |
| Nasdaq 100 | 25,082.09 | +0.72% |
| Dow Jones | 48,185.80 | +0.58% |
| Russell 2000 | 2,636.31 | +0.60% |
| USD/JPY | 158.64 | -0.05% |
| EUR/USD | 1.17 | +0.49% |
| GBP/USD | 1.34 | +0.32% |
| Gold | 4,782.30 | -0.21% |
| WTI Crude | 97.65 | -0.22% |
| Bitcoin | 71,913.67 | +0.20% |
| US 2Y Treasury | 3.79% | -0.52% |
| US 10Y Treasury | 4.29% | -0.92% |
Prior Economic Events
| Data | Prior | Cons | Actual |
|---|---|---|---|
| Services Sector PMI | 56.10 | 55 | 54 |
| ADP Employment Change Weekly | 15,250 | - | 26,000 |
| Durable Goods Orders Month-over-Month | -0.50 | -0.50 | -1.40 |
| Durable Goods Orders Ex Transp Month-over-Month | 0.30 | 0.50 | 0.80 |
| Fed Goolsbee Speech | - | - | - |
| API Weekly Crude Oil Stocks | 10.3m | - | 3.7m |
| Speech by Fed's Jefferson | - | - | - |
| MBA 30-Year Mortgage Rate | 6.57 | - | 6.51 |
| EIA Weekly Crude Oil Inventory | 5.5m | 700,000 | 3.1m |
| EIA Weekly Gasoline Inventory | -586,000 | -1.4m | -1.6m |
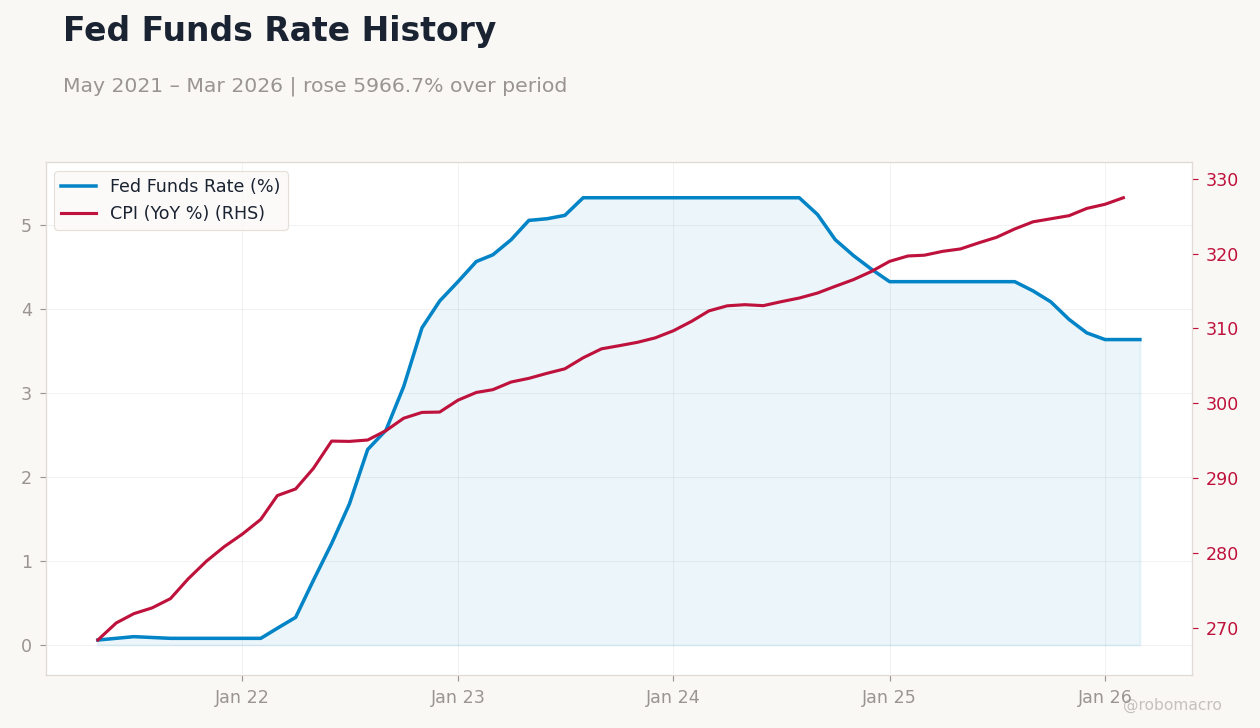
 US CPI Inflation YoY | Type: macro_line | CPI (YoY % Change): 327.5 (2026-02-01) | Range: 268.4–327.5 | Trend(5pt): 268.4,294.9,307.3,316.5,327.5
Today's Economic Events
| Data | Prior | Cons | Time |
|---|---|---|---|
| Core Inflation Rate Month-over-Month | 0.20 | 0.30 | 04:30 |
| Core Inflation Rate Year-over-Year | 2.50 | 2.70 | 04:30 |
| Inflation Rate Month-over-Month | 0.30 | 0.90 | 04:30 |
| Inflation Rate Year-over-Year | 2.40 | 3.30 | 04:30 |
| Consumer Price Index | 326.79 | 330.40 | 04:30 |
| Consumer Price Index SA | 327.46 | - | 04:30 |
| Michigan Consumer Sentiment Prel | 53.30 | 52 | 06:00 |
| Factory Orders Month-over-Month | 0.10 | -0.10 | 06:00 |
| Monthly Budget Statement | -308,000m | -153,300m | 10:00 |
- US GDP growth came in at 0.5% QoQ, below 0.7% consensus, highlighting economic slowdown.
- Equities advanced modestly, with S&P 500 up 0.62% amid falling Treasury yields.
- Fed minutes and speeches emphasized data-dependent policy with no immediate easing.
Yesterday's Recap
Economic releases on April 9 revealed softening US growth, with GDP final estimate at 0.5% quarter-over-quarter, missing the 0.7% consensus and down sharply from prior 4.4%. Personal income declined 0.1% month-over-month, against 0.3% expectations, while core PCE price index met forecasts at 0.4%. Earlier data included services PMI at 54.0, below 55 consensus, and durable goods orders down 1.4% month-over-month, worse than -0.5% anticipated.
Treasury yields fell, with the 10-year dropping 0.92% to 4.29% and 2-year declining 0.52% to 3.79%, as markets bet on weaker activity. Stocks rose, led by Nasdaq 100 up 0.72% to 25,082.09 and S&P 500 gaining 0.62% to 6,824.66, supported by lower rates despite misses. Dollar softened against peers, EUR/USD rising 0.49% to 1.17, while WTI crude slipped 0.22% to 97.65 after inventories built 3.081 million barrels, above 0.7 million expected.
Fed's Goolsbee, Jefferson, and Daly speeches, plus FOMC minutes, stressed ongoing inflation vigilance without policy changes.
The Day Ahead
April 10 features core inflation rate month-over-month at 04:30 ET, with 0.3% consensus after prior 0.2%, potentially influencing Fed cut odds if it surprises higher. No other major US data or speeches scheduled, leaving markets focused on inflation print for direction in yields and USD/JPY at 158.64. Energy updates could drive WTI volatility post-inventory rise, while equities may hold gains with S&P 500 futures steady.
Global news, including Middle East shipping disruptions, may add risk sentiment swings.
Other Economic Notes
US indicators suggest moderating expansion, with unemployment at 4.30% and CPI YoY at 2.31% aligning with soft landing views despite GDP weakness. Mortgage rates at 6.51% indicate housing pressures that could curb spending. Oil stocks rose more than forecast, signaling supply overhang amid geopolitics.
ADP employment surged to 26,000, contrasting durable goods softness, while MBA data showed easing borrowing costs.