US Macro Daily(Beta Mode)
Data Beats, Yields Fall
Market Snapshot
| Asset | Level | Change |
|---|---|---|
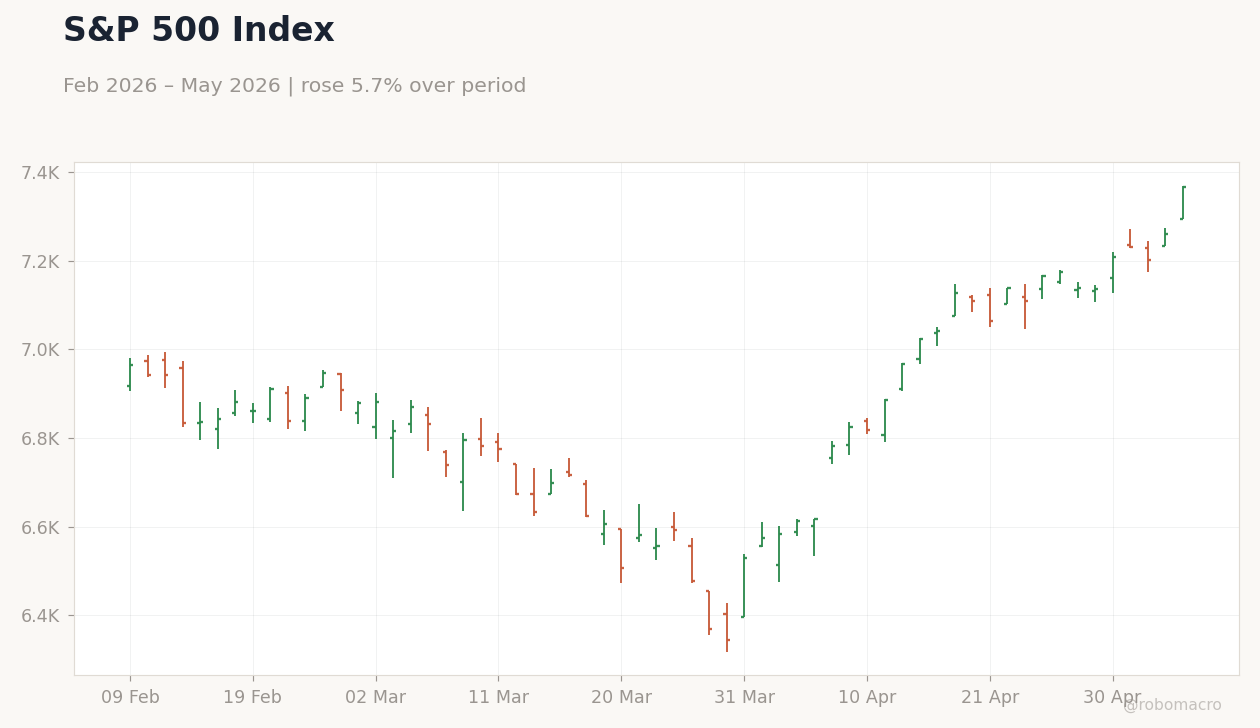
| S&P 500 | 7,365.12 | +1.46% |
| Nasdaq 100 | 28,599.17 | +2.08% |
| Dow Jones | 49,910.59 | +1.24% |
| Russell 2000 | 2,886.77 | +1.47% |
| USD/JPY | 156.39 | -0.82% |
| EUR/USD | 1.18 | +0.46% |
| GBP/USD | 1.36 | +0.39% |
| Gold | 4,746.00 | +1.37% |
| WTI Crude | 93.01 | -2.18% |
| Bitcoin | 80,850.38 | -0.71% |
| US 2Y Treasury | 3.93% | -0.51% |
| US 10Y Treasury | 4.43% | -0.45% |
Prior Economic Events
| Data | Prior | Cons | Actual |
|---|---|---|---|
| Factory Orders Month-over-Month | 0.30 | 0.50 | 1.50 |
| Speech by Fed's Williams | - | - | - |
| Exports Level | 314,700m | - | 320,900m |
| Imports Level | 372,400m | - | 381,200m |
| Trade Balance | -57,800m | -60,900m | -60,300m |
| JOLTs Job Openings | 6.9m | 6.8m | 6.9m |
| Services Sector PMI | 54 | 53.70 | 53.60 |
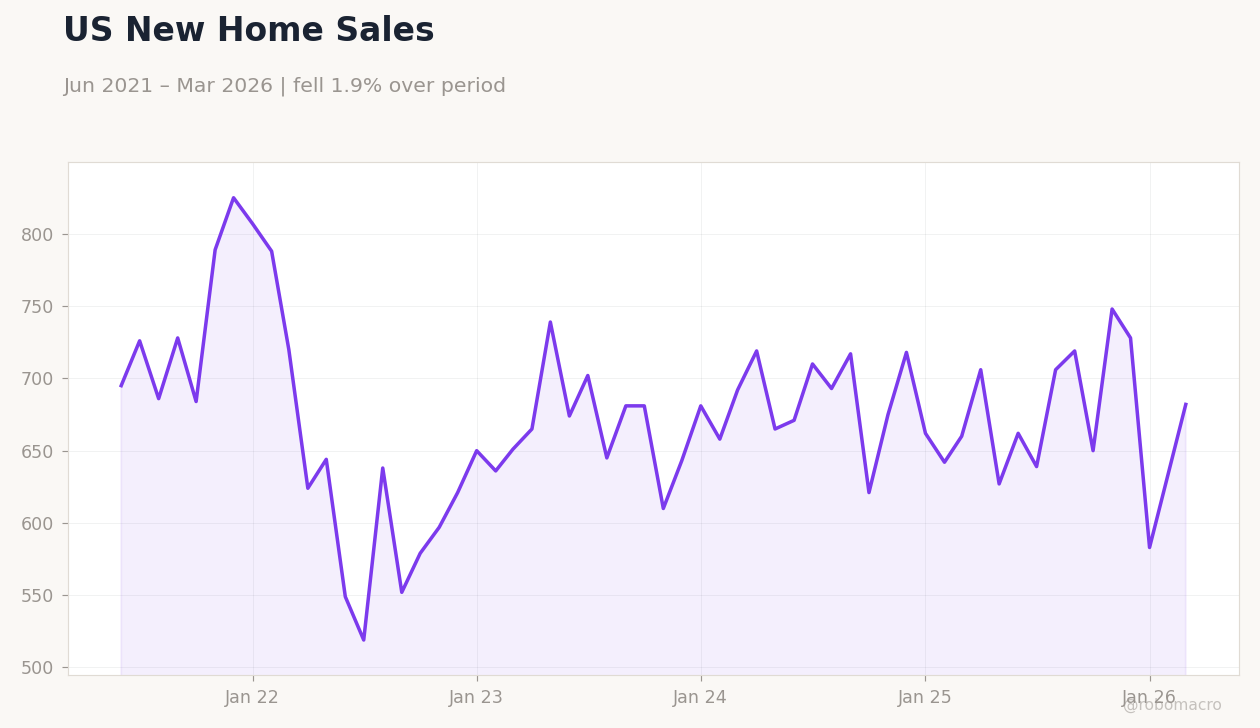
| New Home Sales | 583,000 | - | 635,000 |
| New Home Sales | 635,000 | 650,000 | 682,000 |
| New Home Sales Month-over-Month | 8.90 | - | 7.40 |
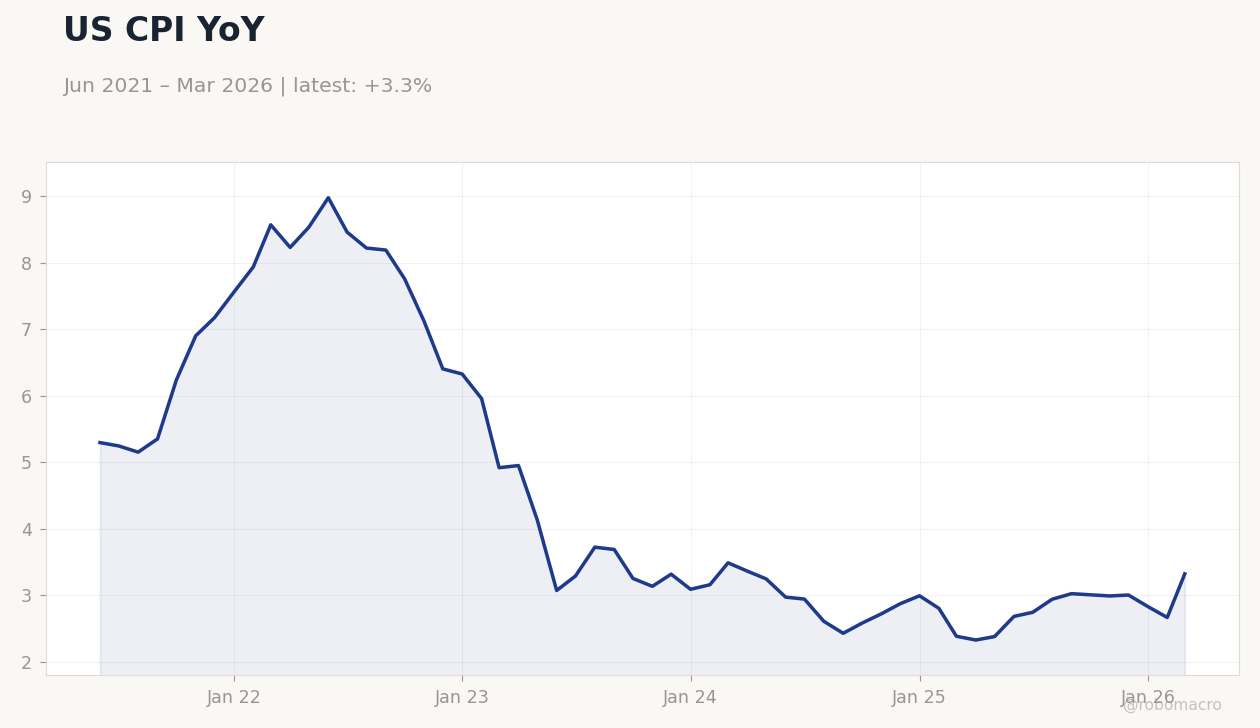 US CPI YoY | Type: macro_line | CPI (% YoY): 3.32 (2026-03-01) | Range: 2.325–8.979 | Trend(5pt): 5.296,8.223,3.251,2.871,3.32
Today's Economic Events
| Data | Prior | Cons | Time |
|---|---|---|---|
| Thursday (2026-05-07) | |||
| Nonfarm Productivity Quarter-over-Quarter Prel | 1.80 | 1.40 | 04:30 |
| Unit Labour Costs Quarter-over-Quarter Prel | 4.40 | 2.60 | 04:30 |
| Weekly Jobless Claims | 189,000 | 205,000 | 04:30 |
| Fed Hammack Speech | - | - | 10:05 |
| Speech by Fed's Williams | - | - | 11:30 |
| Friday (2026-05-08) | |||
| Fed Cook Speech | - | - | 01:45 |
| Headline Unemployment Rate | 4.30 | 4.30 | 04:30 |
| Payroll Jobs Growth | 178,000 | 60,000 | 04:30 |
- US data showed resilient labor and housing markets, with JOLTs openings beating estimates and new home sales surging.
- Equities rallied on soft yields, while USD weakened amid risk-on flows.
- Fed speakers emphasized inflation vigilance, supporting steady policy outlook.
Yesterday's Recap
Factory orders rose 1.5% month-over-month, exceeding the 0.5% consensus and signaling robust manufacturing demand. The trade balance came in at -$60.3 billion, slightly better than the -$60.9 billion expected, driven by exports climbing to $320.9 billion and imports at $381.2 billion. JOLTs job openings hit 6.866 million, topping the 6.84 million forecast and indicating sustained labor market strength despite prior cooling.
Services PMI dipped to 53.6, just below the 53.7 consensus but still in expansion territory. New home sales jumped to 682,000 units, with an 8.9% month-over-month gain, reflecting housing resilience amid lower mortgage rates. Equities surged, with the S&P 500 up 1.46% to 7,365.12, Nasdaq 100 rising 2.08% to 28,599.17, and Dow Jones gaining 1.24% to 49,910.59, fueled by tech outperformance and falling yields.
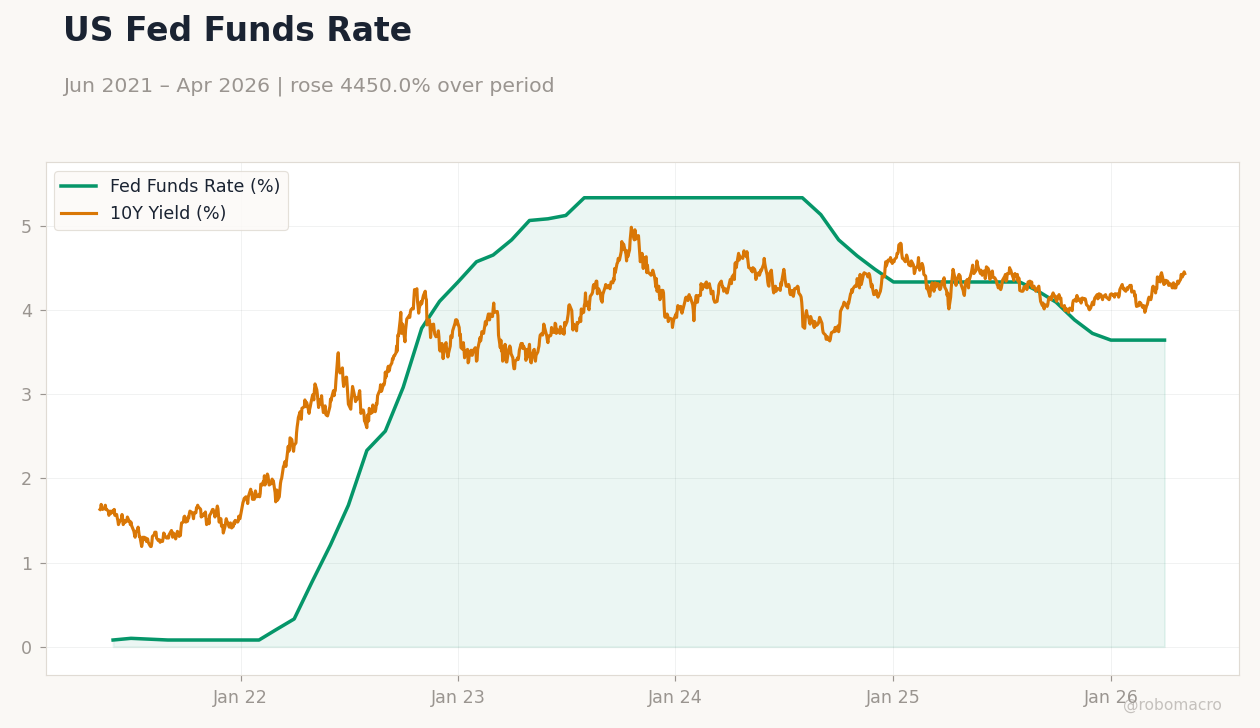
Treasury yields declined, with the 2-year at 3.93% (-0.51%) and 10-year at 4.43% (-0.45%), while USD/JPY fell 0.82% to 156.39 on dollar weakness.
The Day Ahead
Today's calendar features the MBA 30-year mortgage rate at 6.45%, up from 6.37%, which could highlight ongoing housing affordability pressures. ADP employment change reported 109,000 jobs added, beating the 99,000 consensus and providing an early gauge on private payrolls ahead of official nonfarm data. No major high-impact releases are scheduled, but markets will watch for any unscheduled Fed remarks.
Attention turns to potential volatility from global risk sentiment, with US indices poised to extend gains if labor signals remain firm. Broader events include monitoring Treasury auctions, though none are slated today. Overall, a quiet session may keep focus on yesterday's momentum.
Other Economic Notes
Broader US themes point to a bifurcated economy, with middle earners cutting spending as noted by Pandora, deepening income divides. Tariffs continue to inflict significant damage, warns economists, weighing on growth amid persistent inflation at 2.31% YoY CPI. Unemployment holds at 4.30%, underscoring labor market stability but raising questions on wage pressures.