US Macro Daily(Beta Mode)
Stocks Rally on Jobs Data
Market Snapshot
| Asset | Level | Change |
|---|---|---|
| S&P 500 | 7,398.93 | +0.84% |
| Nasdaq 100 | 29,234.99 | +2.35% |
| Dow Jones | 49,609.16 | +0.02% |
| Russell 2000 | 2,861.21 | +0.76% |
| USD/JPY | 157.13 | +0.19% |
| EUR/USD | 1.18 | +0.35% |
| GBP/USD | 1.36 | +0.25% |
| Gold | 4,673.00 | -1.00% |
| WTI Crude | 97.67 | +2.36% |
| Bitcoin | 80,968.77 | -1.42% |
| US 2Y Treasury | 3.92% | +1.29% |
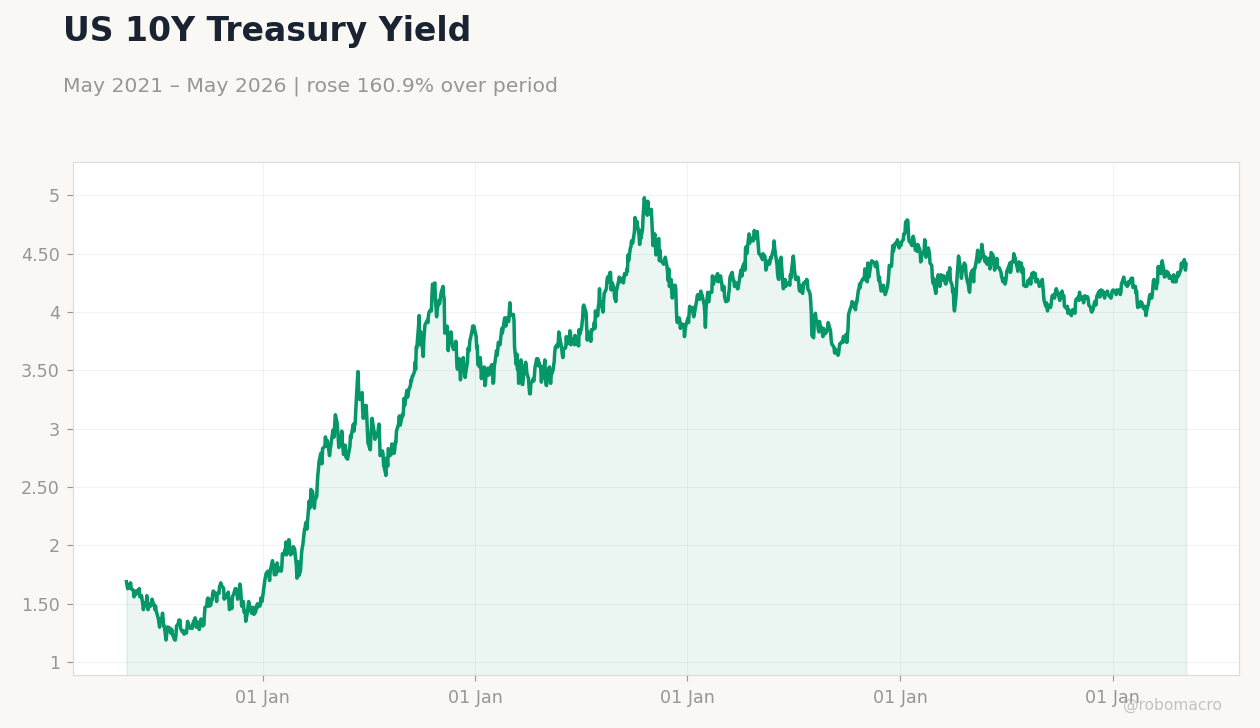
| US 10Y Treasury | 4.41% | +1.15% |
Prior Economic Events
| Data | Prior | Cons | Actual |
|---|---|---|---|
| No events available | |||
 US Unemployment Rate | Type: macro_line | Unemployment Rate (%): 4.3 (2026-04-01) | Range: 3.4–5.9 | Trend(5pt): 5.9,3.6,3.9,4.1,4.3
Today's Economic Events
| Data | Prior | Cons | Time |
|---|---|---|---|
| Existing Home Sales | 4.0m | 4.0m | 10:00 |
| Existing Home Sales Month-over-Month | -3.60 | - | 10:00 |
| Tuesday (2026-05-12) | |||
| Speech by Fed's Williams | - | - | 03:15 |
| ADP Employment Change Weekly | 39,250 | - | 08:15 |
| Core Inflation Rate Month-over-Month | 0.20 | 0.40 | 08:30 |
| Core Inflation Rate Year-over-Year | 2.60 | - | 08:30 |
| Inflation Rate Month-over-Month | 0.90 | 0.60 | 08:30 |
| Inflation Rate Year-over-Year | 3.30 | 3.40 | 08:30 |
| Consumer Price Index | 330.21 | - | 08:30 |
- US stocks climbed, Nasdaq up 2.35% on AI optimism and April's 115,000 job gains amid tensions.
- Yields rose with hawkish Fed tone; 10-year at 4.41%, up 1.15%.
- Inflation data looms Tuesday, core m/m consensus 0.4%.
Yesterday's Recap
US markets ended higher Friday, with the S&P 500 up 0.84% to 7,398.93 and Nasdaq 100 surging 2.35% to 29,234.99, fueled by AI enthusiasm and April's 115,000 job additions despite geopolitical strains. The Dow Jones rose 0.02% to 49,609.16, and Russell 2000 gained 0.76% to 2,861.21, showing widespread gains. Treasury yields increased, with the 2-year at 3.92% up 1.29% and 10-year at 4.41% up 1.15%, reflecting hawkish Fed remarks on inflation.
USD/JPY climbed 0.19% to 157.13, while EUR/USD rose 0.35% to 1.18 and GBP/USD 0.25% to 1.36. Gold fell 1.00% to 4,673.00, WTI crude rose 2.36% to 97.67, and Bitcoin dipped 1.42% to 80,968.77. No major data releases occurred yesterday.
The Day Ahead
Today features Existing Home Sales at 10:00 ET, consensus 4.05 million units after prior 3.98 million and -3.6% m/m. A robust figure may highlight housing strength despite high rates, aiding stocks but lifting yields. Tuesday includes Fed's Williams speech at 03:15 ET and Goolsbee at 13:00 ET, potentially clarifying rate outlook.
Key data: core inflation m/m consensus 0.4%, headline m/m 0.6% and y/y 3.4%. Also, ADP Employment Change at 08:15 ET, Monthly Budget Statement at 14:00 ET, and API Crude Stocks at 16:30 ET.
Other Economic Notes
US labor remains solid, with April unemployment at 4.30% bolstering spending amid inflation. Beef imports rise as demand surges and prices climb, possibly fueling food inflation. Aritzia's record Q4 revenue, hitting 2027 targets early, signals strong US retail expansion.
Renewables investments boom, surpassing Big Oil even in the US, amid Hormuz crisis and energy shifts.
Global Macro News
Japan coordinates with the US and Bank of Japan to defend the yen against pressures, with hawkish stances questioning intervention sustainability, affecting USD/JPY and US exporters. UK local elections saw Reform UK's landslide, costing Labour 200 seats and signaling political upheaval that may impact US-UK trade. Europe's €11 billion in energy shock cushions aim to ease household and industry burdens, reflecting commodity-driven inflation risks influencing US oil and beef imports.
<i>↓ p.2</i>