US Macro Daily(Beta Mode)
Home Sales Beat as CPI Looms
Market Snapshot
| Asset | Level | Change |
|---|---|---|
| S&P 500 | 7,334.45 | -0.96% |
| Nasdaq 100 | 28,885.96 | -1.80% |
| Dow Jones | 50,546.47 | -0.47% |
| Russell 2000 | 2,843.55 | -0.42% |
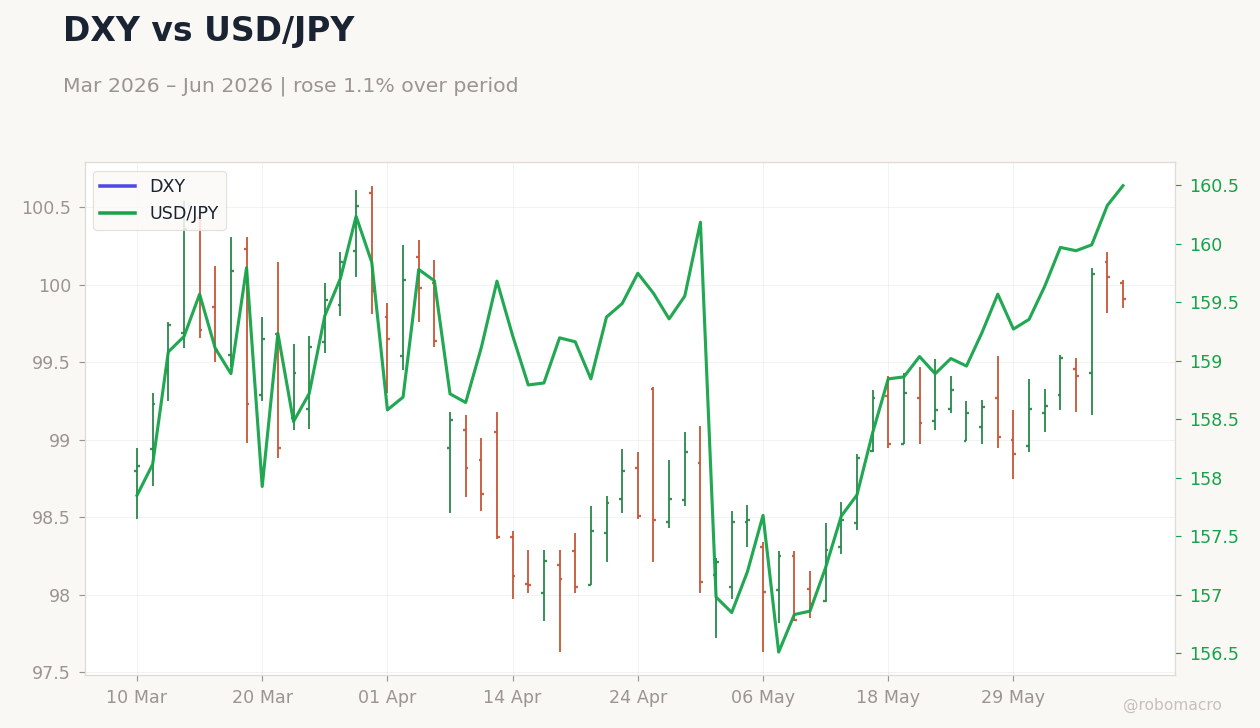
| USD/JPY | 160.46 | +0.18% |
| EUR/USD | 1.16 | +0.23% |
| GBP/USD | 1.34 | +0.43% |
| Gold | 4,198.00 | -1.46% |
| WTI Crude | 88.02 | -0.20% |
| Bitcoin | 61,300.00 | -0.56% |
| US 2Y Treasury | - | - |
| US 10Y Treasury | - | - |
Prior Economic Events
| Data | Prior | Cons | Actual |
|---|---|---|---|
| ADP Employment Change Weekly | 30,500 | - | 29,000 |
| Trade Balance | -56,600m | -56,100m | -55,900m |
| Exports Level | 318,800m | - | 327,100m |
| Imports Level | 375,400m | - | 383,000m |
| Existing Home Sales | 4.0m | 4.1m | 4.2m |
| Existing Home Sales Month-over-Month | 0.70 | - | 3.20 |
| Eia Short-Term Energy Outlook | - | - | "" |
 US Trade Balance (BOPGSTB) | Type: macro_line | USD Billion: -5.588e+04 (2026-04-01) | Range: -1.33e+05–-3.738e+04 | Trend(6pt): -6.744e+04,-6.691e+04,-6.426e+04,-1.247e+05,-5.658e+04,-5.588e+04
Today's Economic Events
| Data | Prior | Cons | Time |
|---|---|---|---|
| MBA 30-Year Mortgage Rate | 6.57 | - | 07:00 |
| Core Inflation Rate Month-over-Month | 0.40 | 0.30 | 08:30 |
| Core Inflation Rate Year-over-Year | 2.80 | 2.90 | 08:30 |
| Inflation Rate Month-over-Month | 0.60 | 0.50 | 08:30 |
| Inflation Rate Year-over-Year | 3.80 | 4.20 | 08:30 |
| Consumer Price Index | 333.02 | 335.11 | 08:30 |
| Consumer Price Index SA | 332.41 | - | 08:30 |
| EIA Weekly Crude Oil Inventory | -8.0m | -5.1m | 10:30 |
| EIA Weekly Gasoline Inventory | 3.4m | - | 10:30 |
| Monthly Budget Statement | 215,000m | -275m | 14:00 |
- Existing home sales jumped 3.2% MoM to 4.17 million, beating forecasts
- Trade balance narrowed to -$55.9 billion on stronger exports
- Equities fell with S&P 500 down 0.96% ahead of CPI
Yesterday's Recap
Existing home sales rose to 4.17 million units in May, exceeding the 4.07 million consensus and marking a 3.2% monthly gain that signals housing market resilience. The trade deficit narrowed to $55.9 billion as exports climbed to $327.1 billion while imports reached $383.0 billion. ADP employment change printed 29,000, slightly below the prior 30,500 reading.
Markets reacted with the S&P 500 falling 0.96% to 7,334.45, Nasdaq 100 dropping 1.80% to 28,885.96, and gold declining 1.46% to 4,198. WTI crude eased 0.20% to 88.02 amid mixed energy signals. Broader equity weakness extended to the Dow Jones, which slipped 0.47% to 50,546.47, while USD/JPY edged 0.18% higher to 160.46.
The Day Ahead
Core CPI is expected to rise 0.3% MoM and 2.9% YoY, with headline inflation seen at 0.5% MoM and 4.2% YoY. The MBA 30-year mortgage rate release at 7:00 a.m. ET will provide fresh borrowing cost data.
EIA weekly crude inventories follow at 10:30 a.m. ET. No Federal Reserve speakers are scheduled.
Markets will focus on whether the inflation prints alter expectations for the 3.62% fed funds rate path.
Other Economic Notes
The Federal Reserve will publish annual bank stress test results on June 24 at 4 p.m. ET, though officials noted the outcomes will not alter current capital requirements. Unemployment stood at 4.3% in May, reflecting a still-solid labor market.
Housing data strength may support consumer spending but leaves little room for near-term policy easing.
Global Macro News
China's May exports rose 19.4% despite regional tensions, offering a positive signal for global trade flows. US forces disabled an oil tanker in the Gulf of Oman linked to Iran, adding to energy market volatility. Gold's reserve status gained further attention as central banks diversify away from US Treasuries.
Canada's trade surplus reached its largest level since before recent tariff shifts. European capital continues to fund Australian infrastructure projects amid the energy transition. Kenya and the US launched a $1.6 billion health partnership despite prior legal delays.
Indian growth faces rising costs tied to Middle East developments.