US Macro Daily(Beta Mode)
Housing Slump Clouds Outlook for Fed Hold
Market Snapshot
| Asset | Level | Change |
|---|---|---|
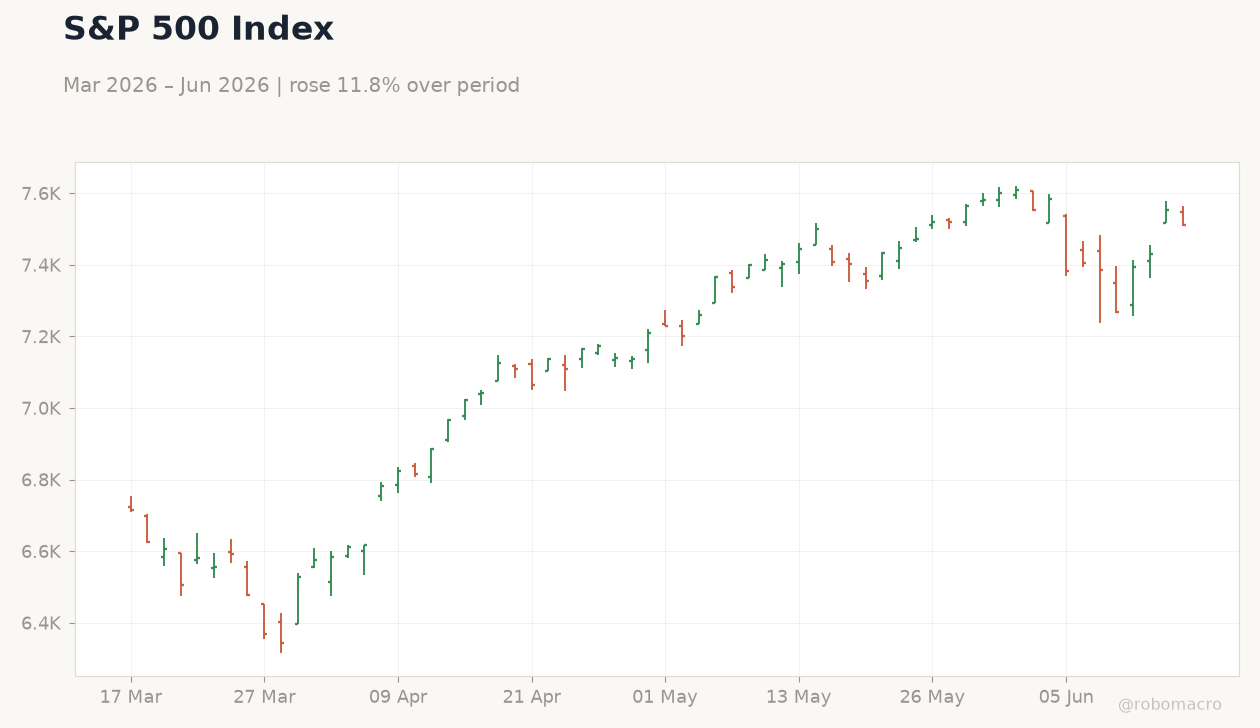
| S&P 500 | 7,511.35 | -0.57% |
| Nasdaq 100 | 29,968.13 | -1.89% |
| Dow Jones | 51,999.67 | +0.64% |
| Russell 2000 | 2,939.20 | -0.87% |
| USD/JPY | 160.30 | +0.05% |
| EUR/USD | 1.16 | +0.02% |
| GBP/USD | 1.34 | -0.06% |
| Gold | 4,344.30 | +0.31% |
| WTI Crude | 76.04 | -0.01% |
| Bitcoin | 64,724.28 | -1.34% |
| US 2Y Treasury | 4.07% | -0.49% |
| US 10Y Treasury | 4.47% | -0.22% |
Prior Economic Events
| Data | Prior | Cons | Actual |
|---|---|---|---|
| NY Empire State Manufacturing Index | 19.60 | 14 | 5.70 |
| Industrial Production Month-over-Month | 0.90 | 0.30 | 0.10 |
| NAHB Housing Market Index | 37 | 36 | 35 |
| ADP Employment Change Weekly | 29,000 | - | 25,500 |
| Building Permits Prel | 1.4m | 1.4m | 1.4m |
| Housing Starts Level | 1.4m | 1.4m | 1.2m |
| Building Permits Month-over-Month Prel | 4.40 | - | -0.70 |
| Export Prices Month-over-Month | 3.50 | 1.20 | 1.30 |
| Housing Starts Month-over-Month | -8.50 | - | -15.40 |
| Import Prices Month-over-Month | 2 | 1 | 1.90 |
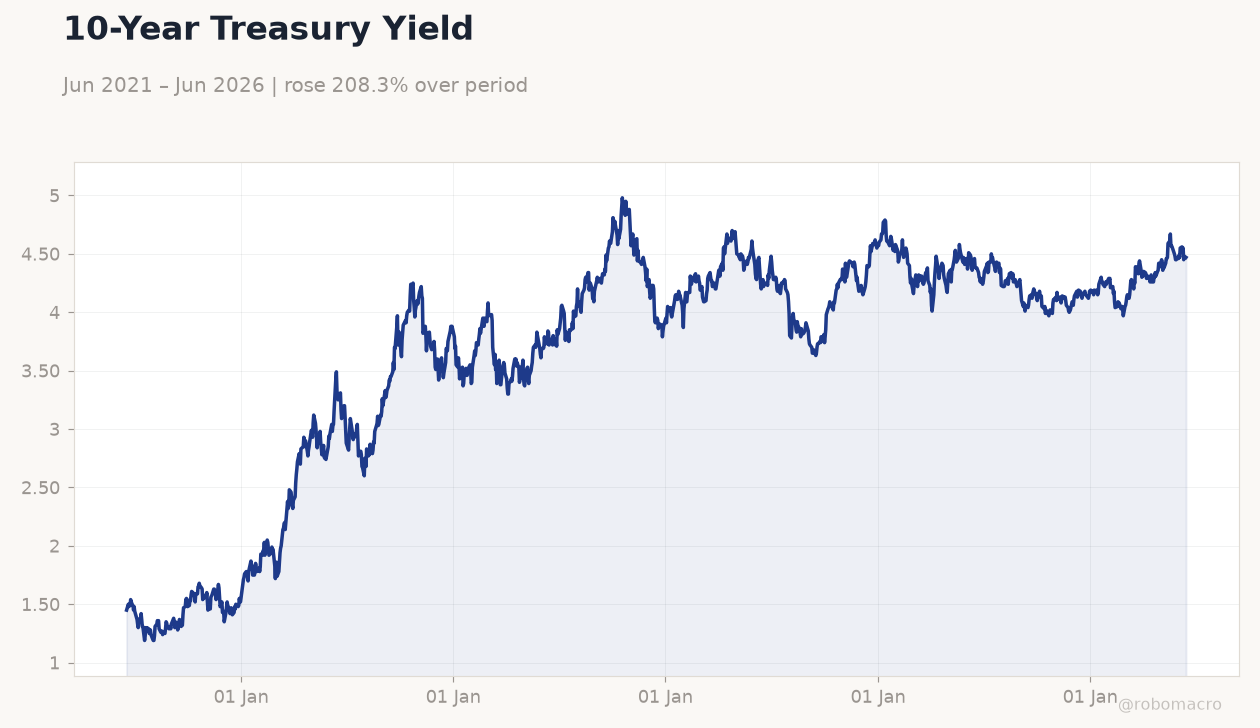 10-Year Treasury Yield | Type: macro_line | Percent: 4.47 (2026-06-15) | Range: 1.19–4.98 | Trend(6pt): 1.45,3.45,4.04,4.31,4.45,4.47
Today's Economic Events
| Data | Prior | Cons | Time |
|---|---|---|---|
| Retail Sales Month-over-Month | 0.50 | 0.50 | 04:30 |
| Retail Sales Control Group Month-over-Month | 0.50 | 0.40 | 04:30 |
| Retail Sales Excluding Autos Month-over-Month | 0.70 | 0.50 | 04:30 |
| Business Inventories Month-over-Month | 0.90 | 0.50 | 06:00 |
| Pending Home Sales Month-over-Month | 1.40 | 0.80 | 06:00 |
| Pending Home Sales Year-over-Year | 3.20 | - | 06:00 |
| EIA Weekly Crude Oil Inventory | -7.2m | -4.6m | 06:30 |
| EIA Weekly Gasoline Inventory | 186,000 | -1m | 06:30 |
| FOMC Economic Projections | - | - | 10:00 |
| Fed Interest Rate Decision | 3.75 | 3.75 | 10:00 |
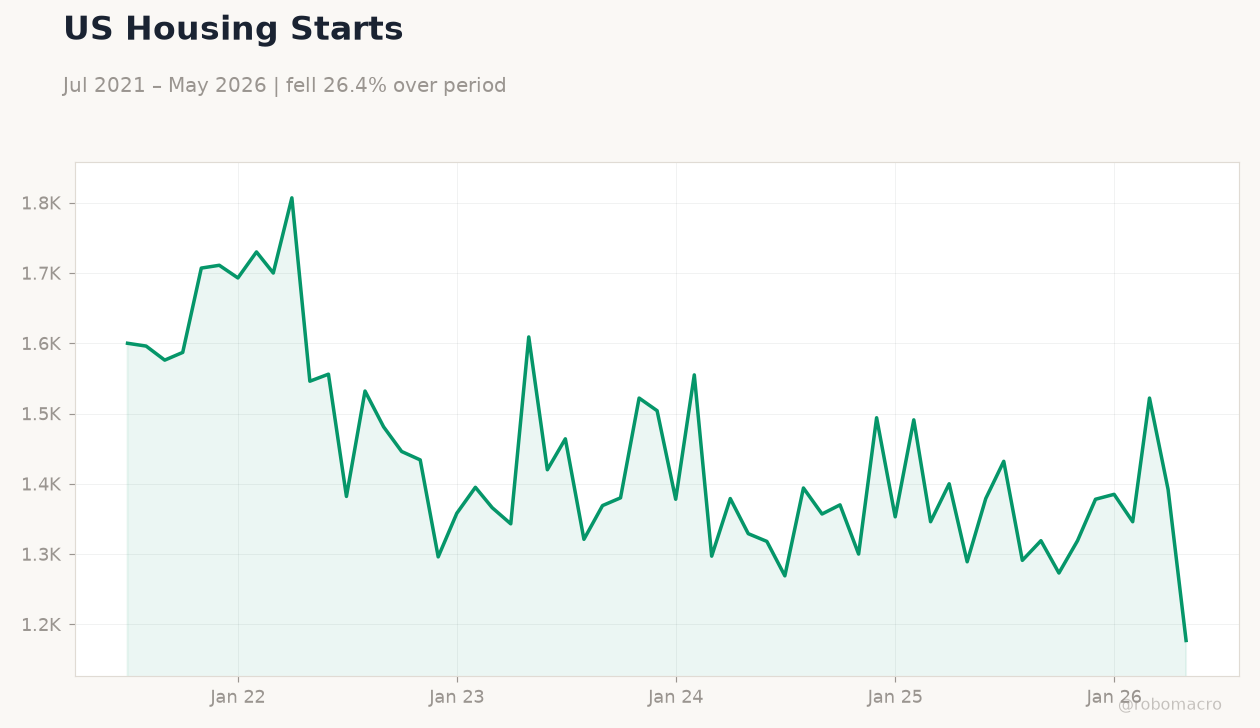
- US housing starts plunged 15.4% m/m to 1.177 million in May, well below consensus, signaling sharp contraction in residential activity.
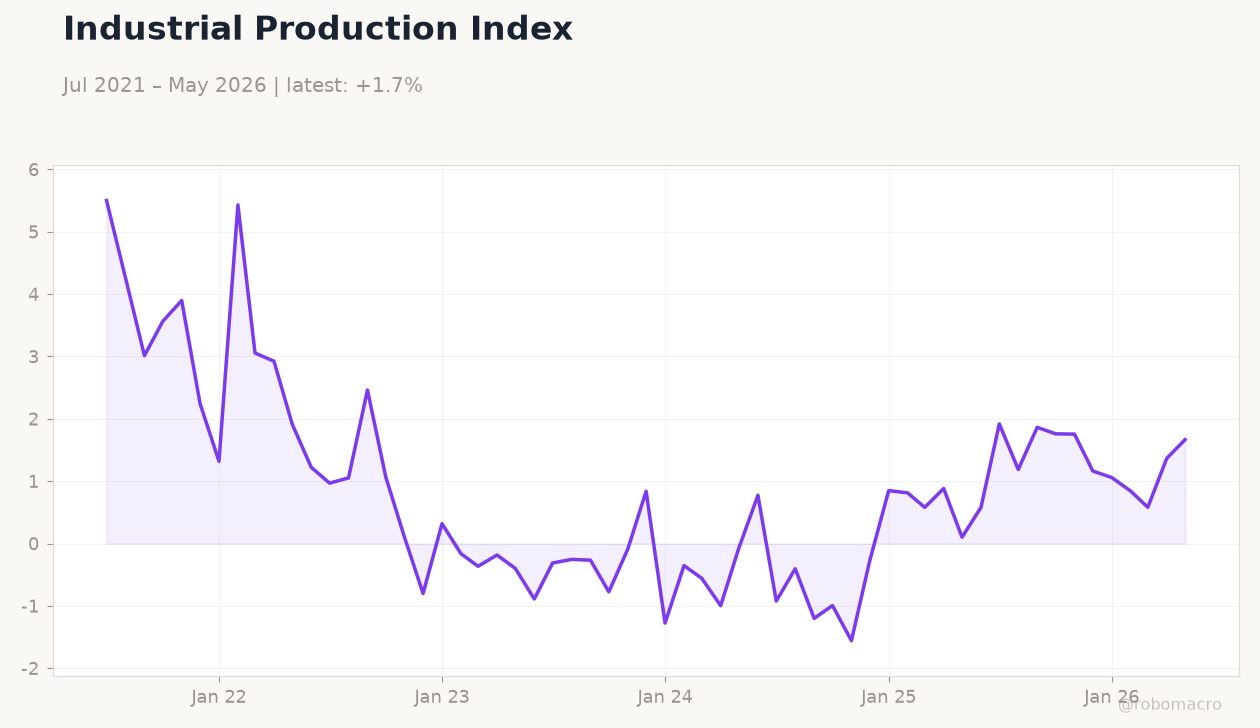
- Industrial production rose just 0.1% m/m while Empire State manufacturing index fell to 5.7, pointing to broad softening in factory output.
- Markets mixed with Nasdaq down 1.89% as investors positioned ahead of today’s retail sales and the FOMC decision under new Chair Warsh.
Yesterday's Recap
Housing starts collapsed to 1.177 million, missing consensus by a wide margin and extending the prior month’s decline. Building permits edged lower to 1.413 million while the NAHB index slipped to 35. Industrial production grew only 0.1% m/m against expectations of 0.3%, and the Empire State manufacturing gauge dropped sharply to 5.7.
Export and import prices rose modestly, leaving little inflation impulse. Equities closed mixed as the Dow rose 0.64% but the Nasdaq fell 1.89%; the 10-year Treasury yield declined 2 bp to 4.47%. Oil held near $76 and the dollar was little changed versus major crosses.
The Day Ahead
Retail sales for May are due at 8:30 a.m. ET with consensus calling for a 0.5% m/m gain; the control group is expected to rise 0.4%. Housing-market data already released yesterday will keep focus on whether lower mortgage rates are supporting activity.
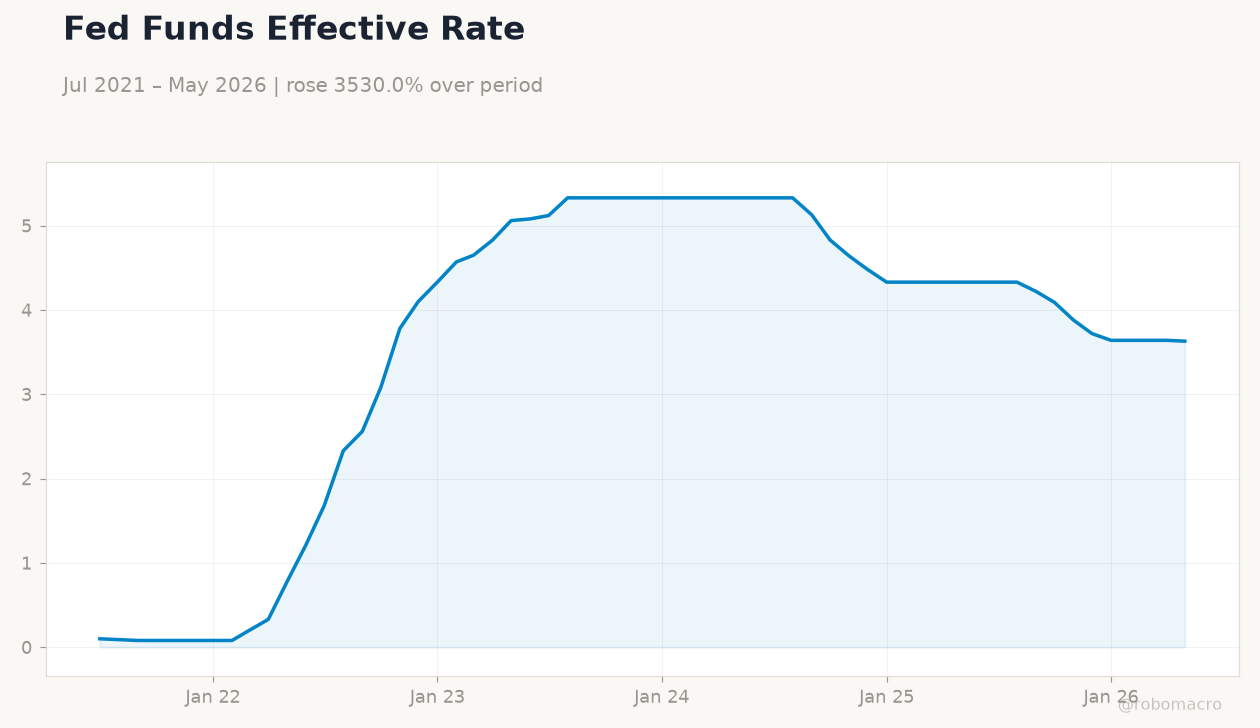
The FOMC begins its two-day policy meeting today under new Chair Kevin Warsh; no speakers are scheduled. Markets price a steady 3.63% fed funds rate with the first cut still seen for July. API crude stocks data will provide a late update on energy inventories.
Other Economic Notes
Recent tariff exclusions on Chinese semiconductor equipment have eased some supply-chain pressures for manufacturers. Small businesses continue to cite higher energy costs and tariff effects as constraints on margins. Broader labor-market indicators remain consistent with the 4.3% unemployment rate, supporting a gradual cooling narrative without abrupt deterioration.
Treasury yields have moved lower this week, reflecting tempered growth expectations rather than aggressive policy-easing bets.
Global Macro News
G7 leaders meeting in Évian discussed limiting access to advanced US AI technology, adding a layer of uncertainty to global tech supply chains. European Central Bank minutes showed a dovish tilt that weighed on the euro and supported USD crosses. Mexico and Canada tourism data highlighted US strength in attracting visitors for major events, providing a modest boost to service-sector activity.
<i>↓ p.2</i>