US Macro Daily(Beta Mode)
Home Sales Slump Offsets PMI Gains
Market Snapshot
| Asset | Level | Change |
|---|---|---|
| S&P 500 | 7,407.92 | +0.58% |
| Nasdaq 100 | 29,421.09 | +0.25% |
| Dow Jones | 52,138.29 | +0.91% |
| Russell 2000 | 3,012.80 | +1.25% |
| USD/JPY | 161.60 | +0.02% |
| EUR/USD | 1.13 | -0.28% |
| GBP/USD | 1.32 | -0.24% |
| Gold | 4,000.40 | +0.25% |
| WTI Crude | 69.58 | -1.08% |
| Bitcoin | 61,200.61 | +0.34% |
| US 2Y Treasury | 4.16% | -1.89% |
| US 10Y Treasury | 4.50% | -0.22% |
Prior Economic Events
| Data | Prior | Cons | Actual |
|---|---|---|---|
| Speech by Fed's Waller | - | - | - |
| ADP Employment Change Weekly | 26,500 | - | 30,750 |
| S&P Global Composite PMI Flash | 51.50 | - | 52.20 |
| S&P Global Manufacturing PMI Flash | 55.10 | 54.80 | 55.70 |
| S&P Global Services PMI Flash | 50.70 | 51 | 51.30 |
| MBA 30-Year Mortgage Rate | 6.60 | - | 6.59 |
| Current Account Balance | -221,100m | -217,500m | -226,800m |
| New Home Sales | 626,000 | 640,000 | 580,000 |
| New Home Sales Month-over-Month | -5.70 | - | -7.30 |
| EIA Weekly Crude Oil Inventory | -8.3m | -4.5m | -6.1m |
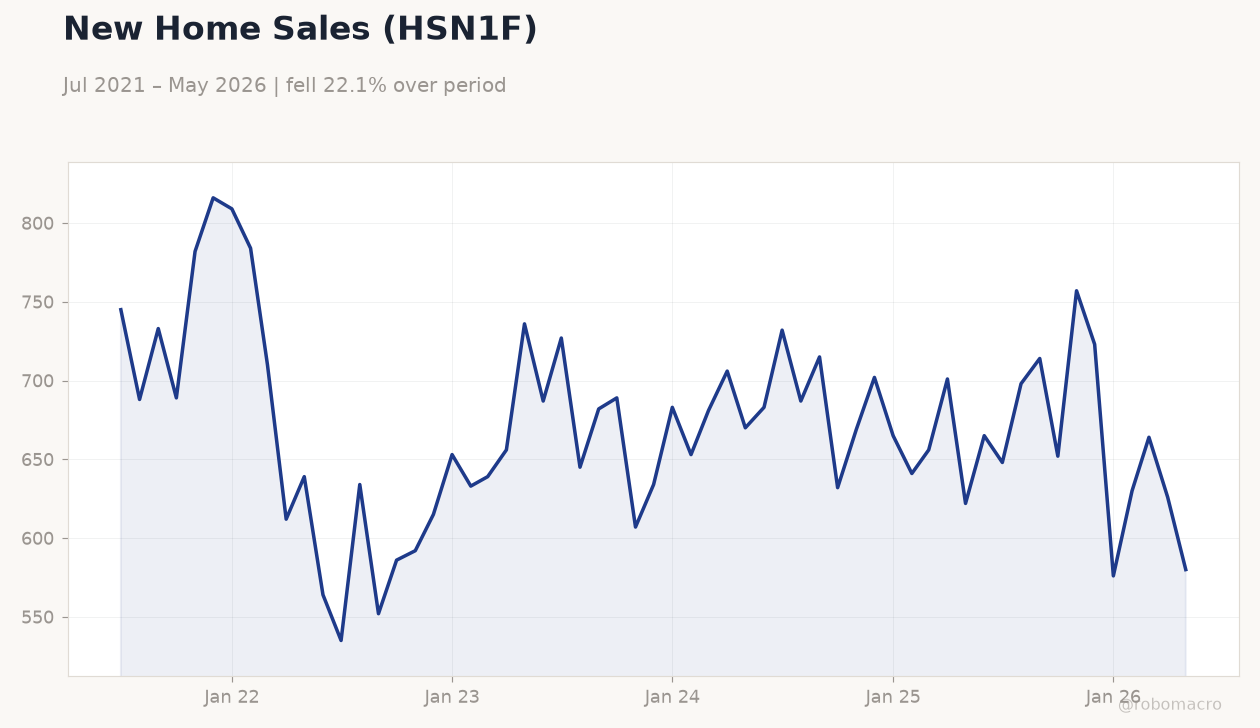 New Home Sales (HSN1F) | Type: macro_line | Units (000s): 580 (2026-05-01) | Range: 535–816 | Trend(6pt): 745,552,607,665,664,580
Today's Economic Events
| Data | Prior | Cons | Time |
|---|---|---|---|
| Core PCE Price Index Month-over-Month | 0.20 | 0.30 | 04:30 |
| Durable Goods Orders Month-over-Month | 7.90 | -4.50 | 04:30 |
| GDP Growth Quarter-over-Quarter Final Estimate | 0.50 | 1.60 | 04:30 |
| Personal Income Month-over-Month | 0 | 0.40 | 04:30 |
| Personal Spending Month-over-Month | 0.50 | 0.60 | 04:30 |
| Chicago Fed National Activity Index | 0.14 | - | 04:30 |
| Durable Goods Orders Ex Transp Month-over-Month | 1.10 | 0.60 | 04:30 |
| GDP Price Index Quarter-over-Quarter Final | 3.60 | - | 04:30 |
| PCE Price Index Month-over-Month | 0.40 | 0.50 | 04:30 |
| PCE Price Index Year-over-Year | 3.80 | 4.10 | 04:30 |
- S&P Global flash PMIs beat expectations with manufacturing at 55.7 and services at 51.3, signaling resilient activity.
- New home sales fell to 580k, missing consensus and extending the prior decline to 7.3% month-over-month.
- Large banks passed the Fed stress test, confirming capital buffers sufficient for a severe recession scenario.
Yesterday's Recap
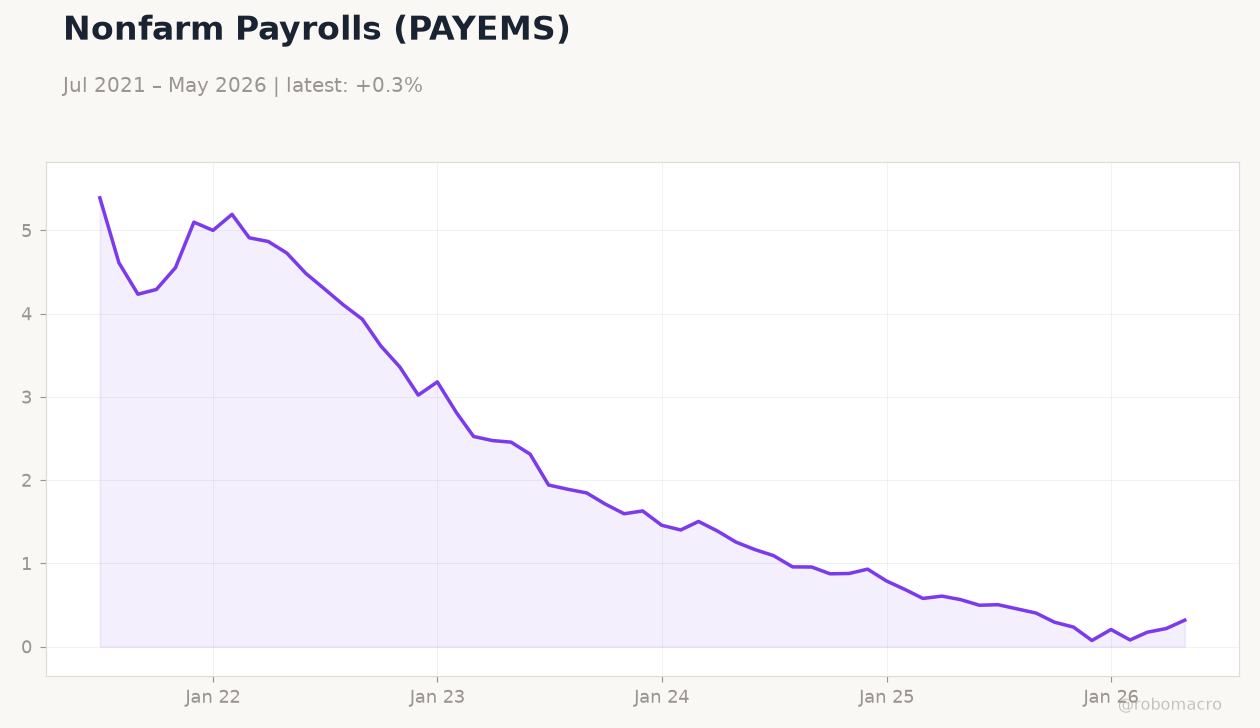
US data showed mixed signals on June 24. S&P Global manufacturing PMI rose to 55.7 versus 54.8 expected while services PMI reached 51.3. ADP employment change printed 30,750.
New home sales dropped sharply to 580,000 from 626,000 prior, with the current account deficit widening to $226.8 billion. The MBA 30-year mortgage rate eased to 6.59%. Equity markets advanced, with the S&P 500 rising 0.58% to 7,407.92 and the Dow Jones gaining 0.91%.
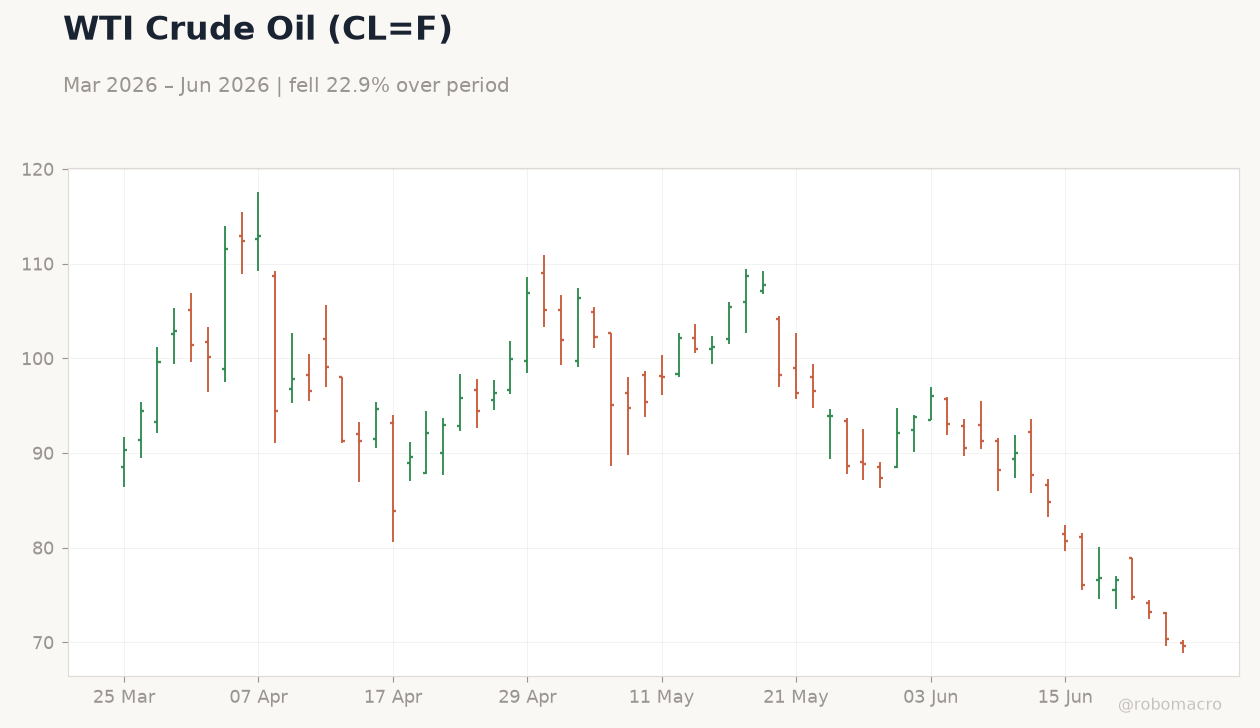
The 2-year Treasury yield fell 1.89% to 4.16% while WTI crude declined 1.08% to $69.58. The Fed released annual stress test results showing large banks remain well capitalized.
The Day Ahead
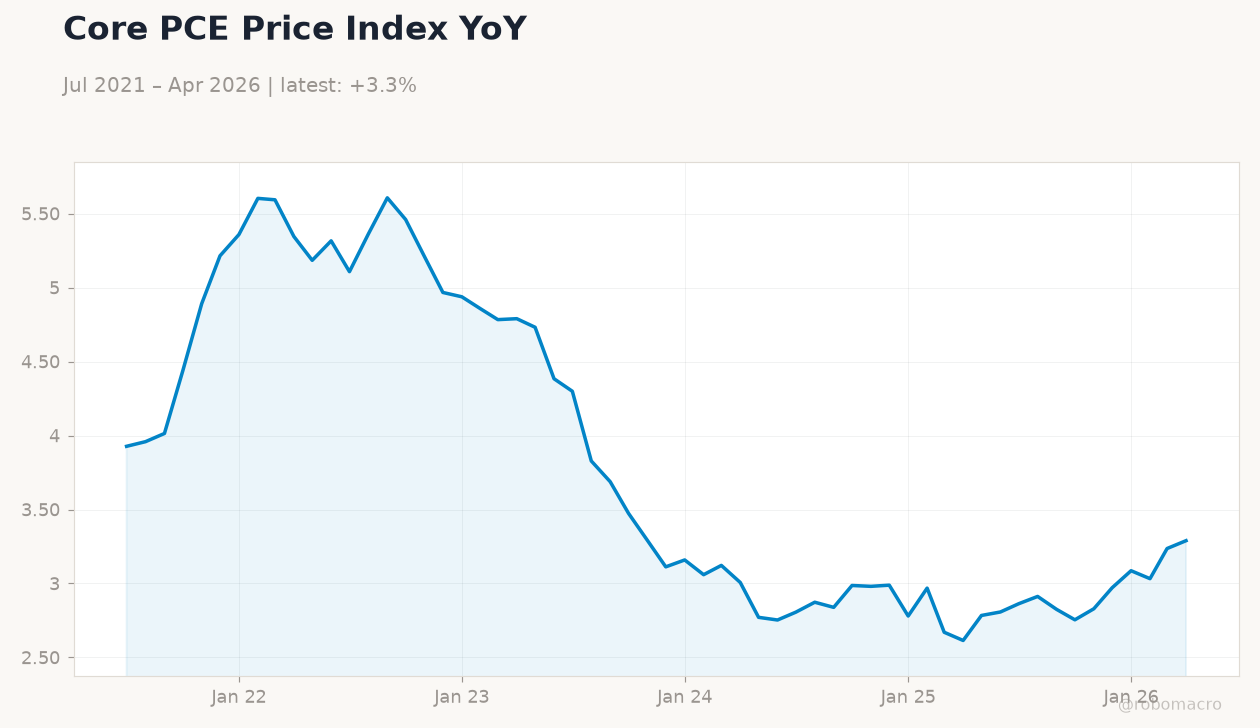
Core PCE month-over-month is due at 8:30 ET with consensus at 0.3% after 0.2% prior. Durable goods orders are expected to contract 4.5% following a 7.9% surge. GDP growth quarter-over-quarter will also print.
Markets will parse these releases for inflation and demand clues ahead of the next FOMC meeting. No Fed speakers are scheduled. Oil inventory data and any follow-through on stress test commentary could influence Treasury yields and the dollar.
Other Economic Notes
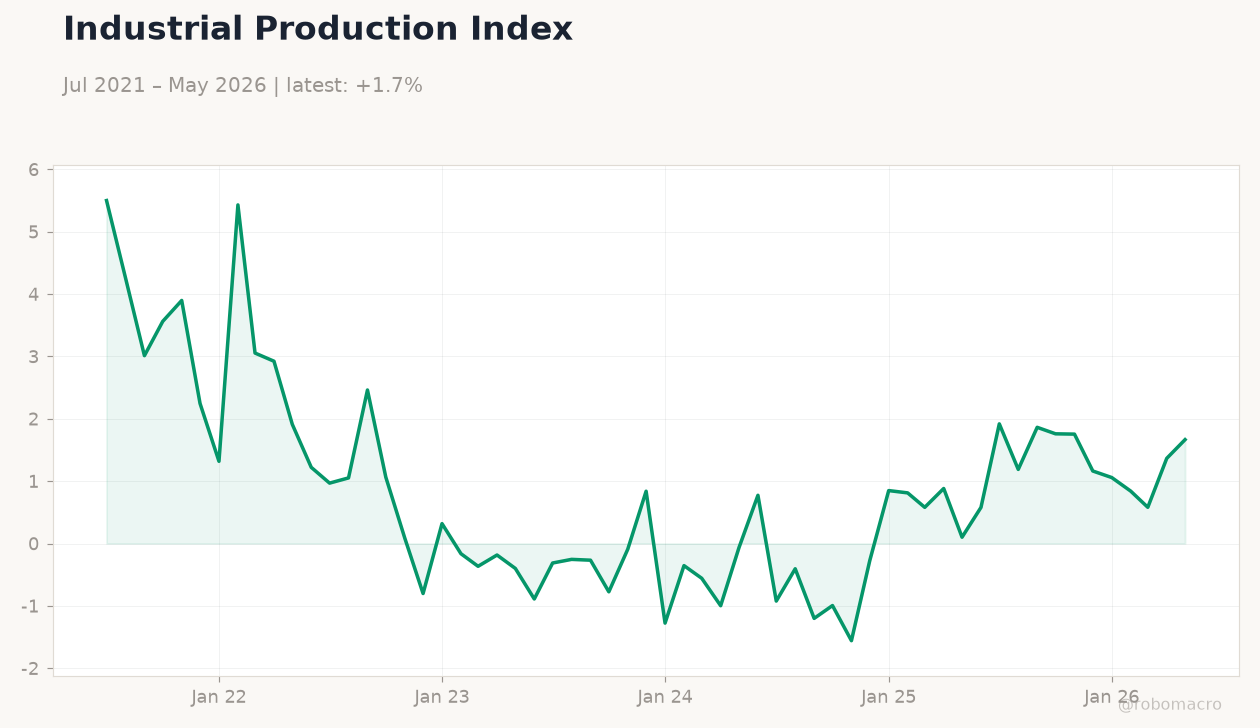
The US unemployment rate stands at 4.3% while CPI inflation runs at 2.31% year-over-year. The Fed funds rate remains at 3.63%. These levels support expectations for measured policy adjustment rather than aggressive easing.
Recent PMI strength suggests underlying activity has not yet cooled enough to alter the current stance. Housing data weakness, however, highlights sensitivity to elevated borrowing costs.
Global Macro News
Brent crude fell below $75 for the first time since the Middle East conflict eased after the US-Iran deal. The European Commission plans to issue 80 billion euros in bonds to fund NextGenerationEU disbursements. US Secretary of State Rubio assured Gulf states of continued protection of their interests ahead of Iran talks.
<i>↓ p.2</i>