US Macro Daily(Beta Mode)
Core PCE Holds as Home Sales Slump
Market Snapshot
| Asset | Level | Change |
|---|---|---|
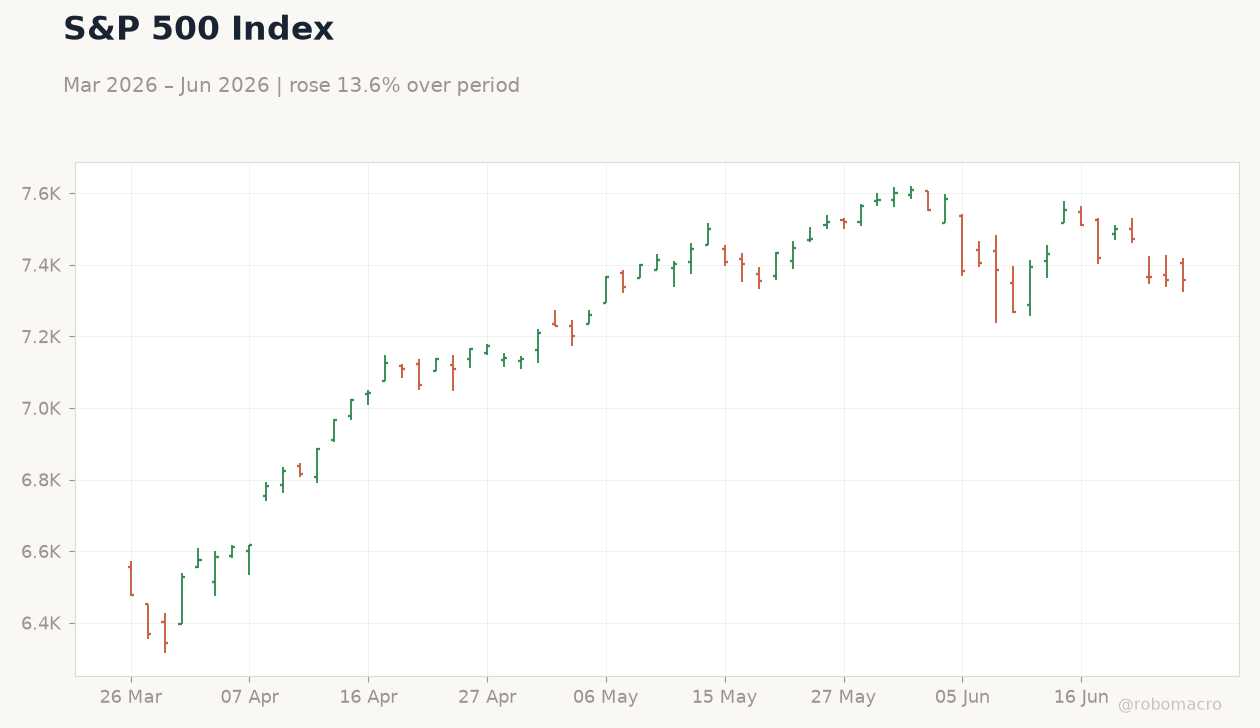
| S&P 500 | 7,358.22 | -0.10% |
| Nasdaq 100 | 29,220.06 | -0.43% |
| Dow Jones | 51,848.90 | +0.35% |
| Russell 2000 | 2,986.63 | +0.37% |
| USD/JPY | 161.68 | -0.05% |
| EUR/USD | 1.14 | +0.47% |
| GBP/USD | 1.32 | +0.32% |
| Gold | 4,060.40 | +0.74% |
| WTI Crude | 69.73 | -3.05% |
| Bitcoin | 59,679.19 | -0.07% |
| US 2Y Treasury | 4.11% | -1.20% |
| US 10Y Treasury | 4.41% | -2.00% |
Prior Economic Events
| Data | Prior | Cons | Actual |
|---|---|---|---|
| Speech by Fed's Waller | - | - | - |
| ADP Employment Change Weekly | 26,500 | - | 30,750 |
| S&P Global Composite PMI Flash | 51.50 | - | 52.20 |
| S&P Global Manufacturing PMI Flash | 55.10 | 54.80 | 55.70 |
| S&P Global Services PMI Flash | 50.70 | 51 | 51.30 |
| MBA 30-Year Mortgage Rate | 6.60 | - | 6.59 |
| Current Account Balance | -221,100m | -217,500m | -226,800m |
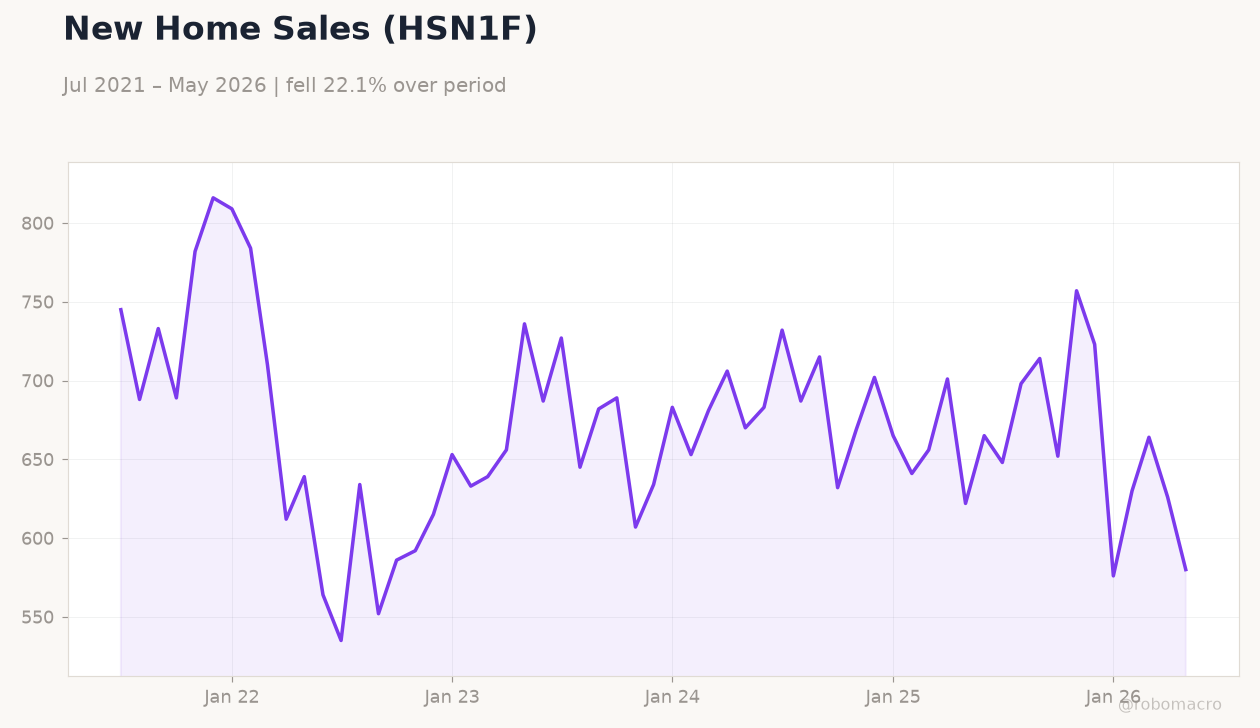
| New Home Sales | 626,000 | 640,000 | 580,000 |
| New Home Sales Month-over-Month | -5.70 | - | -7.30 |
| EIA Weekly Crude Oil Inventory | -8.3m | -4.5m | -6.1m |
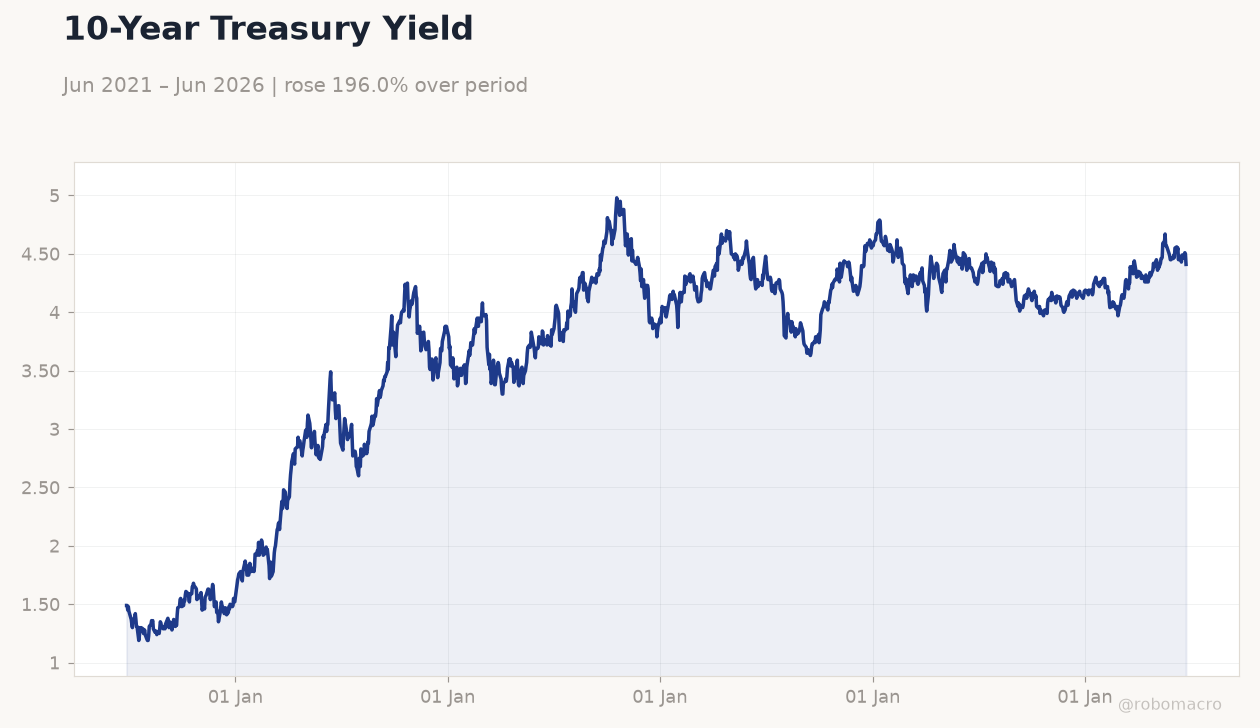 10-Year Treasury Yield | Type: macro_line | %: 4.41 (2026-06-24) | Range: 1.19–4.98 | Trend(6pt): 1.49,3.69,3.89,4.34,4.51,4.41
Today's Economic Events
| Data | Prior | Cons | Time |
|---|---|---|---|
| Goods Trade Balance Adv | -83,000m | -85,000m | 04:30 |
| Retail Inventories Ex Autos Month-over-Month Adv | 0.60 | - | 04:30 |
| Wholesale Inventories Month-over-Month Adv | 0.60 | 0.20 | 04:30 |
| Michigan Consumer Sentiment Final | 44.80 | 50 | 06:00 |
| Speech by Fed's Williams | - | - | 06:30 |
| Speech by Fed's Kashkari | - | - | 07:30 |
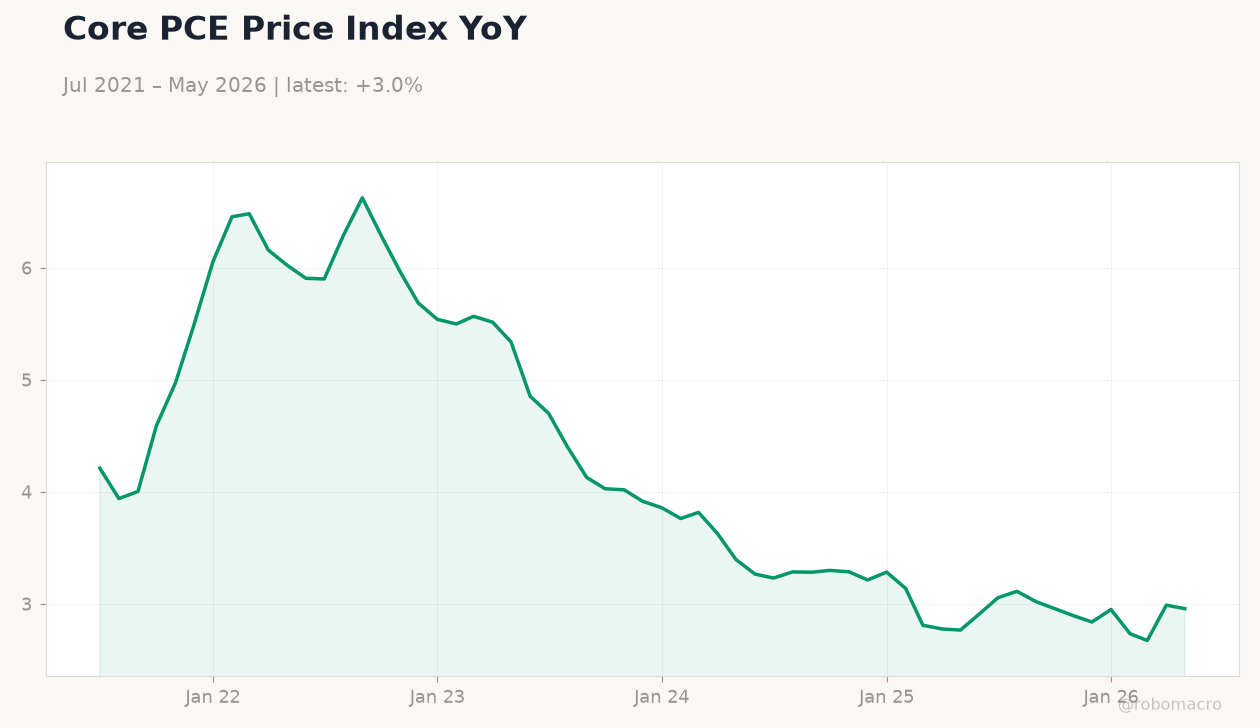
- Core PCE rises 0.3% m/m as expected while final Q1 GDP reaches 2.1% annualized
- New home sales drop to 580k versus 640k consensus, extending housing weakness
- S&P 500 slips 0.10% as 10-year Treasury yield falls 2% to 4.41%
Yesterday's Recap
Core PCE Price Index rose 0.3% month-over-month, matching consensus and prior reading, while the final Q1 GDP print came in at 2.1% annualized. New home sales plunged to 580,000, well below the 640,000 consensus, and the current account deficit widened to $226.8 billion. S&P Global Composite PMI edged up to 52.2, with manufacturing at 55.7 and services at 51.3.
ADP employment change printed 30,750. Markets saw the S&P 500 close at 7,358.22, down 0.10%, while the Dow rose 0.35% to 51,848.90 and the 10-year Treasury yield declined to 4.41%. Gold advanced 0.74% to $4,060.40 as WTI crude fell 3.05% to $69.73.
The Day Ahead
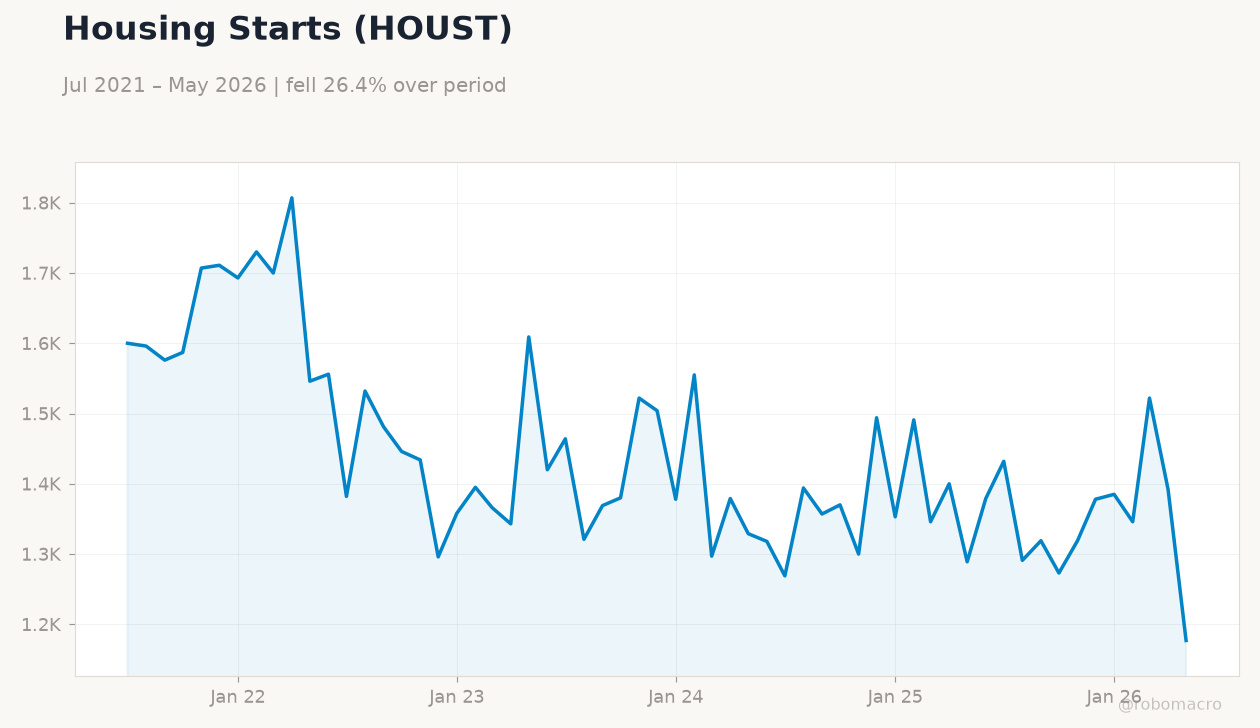
Markets will monitor follow-through from yesterday’s stress test results, which showed banks maintaining capital above minimums even under a severe recession scenario. Weekly jobless claims and any revisions to housing data could influence rate expectations. Treasury futures and equity volatility are likely to remain elevated ahead of potential Fed speakers.
Oil inventory draws and any updates on durable goods orders may add to price action in energy and manufacturing sectors. Currency markets will track USD/JPY near 161.68 and EUR/USD at 1.14 for signs of further dollar softening.
Other Economic Notes
US CPI stands at 2.31% year-over-year and unemployment at 4.30%, supporting the view of a cooling but still resilient labor market. The Fed funds rate remains at 3.63%. Mortgage rates eased slightly to 6.59%, yet the sharp drop in new home sales highlights persistent affordability pressures.
Broader data continue to show services activity expanding while goods orders contract sharply on a monthly basis.
Global Macro News
Iran anticipates a $40 billion windfall from reopening Hormuz, potentially easing global energy supply constraints that have weighed on US refiners. A South Korean jet fuel facility is adjusting sourcing away from the Middle East following recent disruptions. Brazil’s new household vulnerability index signals uneven regional financial conditions that could indirectly affect US trade flows.
<i>↓ p.2</i>