US Macro Daily(Beta Mode)
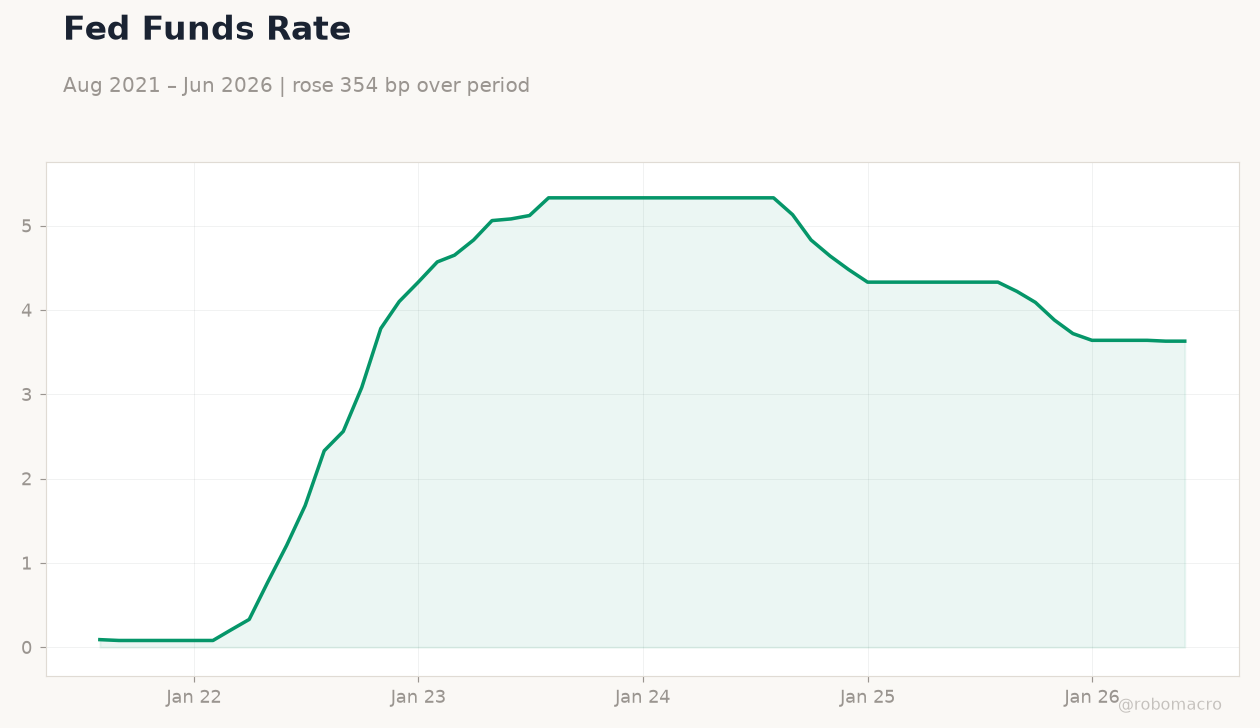
Fed Holds at 3.75% With Three Hawks Dissenting
Market Snapshot
| Asset | Level | Change |
|---|---|---|
| S&P 500 | 7,316.15 | -1.52% |
| Nasdaq 100 | 27,192.31 | -2.06% |
| Dow Jones | 51,594.14 | -2.19% |
| Russell 2000 | 2,906.31 | -1.61% |
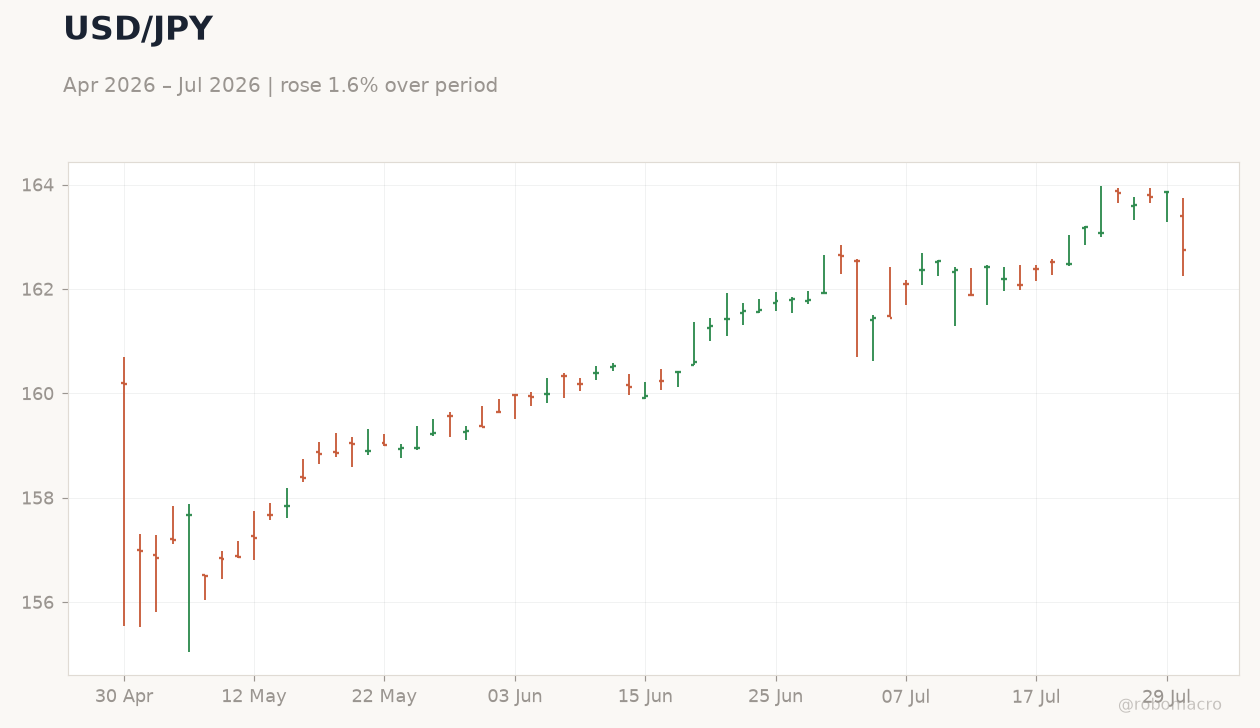
| USD/JPY | 162.82 | -0.64% |
| EUR/USD | 1.15 | +0.81% |
| GBP/USD | 1.34 | +0.83% |
| Gold | 4,138.50 | +2.57% |
| WTI Crude | 83.38 | -1.28% |
| Bitcoin | 64,470.72 | +0.88% |
| US 2Y Treasury | 4.26% | -1.16% |
| US 10Y Treasury | 4.61% | -0.86% |
Prior Economic Events
| Data | Prior | Cons | Actual |
|---|---|---|---|
| Durable Goods Orders Month-over-Month | -4 | 2.50 | 0.30 |
| Durable Goods Orders Ex Transp Month-over-Month | 1.80 | 0.80 | 0.60 |
| Dallas Fed Manufacturing Index | 0 | - | 1.30 |
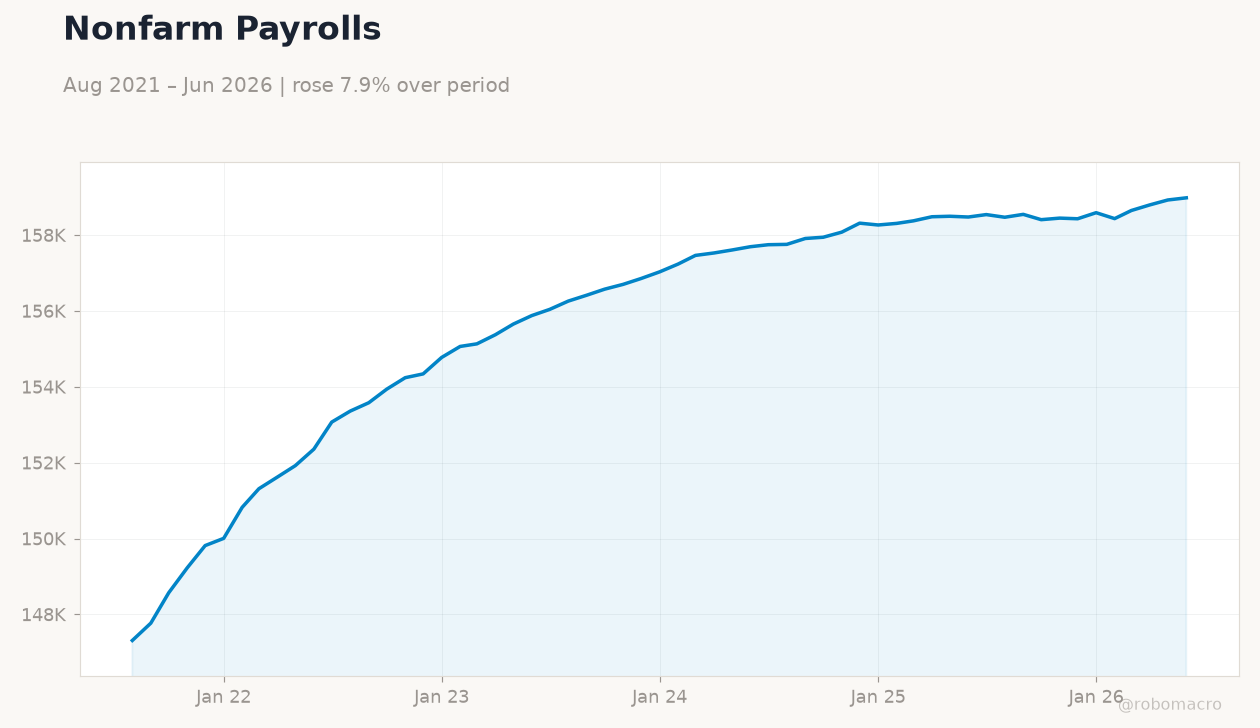
| ADP Employment Change Weekly | 16,250 | - | 15,000 |
| Goods Trade Balance Adv | -105,890m | -100,000m | -101,500m |
| Retail Inventories Ex Autos Month-over-Month Adv | 0.20 | - | -0.20 |
| Wholesale Inventories Month-over-Month Adv | 0.30 | 0.20 | 0.30 |
| S&P/Case-Shiller Home Price Year-over-Year | 1.20 | 1.30 | 1.60 |
| Cb Consumer Confidence | 92.20 | - | 90.80 |
| API Weekly Crude Oil Stocks | 2.6m | -2.5m | 3.3m |
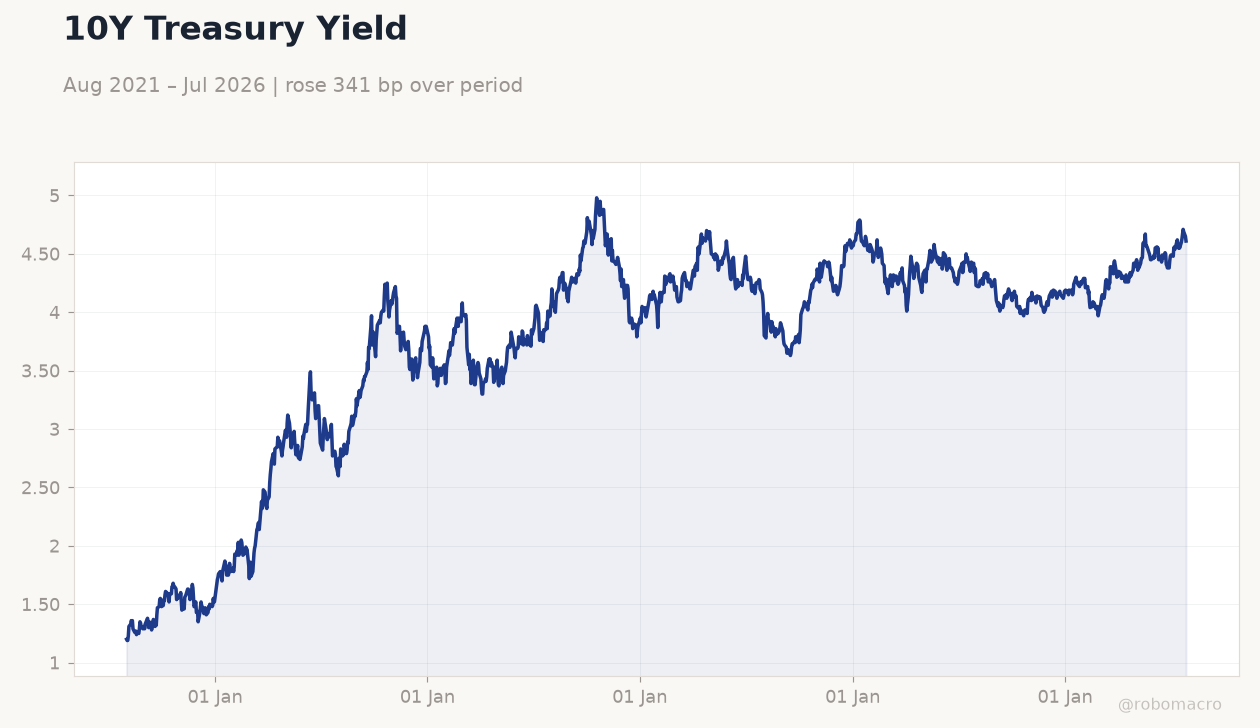 10Y Treasury Yield | Type: macro_line | Percent: 4.61 (2026-07-28) | Range: 1.19–4.98 | Trend(6pt): 1.2,4.02,4.08,4.23,4.65,4.61
Today's Economic Events
| Data | Prior | Cons | Time |
|---|---|---|---|
| Core PCE Price Index Month-over-Month | 0.30 | 0.20 | 04:30 |
| GDP Growth Quarter-over-Quarter Advance Estimate | 2.10 | 2.10 | 04:30 |
| Personal Income Month-over-Month | 0.70 | 0.30 | 04:30 |
| Personal Spending Month-over-Month | 0.70 | 0.30 | 04:30 |
| GDP Price Index Quarter-over-Quarter Adv | 3.60 | - | 04:30 |
| PCE Price Index Month-over-Month | 0.40 | -0.10 | 04:30 |
| PCE Price Index Year-over-Year | 4.10 | 3.70 | 04:30 |
| Weekly Jobless Claims | 187,000 | 200,000 | 04:30 |
- Fed keeps policy rate unchanged at 3.75% as CPI holds at 3.46% YoY
- Equities drop over 2% while gold jumps 2.57% on persistent inflation risks
- Treasury yields ease after mixed inventory and housing data
Yesterday's Recap
The Federal Reserve held the federal funds rate at 3.75% on July 29, with three policymakers dissenting in favor of a hike. Durable goods orders rose 0.3% versus a 2.5% consensus, while core orders increased 0.6%. Case-Shiller home prices accelerated to 1.6% YoY, exceeding expectations.
Consumer confidence fell to 90.8. Markets reacted sharply: the S&P 500 declined 1.52% to 7,316.15, Nasdaq 100 fell 2.06% to 27,192.31, and the Dow dropped 2.19% to 51,594.14. The 10-year Treasury yield eased 0.86% to 4.61% while gold advanced 2.57% to $4,138.50.
Crude inventories surprised with a 7.167 million barrel draw, supporting WTI near $83.38. Mortgage rates climbed to 6.76%. ADP employment change printed 15,000 and wholesale inventories rose 0.3%, matching consensus.
The Day Ahead
Attention shifts to upcoming labor market indicators and inflation prints that will shape the September FOMC outlook. Traders will monitor weekly jobless claims and any revisions to prior ADP employment figures. Treasury auctions and further housing data releases could influence yield curves already reacting to the Fed’s hold.
Oil market volatility from Middle East developments may affect energy prices and CPI components. Equity positioning remains cautious ahead of corporate earnings that could highlight spending on AI infrastructure. Retail sales data at 6.72% YoY and GDP growth readings of 2.10% QoQ will provide further context on consumer resilience.
Other Economic Notes
Persistent inflation at 3.46% YoY continues to anchor policy expectations even as growth indicators show modest softening. Inventory draws in crude and gasoline point to tighter energy balances that could feed into future price pressures. Housing price gains accelerated to 1.6% YoY despite higher mortgage rates, suggesting supply constraints remain acute.
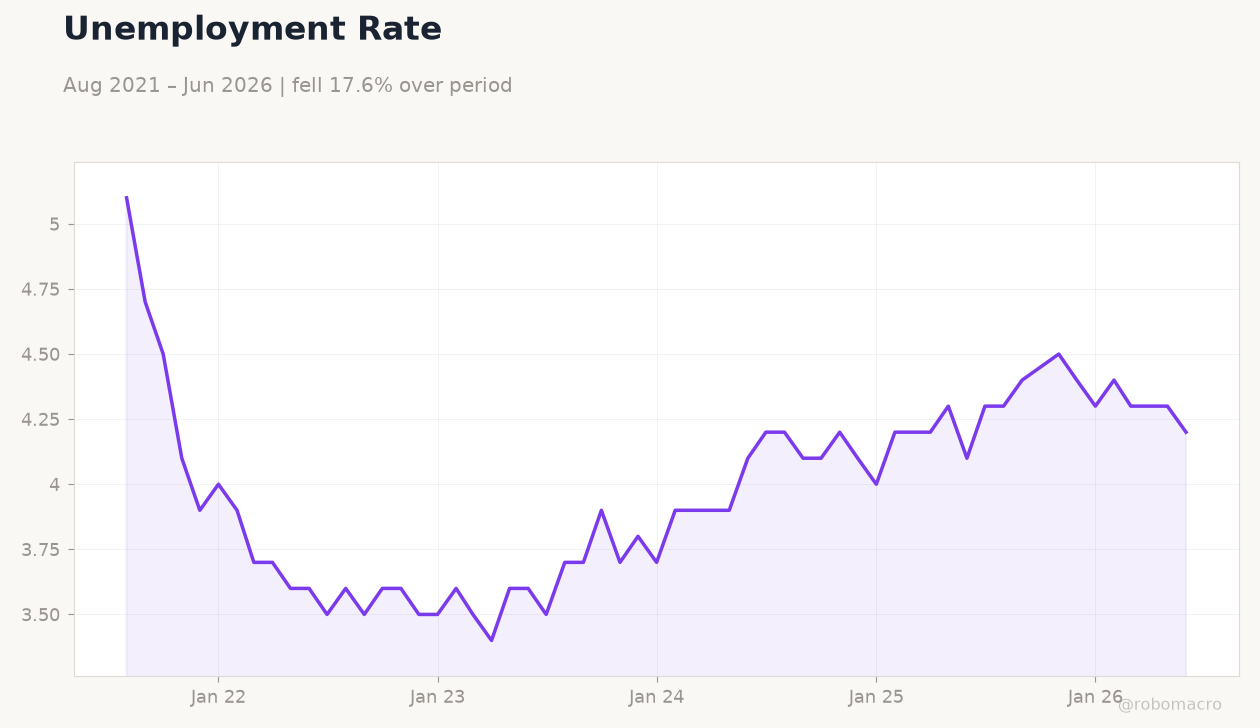
Broader credit markets show limited stress so far, but rising dissent within the FOMC signals growing debate over the balance between inflation risks and growth moderation. Unemployment at 4.20% and retail sales strength at 6.72% YoY underscore a labor market that has cooled only gradually.