US Macro Daily(Beta Mode)
Housing Starts Slump as Fed Minutes Turn Hawkish
Market Snapshot
| Asset | Level | Change |
|---|---|---|
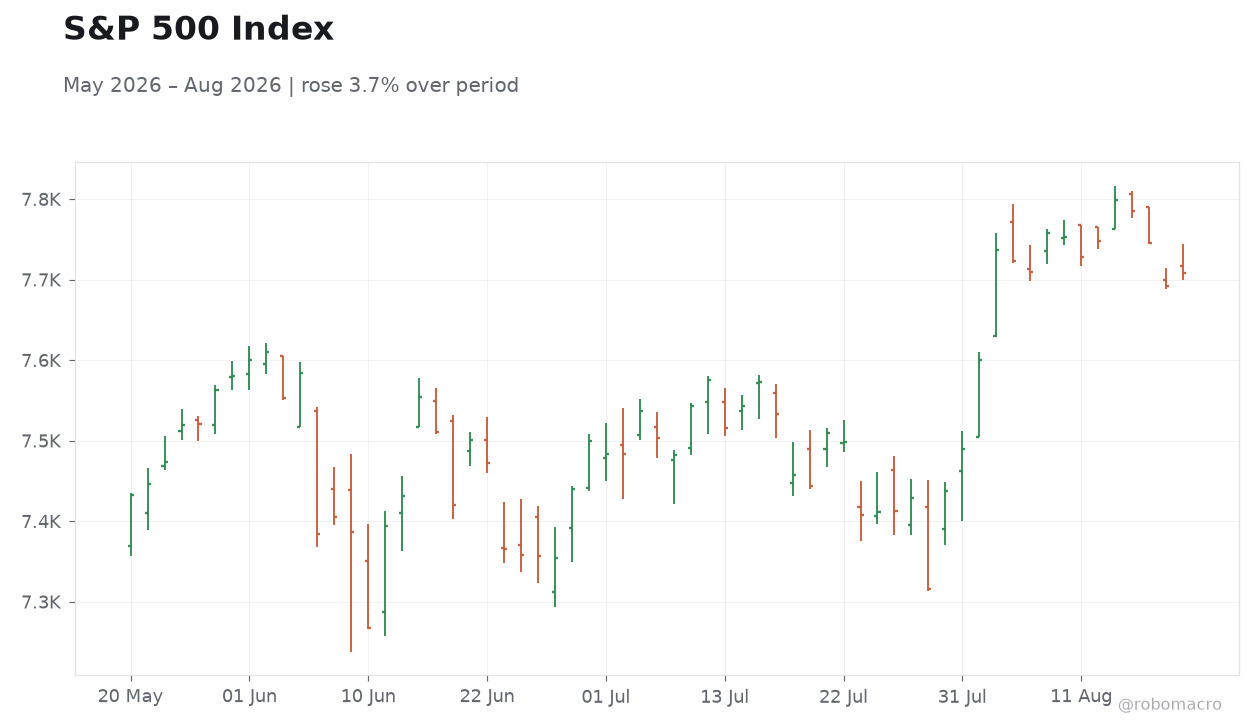
| S&P 500 | 7,707.98 | +0.21% |
| Nasdaq 100 | 29,426.02 | -0.22% |
| Dow Jones | 53,463.05 | +0.22% |
| Russell 2000 | 3,032.94 | +0.50% |
| USD/JPY | 158.50 | -0.66% |
| EUR/USD | 1.17 | +1.04% |
| GBP/USD | 1.36 | +0.79% |
| Gold | 4,546.50 | +1.27% |
| WTI Crude | 86.71 | +1.03% |
| Bitcoin | 71,920.00 | +3.83% |
| US 2Y Treasury | 4.19% | +0.00% |
| US 10Y Treasury | 4.71% | -0.21% |
Prior Economic Events
| Data | Prior | Cons | Actual |
|---|---|---|---|
| NY Empire State Manufacturing Index | 15.60 | 11 | 20.60 |
| NAHB Housing Market Index | 34 | 33 | 35 |
| Net Long-Term TIC Flows Level | 231,200m | 151,400m | 172,700m |
| ADP Employment Change Weekly | 8,250 | - | 9,500 |
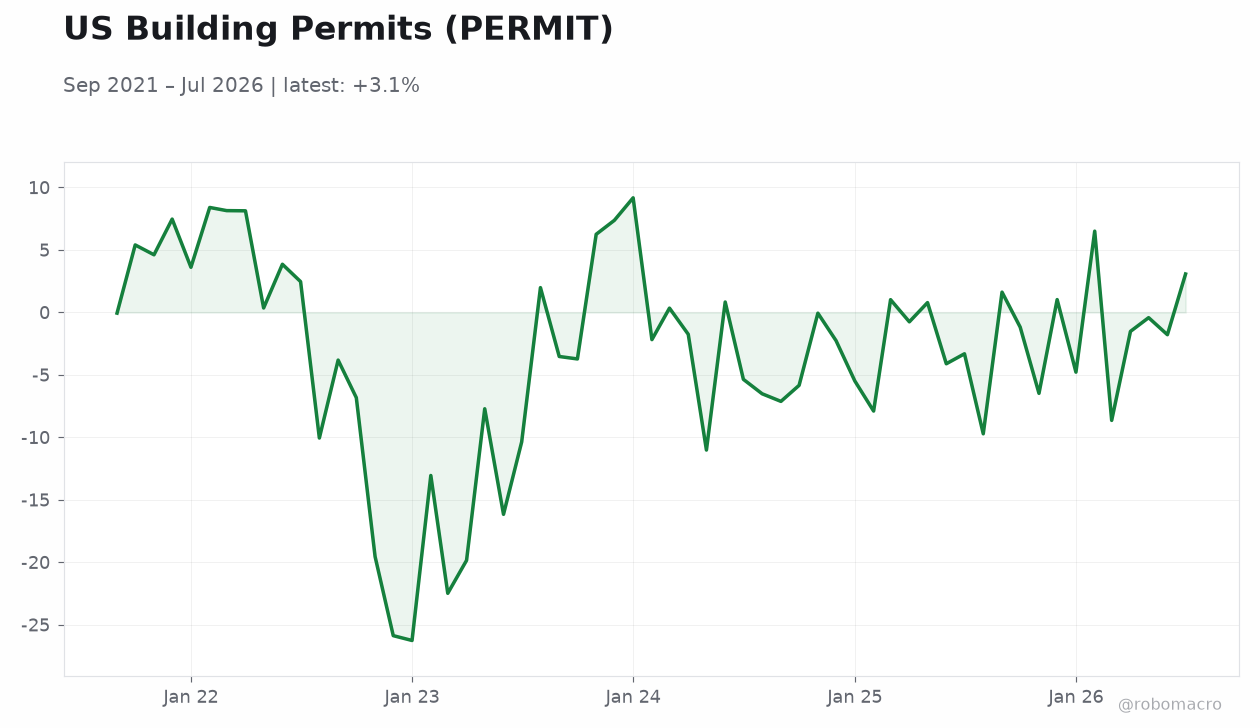
| Building Permits Preliminary | 1.4m | 1.4m | 1.4m |
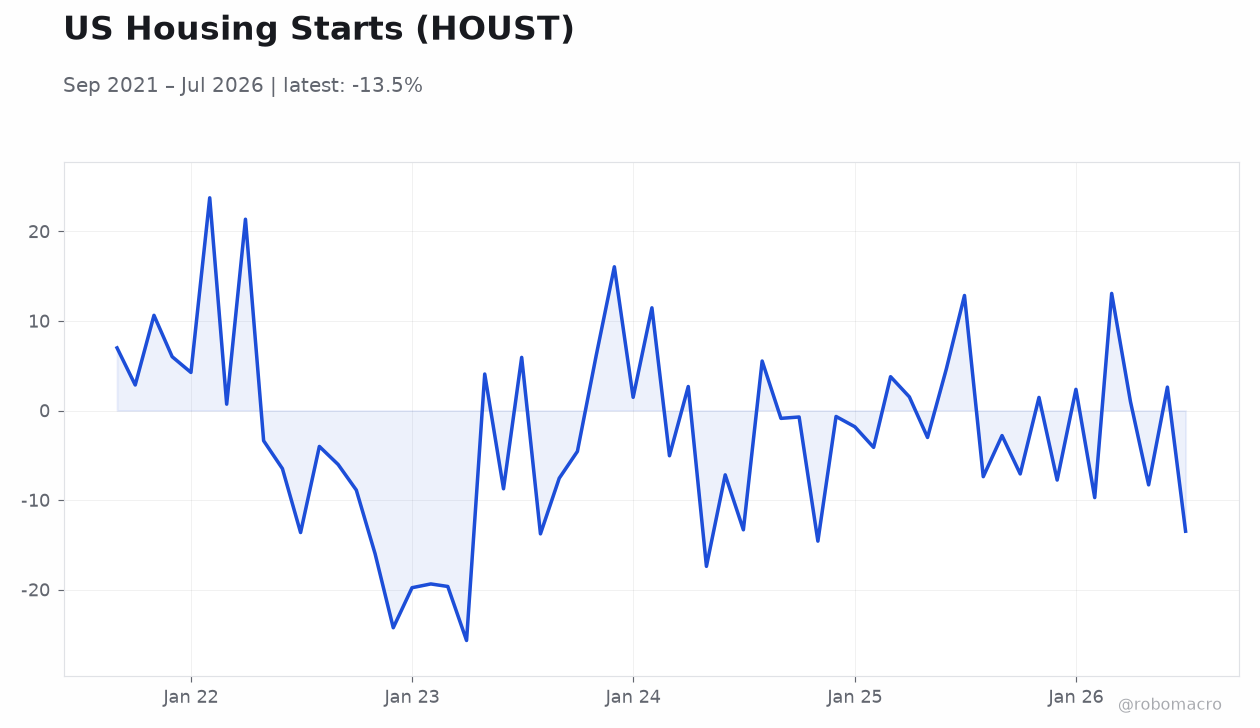
| Housing Starts Level | 1.4m | 1.4m | 1.2m |
| Building Permits Month-over-Month Preliminary | -2.60 | - | 5 |
| Export Prices Month-over-Month | -0.70 | 0.20 | -1.30 |
| Housing Starts Month-over-Month | 19.70 | - | -12.40 |
| Import Prices Month-over-Month | -0.30 | 0.10 | -0.40 |
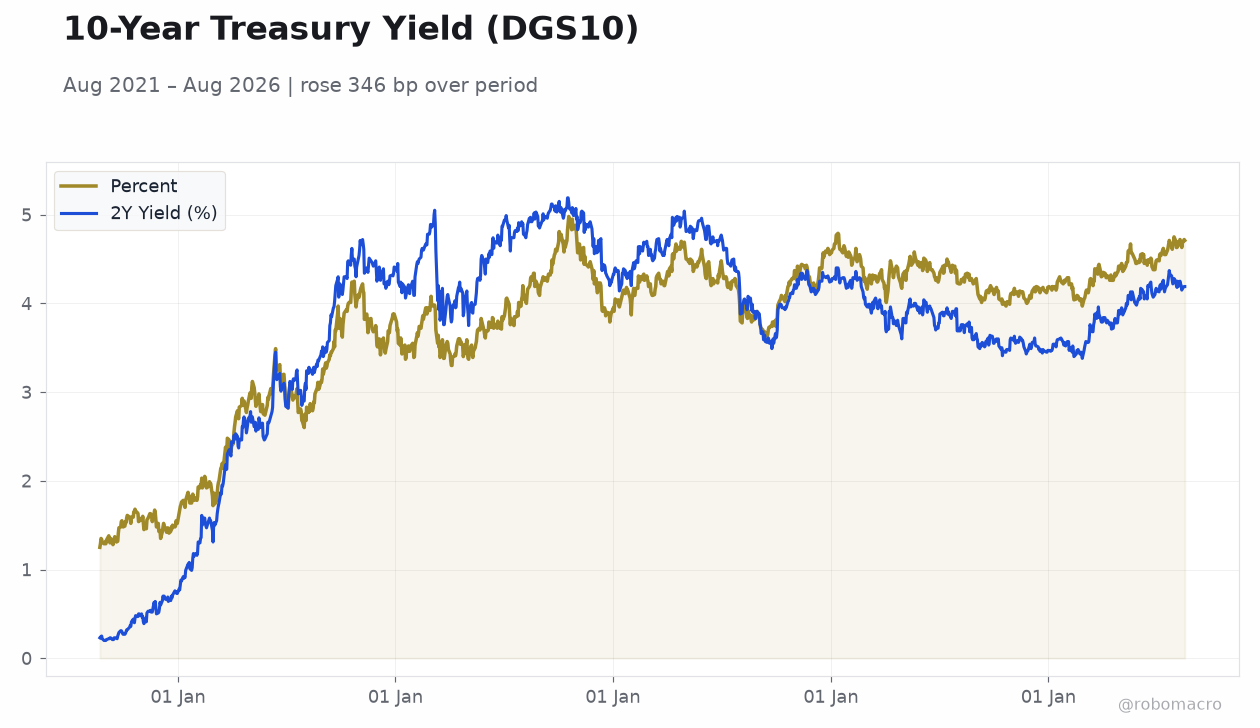 10-Year Treasury Yield (DGS10) | Type: macro_line | Percent: 4.71 (2026-08-18) | Range: 1.25–4.98 | Trend(6pt): 1.25,3.83,4.27,4.46,4.72,4.71 | 2Y Yield (%): 4.19 (2026-08-18) | Range: 0.2–5.19 | Trend(5pt): 0.23,4.48,4.59,3.97,4.19
Today's Economic Events
| Data | Prior | Cons | Time |
|---|---|---|---|
| Philadelphia Fed Manufacturing Index | 41.40 | 25 | 04:30 |
| Weekly Jobless Claims | 209,000 | 210,000 | 04:30 |
| Friday (2026-08-21) | |||
| S&P Global Composite PMI Flash | 54.50 | - | 05:45 |
| S&P Global Manufacturing PMI Flash | 53.90 | 53.90 | 05:45 |
| S&P Global Services PMI Flash | 54.60 | 54 | 05:45 |
- US housing starts fell 12.4% m/m to 1.239 million in July, missing consensus, while building permits rose to 1.443 million.
- Equity indices closed mixed with S&P 500 up 0.21% at 7,707.98 as 10-year Treasury yields declined 21 basis points to 4.71%.
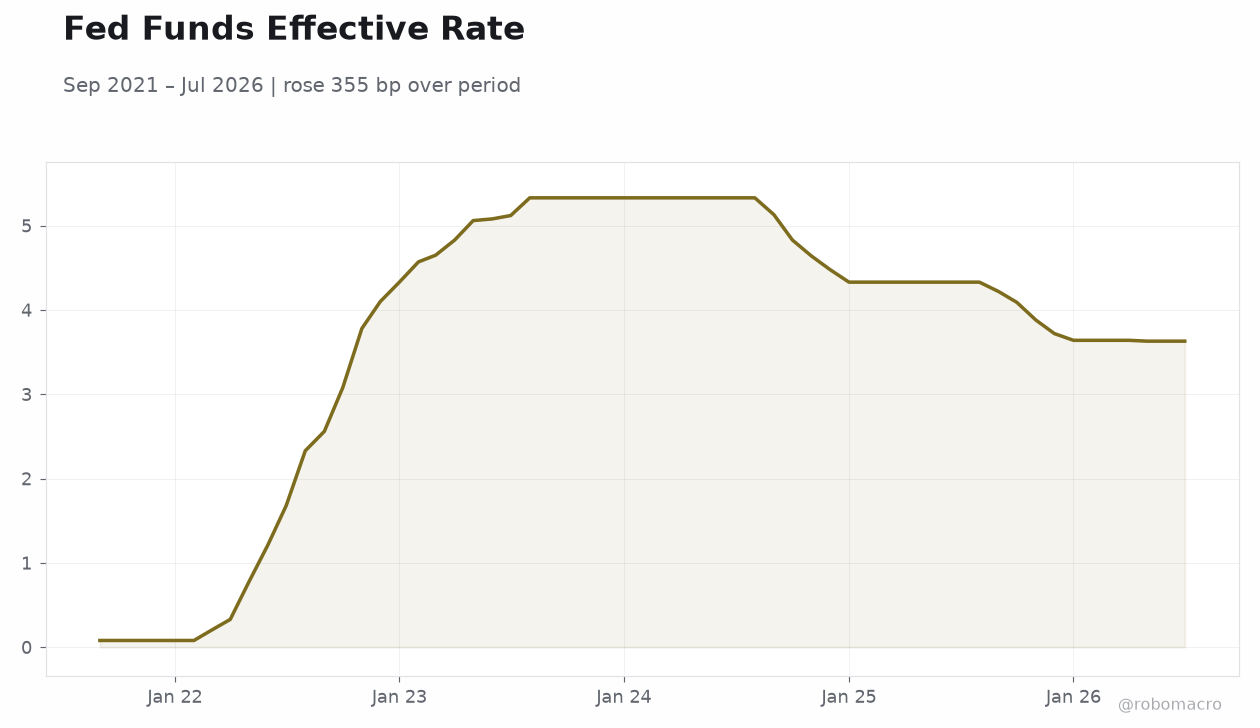
- Federal Reserve July minutes signaled growing hawkishness, with officials noting a possible need for higher rates later this year.
Yesterday's Recap
US housing data released on August 18 showed starts dropping sharply to 1.239 million from 1.415 million prior, well below the 1.35 million consensus, while permits climbed to 1.443 million against 1.37 million expected. Industrial production rose only 0.2% month-over-month versus 0.3% forecast. Pending home sales declined 2.3% against a 0.3% consensus gain.
Markets reacted with the S&P 500 advancing 0.21% to 7,707.98 and the Nasdaq 100 slipping 0.22%, while the 10-year Treasury yield fell 21 basis points to 4.71%. Gold climbed 1.27% to 4,546.50 and WTI crude gained 1.03% to 86.71 as the dollar weakened against major crosses. ADP employment figures printed at 9,500, and export prices fell 1.3% month-over-month.
The mixed housing print and softer production data capped broader risk appetite ahead of the Fed minutes release. US GDP grew 1.50% annualized in the first quarter and 2.10% year-over-year, while retail sales expanded 5.01% year-over-year through July. The unemployment rate stands at 4.10% and CPI at 3.30% year-over-year.
The Day Ahead
Markets will monitor weekly jobless claims and any follow-up housing or manufacturing indicators due later this week. Treasury buyback operations in longer-dated securities are expected to continue supporting duration after the recent yield decline. No FOMC speakers are scheduled, leaving the July minutes as the dominant policy signal.
Equity futures point to a cautious open as investors digest the hawkish tone in the released minutes. Oil and gold will track USD/JPY moves near 158.50 and any fresh Chinese data that could influence commodity flows. Focus remains on whether the softer housing numbers alter the balance of risks for the September FOMC meeting.
The 2-year Treasury yield held at 4.19%, reflecting limited conviction in near-term easing.
Other Economic Notes
US GDP grew 1.50% annualized in the first quarter and 2.10% year-over-year, while retail sales expanded 5.01% year-over-year through July. The unemployment rate stands at 4.10% and CPI at 3.30% year-over-year, consistent with a gradual cooling but still above the Fed’s target. <i>↓ p.2</i>