Greater China Macro Daily(Beta Mode)
China Q2 GDP Misses at 4.3% as Exports Surge
Market Snapshot
| Asset | Level | Change |
|---|---|---|
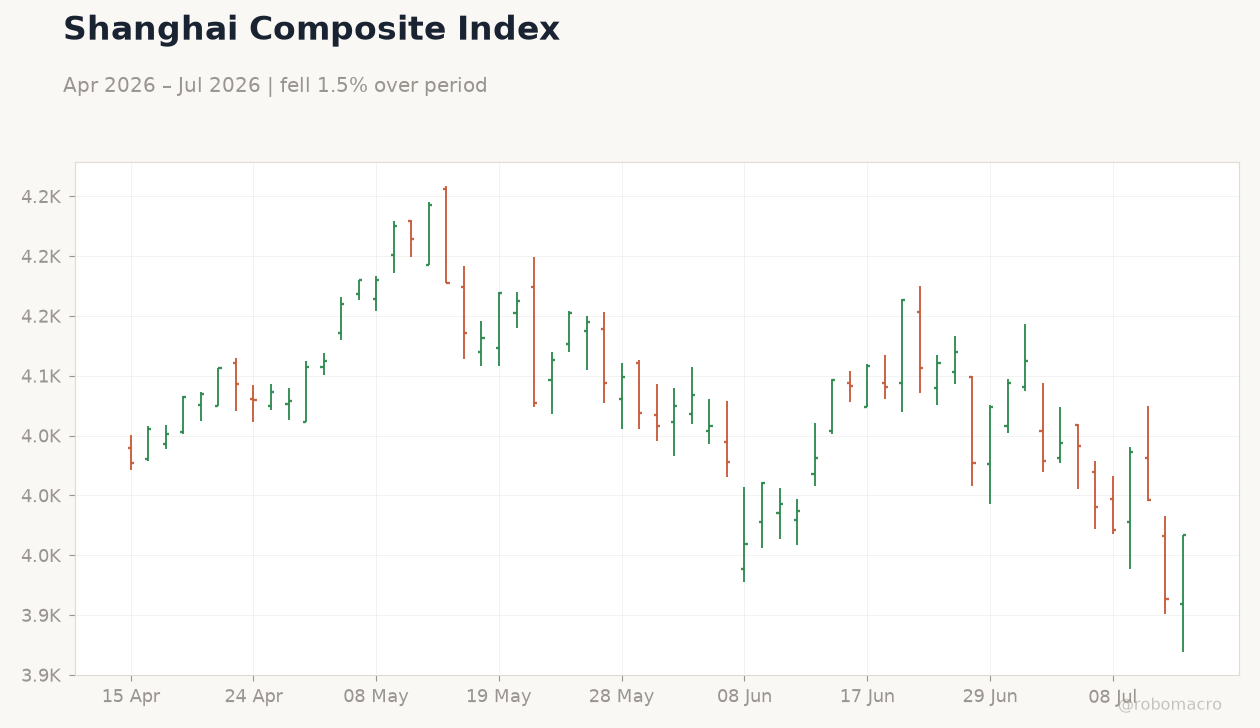
| Shanghai Composite | 3,955.58 | -0.29% |
| CSI 300 | 4,786.78 | -0.20% |
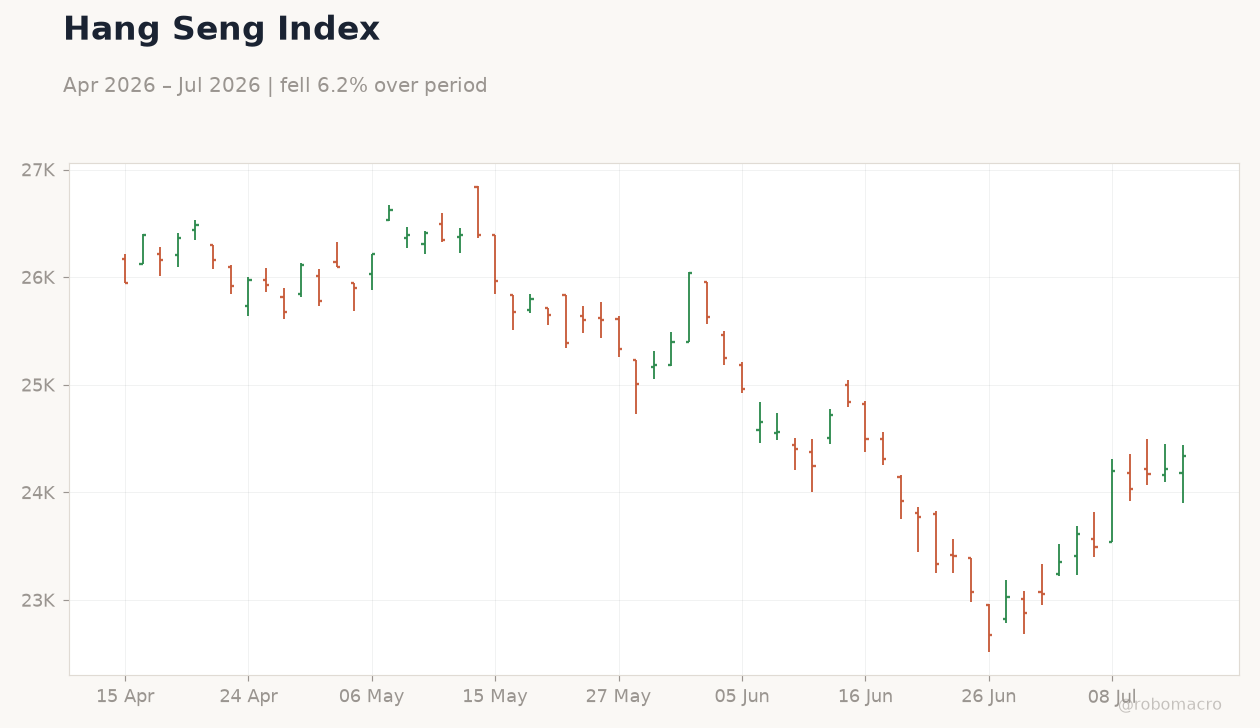
| Hang Seng | 24,340.73 | +0.52% |
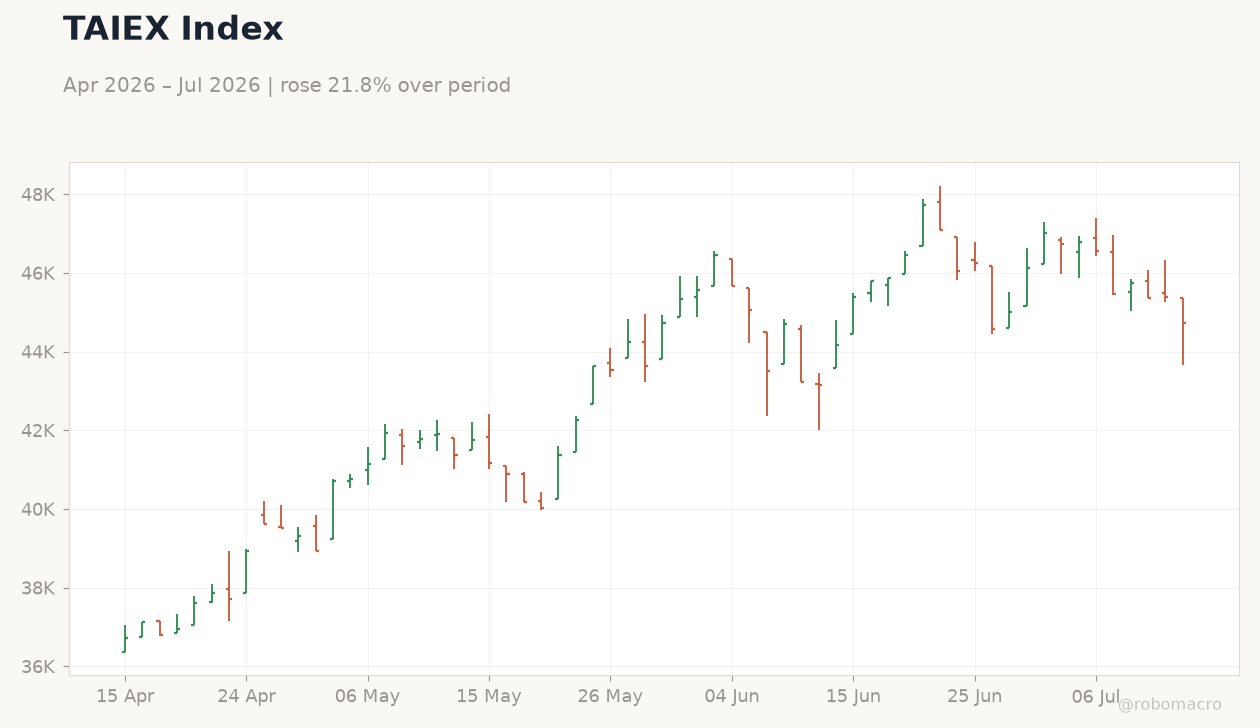
| TAIEX | 44,737.95 | -1.42% |
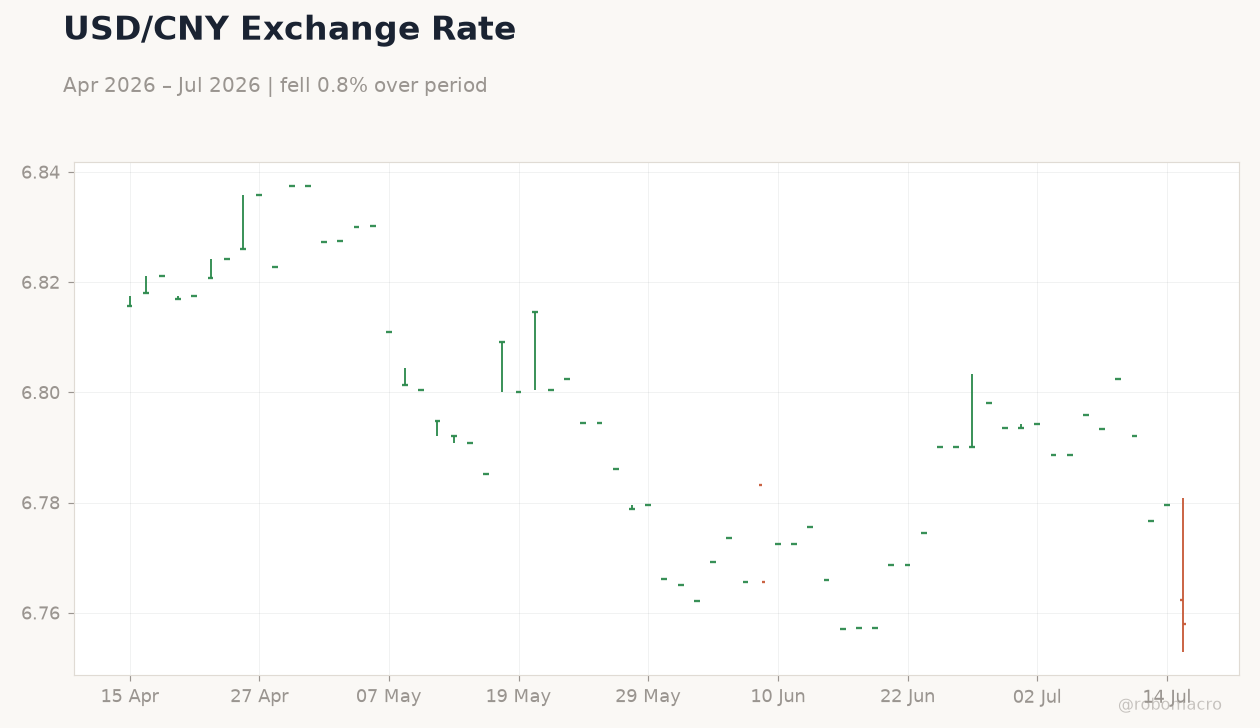
| USD/CNY | 6.76 | -0.32% |
| USD/HKD | 7.84 | +0.00% |
| Copper | 6.38 | +0.84% |
| Brent Crude | 85.63 | +1.06% |
| Gold | 4,066.90 | +0.14% |
| Bitcoin | 64,752.00 | -0.31% |
| China 2Y Govt Yield | - | - |
| China 10Y Govt Yield | - | - |
Prior Economic Events
| Data | Prior | Cons | Actual |
|---|---|---|---|
| Trade Balance | 105,430m | 121,000m | 125,800m |
| Exports Year-over-Year | 19.40 | 18.20 | 27 |
| Imports Year-over-Year | 27.40 | 24 | 36 |
| House Price Index Year-over-Year | -3.50 | - | -3.30 |
| GDP Growth Year-over-Year | 5 | 4.50 | 4.30 |
| Industrial Production Year-over-Year | 4.50 | 4.60 | 5.30 |
| Retail Sales Year-over-Year | -0.60 | -0.10 | 1 |
| Fixed Asset Investment (YTD) Year-over-Year | -4.10 | -4.90 | -5.70 |
| GDP Growth Quarter-over-Quarter | 1.30 | 0.90 | 0.90 |
| New Yuan Loans | 520,000m | 2,000,000m | 1,610,000m |
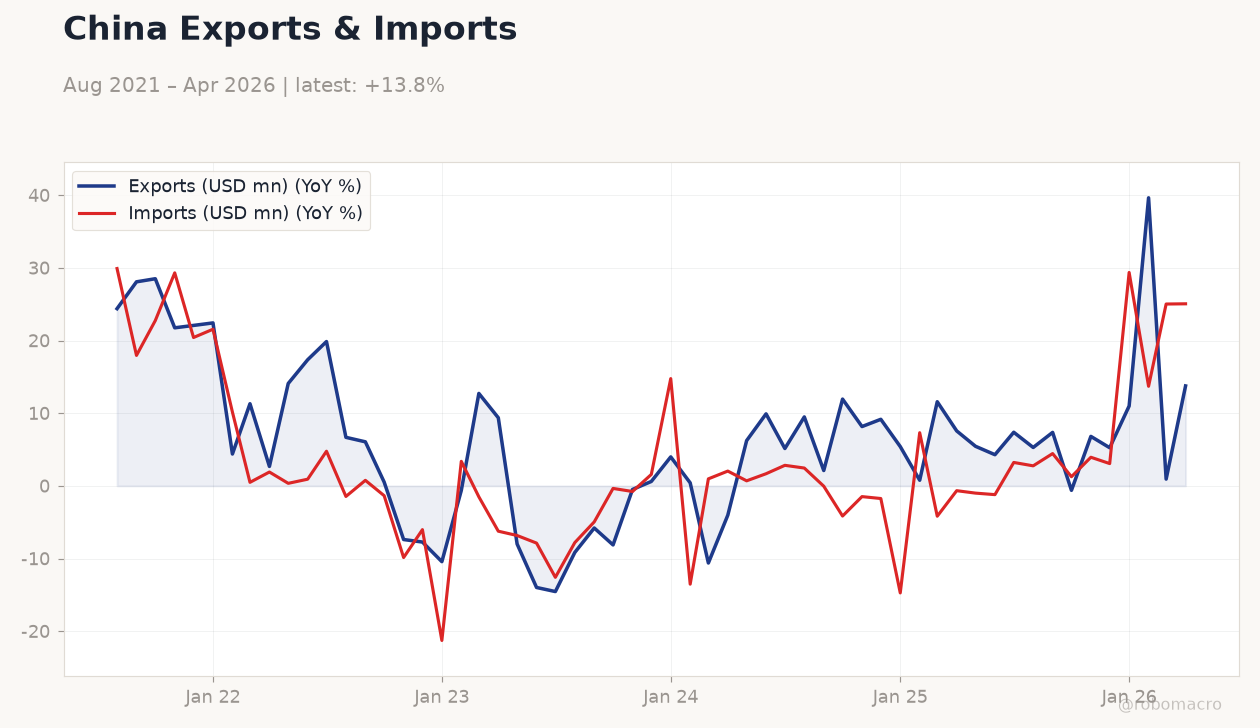 China Exports & Imports | Type: macro_line | Exports (USD mn): 13.75 (2026-04-01) | Range: -14.55–39.64 | Trend(5pt): 24.38,0.5134,0.6066,0.7746,13.75 | Imports (USD mn): 25.05 (2026-04-01) | Range: -21.28–29.91 | Trend(5pt): 29.91,-1.354,1.57,7.315,25.05
Today's Economic Events
| Data | Prior | Cons | Time |
|---|---|---|---|
| Loan Prime Rate 1Y | 3 | - | 21:15 |
| Loan Prime Rate 5Y | 3.50 | - | 21:15 |
- China Q2 GDP grew 4.3% YoY, below 4.5% consensus, while industrial production beat at 5.3%.
- Exports jumped 27% YoY and imports 36%, lifting trade balance to $125.8bn.
- Shanghai Composite fell 0.29% and TAIEX dropped 1.42%, but Hang Seng rose 0.52%.
Yesterday's Recap
China’s second-quarter GDP expanded 4.3% year-over-year, missing the 4.5% consensus and marking the weakest pace since 2022. Industrial production rose 5.3% YoY, exceeding expectations, while retail sales turned positive at 1% YoY. Fixed-asset investment contracted 5.7% YTD and new yuan loans reached 1.61 trillion.
Exports surged 27% YoY and imports climbed 36%, pushing the trade surplus to $125.8 billion. The Shanghai Composite closed down 0.29% at 3,955.58 and CSI 300 slipped 0.20%, whereas the Hang Seng gained 0.52% to 24,340.73 and TAIEX fell 1.42%. USD/CNY eased 0.32% to 6.76 amid steady PBOC fixing.
House prices declined 3.3% YoY, extending the property-sector downturn. QoQ GDP growth printed 0.9%, in line with forecasts. Copper prices advanced 0.84% on modest demand optimism while Brent crude rose 1.06% to 85.63.
The Day Ahead
Markets await the July 19 Loan Prime Rate decisions, with the one-year and five-year benchmarks expected to remain unchanged at 3% and 3.5%. No major data releases are scheduled for mainland China, Hong Kong or Taiwan over the next two sessions. Analysts will monitor PBOC liquidity operations and any State Council guidance on targeted support measures.
Hong Kong’s aggregate balance and USD/HKD peg stability will stay in focus given limited local data. Taiwan’s semiconductor export trends may draw attention ahead of monthly trade figures. Property financing quotas and local-government bond issuance remain key variables for sentiment.
Other Economic Notes
Weak domestic demand continues to weigh on mainland growth despite resilient external trade, keeping pressure on policymakers for further targeted easing. Property prices declined 3.3% YoY, underscoring persistent sector weakness that may require additional financing support. Strong export momentum, particularly in semiconductors and AI-related goods, provides a buffer but cannot fully offset sluggish consumption and investment.
Cross-strait trade flows remain stable, with no fresh regulatory actions reported. Copper prices rose 0.84%, reflecting modest optimism on China demand recovery. Fixed-asset investment contraction deepened to 5.7% YTD, highlighting the need for accelerated project approvals.