US Macro Daily(Beta Mode)
Fed Holds Rates, Nasdaq Jumps 3.4%
Market Snapshot
| Asset | Level | Change |
|---|---|---|
| S&P 500 | 7,437.63 | +1.66% |
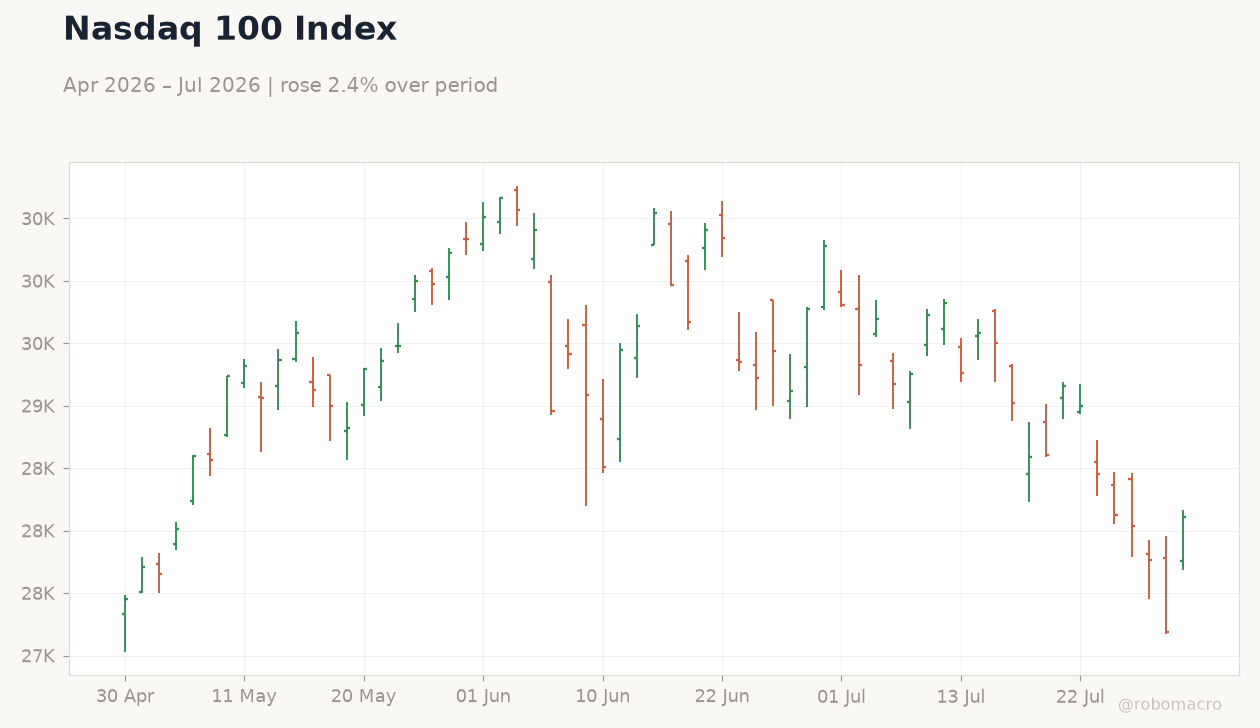
| Nasdaq 100 | 28,106.35 | +3.36% |
| Dow Jones | 52,208.06 | +1.19% |
| Russell 2000 | 2,946.10 | +1.37% |
| USD/JPY | 160.00 | -2.02% |
| EUR/USD | 1.15 | +0.33% |
| GBP/USD | 1.34 | +0.57% |
| Gold | 4,111.70 | +0.28% |
| WTI Crude | 84.20 | +0.73% |
| Bitcoin | 63,864.19 | -1.33% |
| US 2Y Treasury | 4.22% | -0.94% |
| US 10Y Treasury | 4.67% | +1.30% |
Prior Economic Events
| Data | Prior | Cons | Actual |
|---|---|---|---|
| Durable Goods Orders Month-over-Month | -4 | 2.50 | 0.30 |
| Durable Goods Orders Ex Transp Month-over-Month | 1.80 | 0.80 | 0.60 |
| Dallas Fed Manufacturing Index | 0 | - | 1.30 |
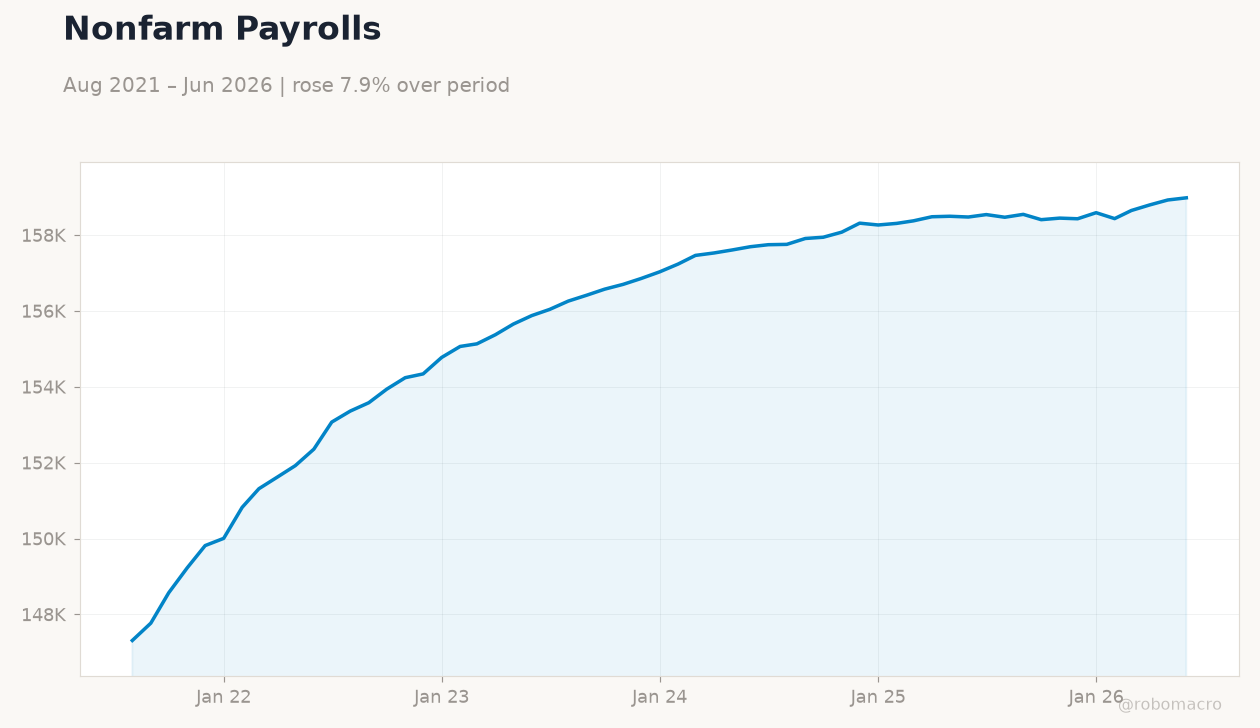
| ADP Employment Change Weekly | 16,250 | - | 15,000 |
| Goods Trade Balance Adv | -105,890m | -100,000m | -101,500m |
| Retail Inventories Ex Autos Month-over-Month Adv | 0.20 | - | -0.20 |
| Wholesale Inventories Month-over-Month Adv | 0.30 | 0.20 | 0.30 |
| S&P/Case-Shiller Home Price Year-over-Year | 1.20 | 1.30 | 1.60 |
| Cb Consumer Confidence | 92.20 | - | 90.80 |
| API Weekly Crude Oil Stocks | 2.6m | -2.5m | 3.3m |
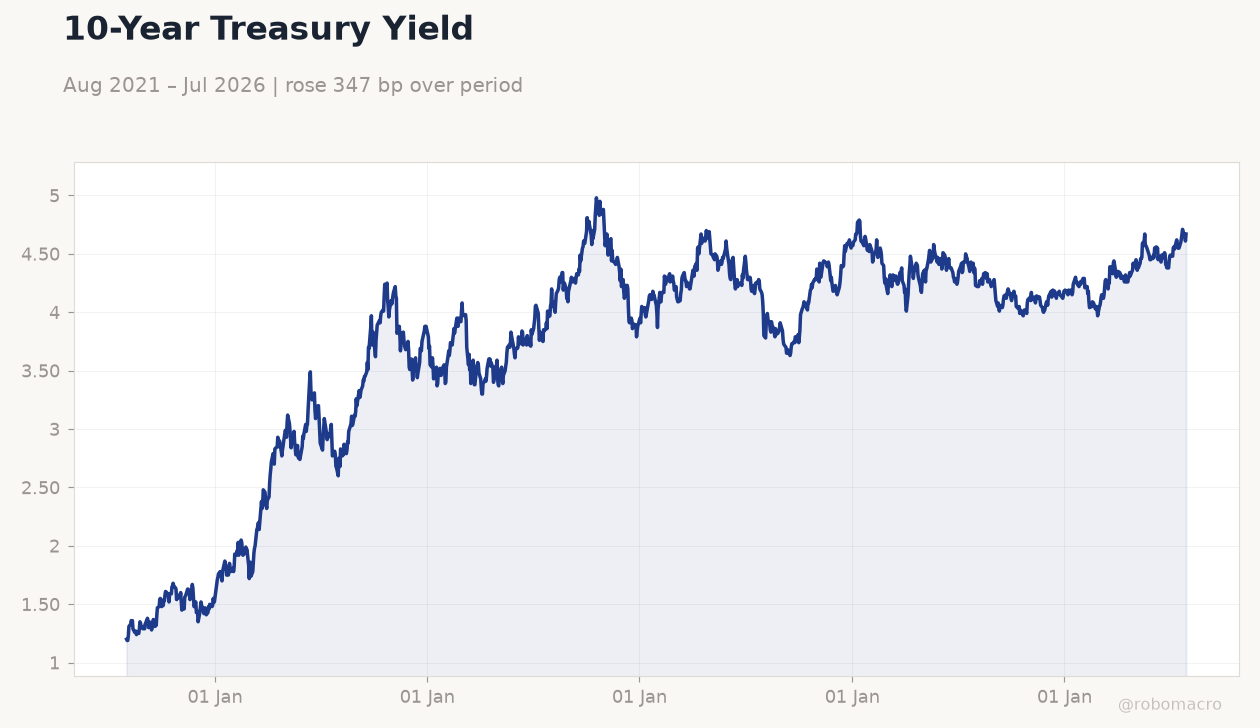 10-Year Treasury Yield | Type: macro_line | Percent: 4.67 (2026-07-29) | Range: 1.19–4.98 | Trend(6pt): 1.2,4.02,4.08,4.23,4.65,4.67
Today's Economic Events
| Data | Prior | Cons | Time |
|---|---|---|---|
| Employment Cost - Benefits Quarter-over-Quarter | 1.20 | - | 04:30 |
| Employment Cost - Wages Quarter-over-Quarter | 0.80 | - | 04:30 |
| Employment Cost Index Quarter-over-Quarter | 0.90 | 0.80 | 04:30 |
| Chicago PMI | 56.70 | 56 | 05:45 |
| Michigan Consumer Sentiment Final | 49.50 | 54 | 06:00 |
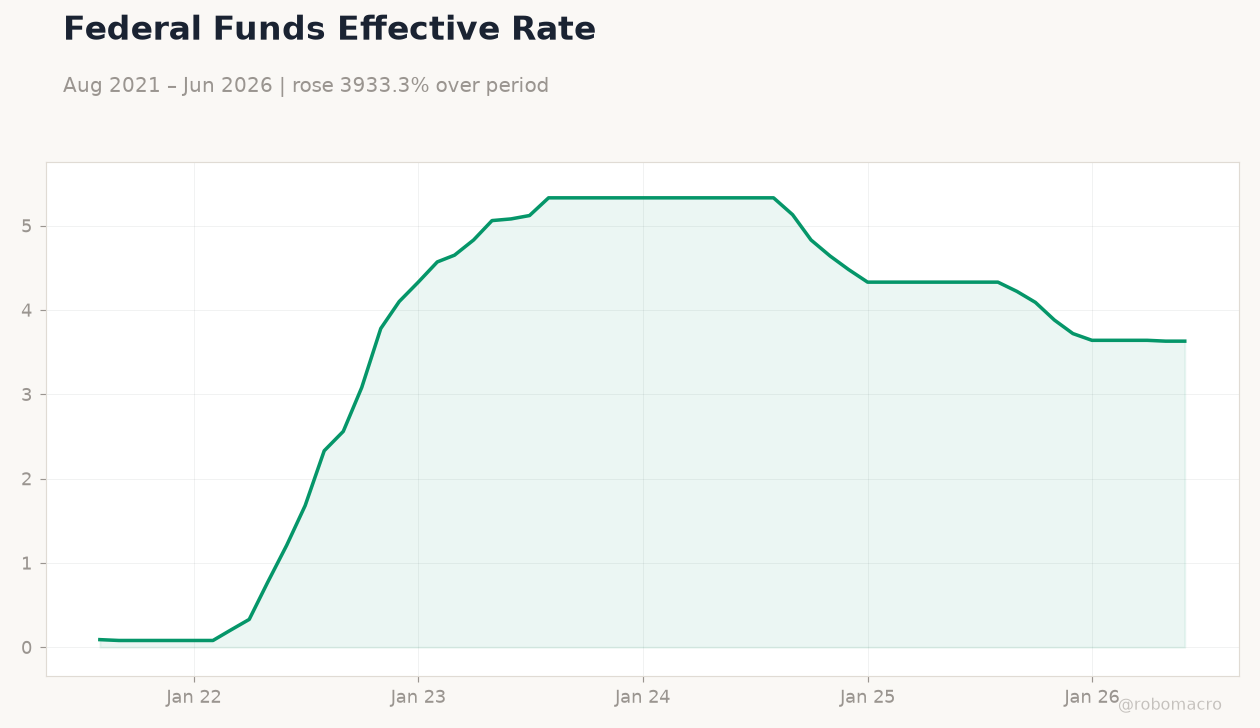
- Fed keeps policy rate unchanged at 3.63% with committee citing balanced risks
- Equities rally led by Nasdaq 100 gain of 3.36% while 10Y yield rises to 4.67%
- Durable goods orders miss at 0.3% versus 2.5% consensus; oil inventories draw sharply
Yesterday's Recap
US data showed mixed momentum with durable goods orders rising just 0.3% month-over-month against a 2.5% consensus while the ex-transport component printed 0.6% versus 0.8% expected. The Dallas Fed Manufacturing Index edged up to 1.3. ADP employment change came in at 15,000 and the goods trade balance narrowed to -101.5 billion.
S&P Case-Shiller home prices accelerated to 1.6% year-over-year and consumer confidence slipped to 90.8. EIA crude inventories posted a large 7.167 million barrel draw. The Federal Reserve held the policy rate at 3.63% and equities responded positively with the S&P 500 advancing 1.66% to 7,437.63, the Nasdaq 100 jumping 3.36% to 28,106.35, and the 10-year Treasury yield climbing to 4.67%.
Broader market moves included the Russell 2000 rising 1.37% and WTI crude adding 0.73% to 84.20 amid the inventory surprise. USD/JPY fell 2.02% to 160.00 while gold edged higher to 4,111.70.
The Day Ahead
Attention turns to next week’s employment report and inflation prints that will shape expectations for any September move. Treasury auctions and weekly jobless claims will provide incremental labor-market color. Oil market participants will monitor further inventory updates and geopolitical developments in the Middle East.
Equity futures point to continued focus on technology earnings momentum after yesterday’s broad gains. Currency markets remain sensitive to any fresh signals on the dollar’s path given the 2% drop in USD/JPY. Mortgage rates rose to 6.76% and may influence housing data due later in the period.
Other Economic Notes
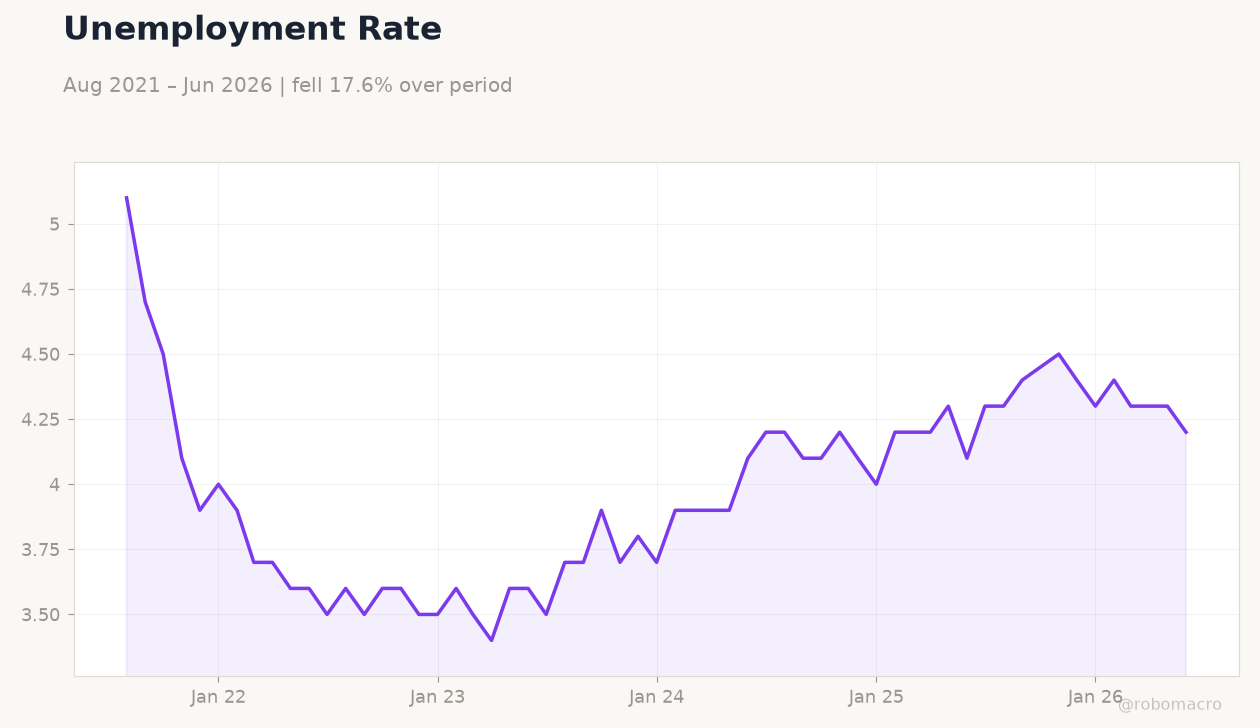
Second-quarter GDP growth registered a sluggish 1.50% annualized rate while the year-over-year pace held at 2.10%. Retail sales expanded 6.72% year-over-year, supporting consumer resilience even as headline CPI sits at 3.46%. The unemployment rate remains anchored at 4.20%, keeping labor-market concerns contained for now.
These readings reinforce a soft-landing narrative yet leave room for policy caution given persistent inflation above target. Wholesale inventories rose 0.3% while retail inventories ex-autos fell 0.2%, pointing to modest inventory adjustment ahead of potential demand shifts.