US Macro Daily(Beta Mode)
Empire State Beats as Housing Data Awaited
Market Snapshot
| Asset | Level | Change |
|---|---|---|
| S&P 500 | 7,785.76 | -0.17% |
| Nasdaq 100 | 30,046.14 | -0.13% |
| Dow Jones | 53,732.41 | -0.20% |
| Russell 2000 | 3,068.42 | +0.51% |
| USD/JPY | 159.71 | +0.30% |
| EUR/USD | 1.16 | +0.05% |
| GBP/USD | 1.35 | -0.15% |
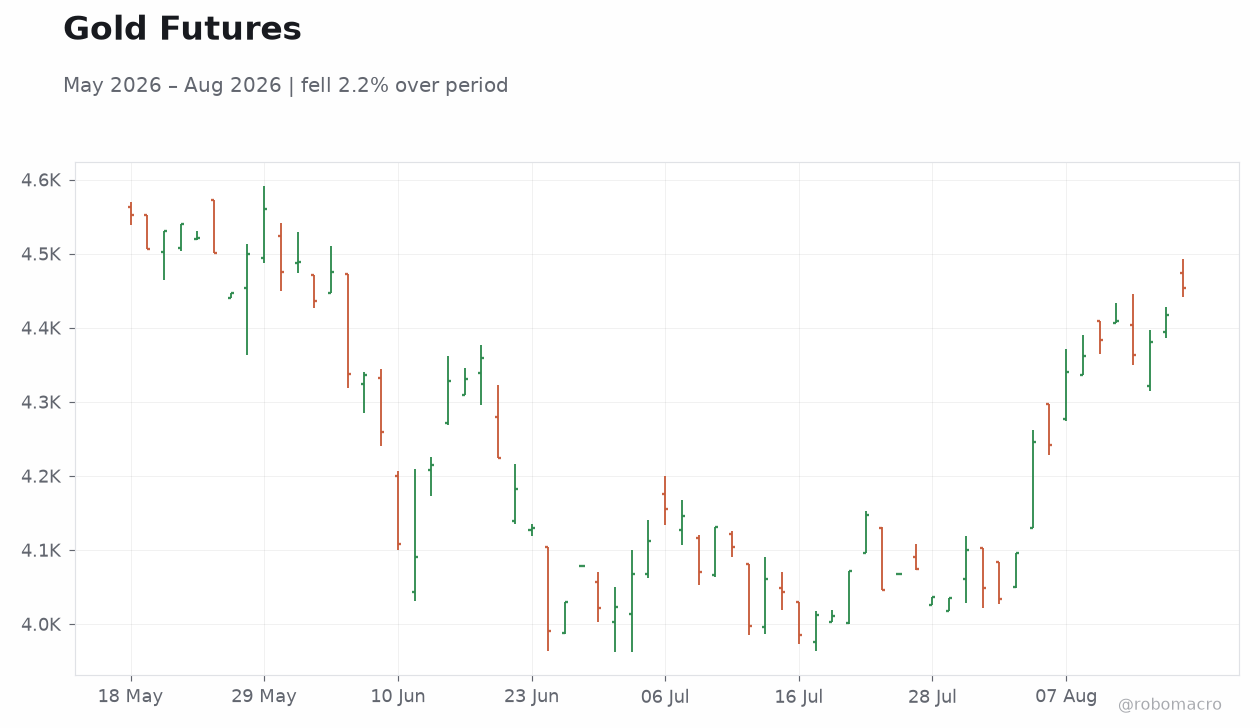
| Gold | 4,455.80 | +0.86% |
| WTI Crude | 83.93 | -0.67% |
| Bitcoin | 64,130.63 | -0.58% |
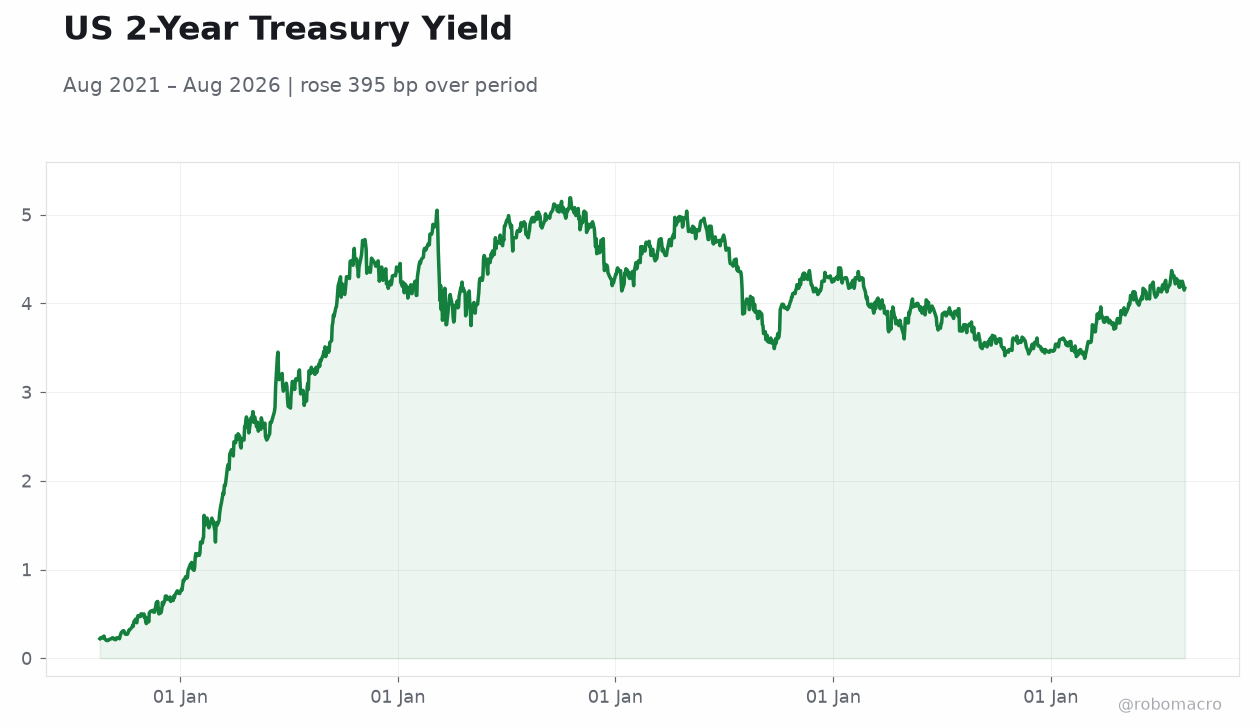
| US 2Y Treasury | 4.17% | +0.48% |
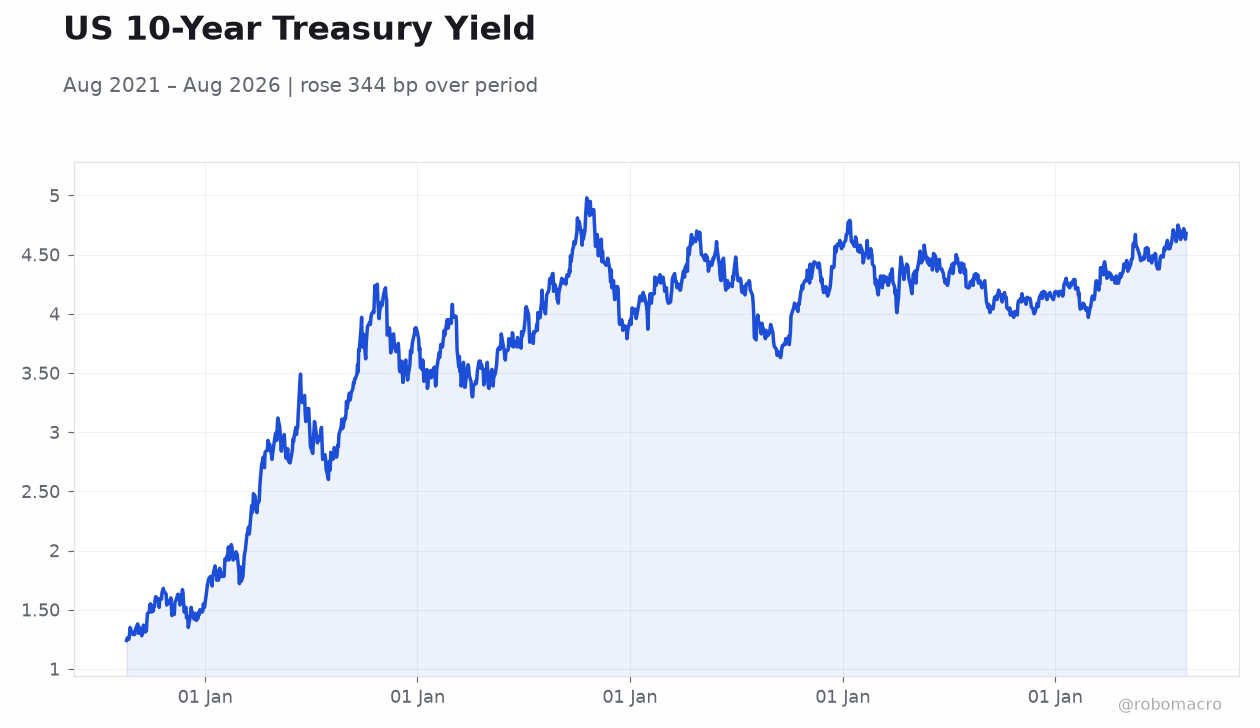
| US 10Y Treasury | 4.68% | +1.08% |
Prior Economic Events
| Data | Prior | Cons | Actual |
|---|---|---|---|
| NY Empire State Manufacturing Index | 15.60 | 11 | 20.60 |
| NAHB Housing Market Index | 34 | 33 | 35 |
| Net Long-Term TIC Flows Level | 231,200m | 151,400m | 172,700m |
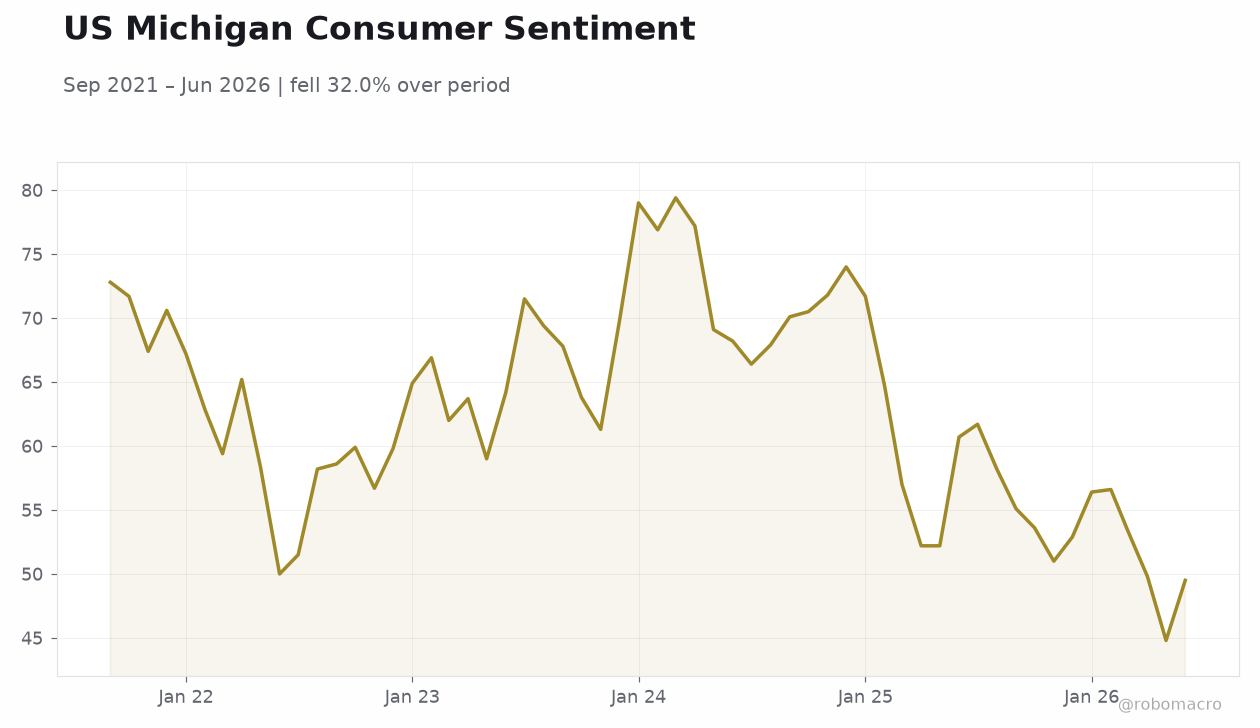 US Michigan Consumer Sentiment | Type: macro_line | Sentiment Index: 49.5 (2026-06-01) | Range: 44.8–79.4 | Trend(6pt): 72.8,56.7,79,57,44.8,49.5
Today's Economic Events
| Data | Prior | Cons | Time |
|---|---|---|---|
| ADP Employment Change Weekly | 8,250 | - | 04:15 |
| Building Permits Preliminary | 1.4m | 1.4m | 04:30 |
| Housing Starts Level | 1.4m | 1.4m | 04:30 |
| Building Permits Month-over-Month Preliminary | -2.60 | - | 04:30 |
| Export Prices Month-over-Month | -0.60 | 0.20 | 04:30 |
| Housing Starts Month-over-Month | 19 | - | 04:30 |
| Import Prices Month-over-Month | 0.30 | 0.10 | 04:30 |
| Industrial Production Month-over-Month | 0.10 | 0.30 | 05:15 |
| Pending Home Sales Month-over-Month | -5.40 | 0.20 | 06:00 |
| Pending Home Sales Year-over-Year | -0.30 | - | 06:00 |
- Empire State manufacturing beat expectations sharply while NAHB housing index edged higher.
- Treasury yields rose with the 10-year reaching 4.68 percent amid mixed equity performance.
- Focus shifts to housing starts and industrial production releases expected today.
Yesterday's Recap
US data releases showed resilience in manufacturing and housing sentiment. The NY Empire State Manufacturing Index jumped to 20.60 against a consensus of 11, marking a strong rebound from the prior 15.60 reading. The NAHB Housing Market Index improved to 35 from 34, exceeding forecasts of 33.
Net long-term TIC flows came in at 172.7 billion dollars, above the 151.4 billion consensus though below the prior 231.2 billion. Equity markets closed modestly lower, with the S&P 500 declining 0.17 percent to 7,785.76 and the Dow Jones falling 0.20 percent. The Russell 2000 advanced 0.51 percent while the Nasdaq 100 slipped 0.13 percent.
Treasury yields climbed, with the 2-year at 4.17 percent and the 10-year at 4.68 percent, reflecting reduced rate-cut expectations. Gold rose 0.86 percent to 4,455.80 as the dollar firmed against the yen. Broader context shows these releases occurred against a backdrop of moderate expansion, with GDP growing 1.50 percent quarter-over-quarter annualized and 2.10 percent year-over-year in the first quarter.
The Day Ahead
Attention centers on housing and production data due at 8:30 a.m. ET. Building permits and housing starts are both slated for release, with consensus forecasts pointing to 1.37 million permits and 1.35 million starts.
Industrial production is expected to rise 0.3 percent month-over-month following a 0.1 percent gain last month. Pending home sales are projected to increase 0.2 percent after a 5.4 percent drop. Export and import prices will also be reported, offering insight into inflation trends.
ADP employment figures and API crude oil stocks round out the calendar. Markets will monitor these prints for signals on consumer demand and manufacturing momentum ahead of the weekend. Retail sales advancing 5.01 percent year-over-year through July provide additional backdrop for interpreting housing momentum.
Other Economic Notes
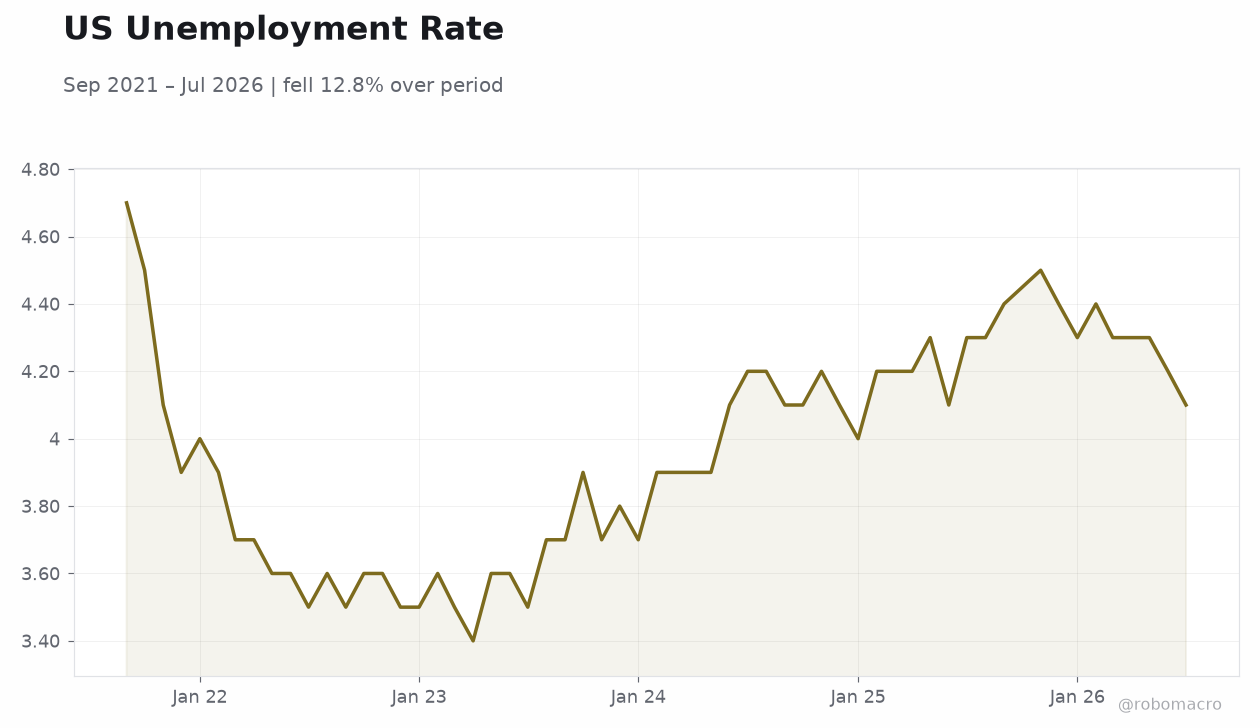
Broader US indicators point to moderate expansion with contained labor market slack. GDP grew 1.50 percent quarter-over-quarter annualized in the first quarter and 2.10 percent year-over-year. <i>↓ p.2</i>