US Macro Daily(Beta Mode)
Housing Starts Slump, Yields Advance
Market Snapshot
| Asset | Level | Change |
|---|---|---|
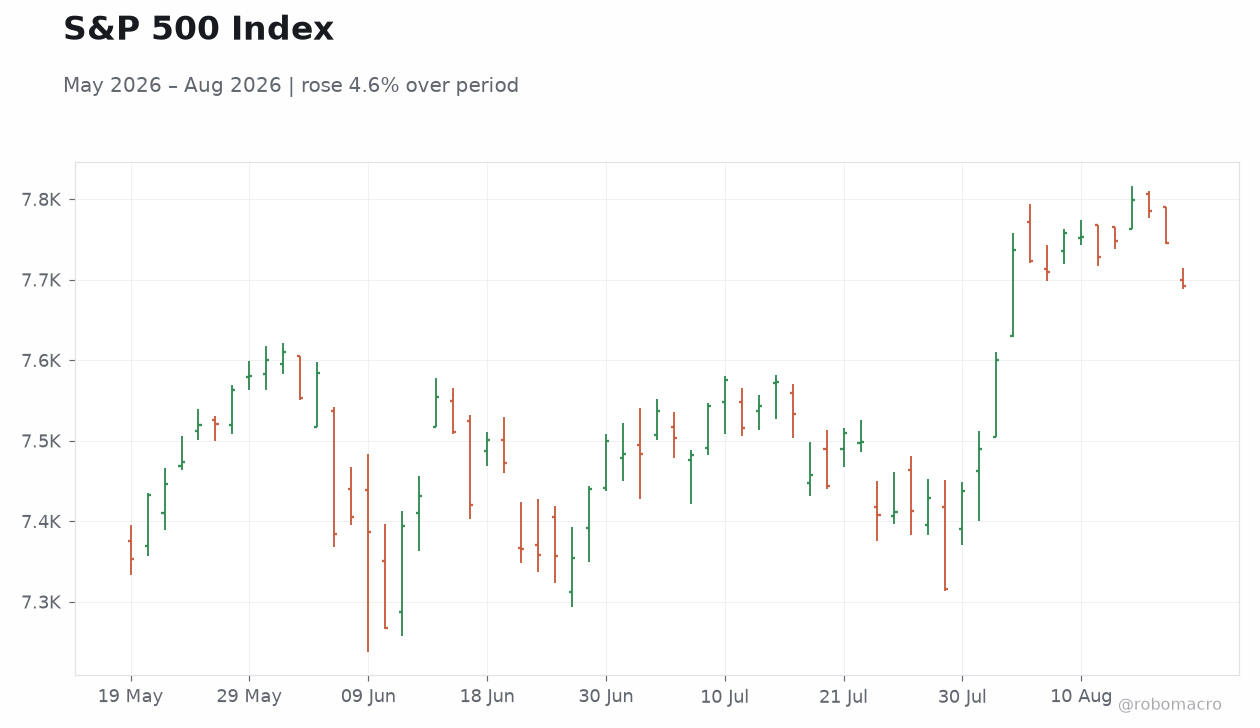
| S&P 500 | 7,691.76 | -0.69% |
| Nasdaq 100 | 29,490.96 | -1.68% |
| Dow Jones | 53,343.40 | -0.22% |
| Russell 2000 | 3,017.89 | -1.30% |
| USD/JPY | 159.09 | -0.16% |
| EUR/USD | 1.16 | +0.24% |
| GBP/USD | 1.36 | +0.06% |
| Gold | 4,422.80 | +1.30% |
| WTI Crude | 84.92 | -0.02% |
| Bitcoin | 64,400.67 | -0.43% |
| US 2Y Treasury | 4.19% | +0.48% |
| US 10Y Treasury | 4.72% | +0.85% |
Prior Economic Events
| Data | Prior | Cons | Actual |
|---|---|---|---|
| NY Empire State Manufacturing Index | 15.60 | 11 | 20.60 |
| NAHB Housing Market Index | 34 | 33 | 35 |
| Net Long-Term TIC Flows Level | 231,200m | 151,400m | 172,700m |
| ADP Employment Change Weekly | 8,250 | - | 9,500 |
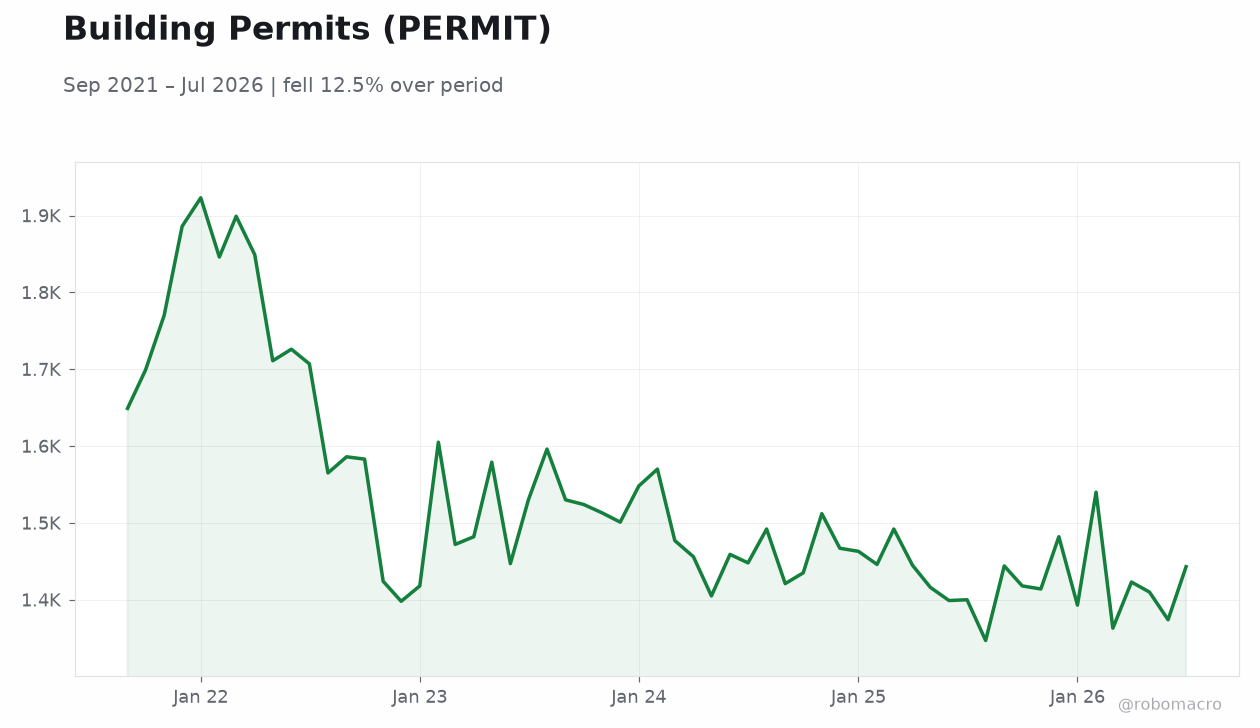
| Building Permits Preliminary | 1.4m | 1.4m | 1.4m |
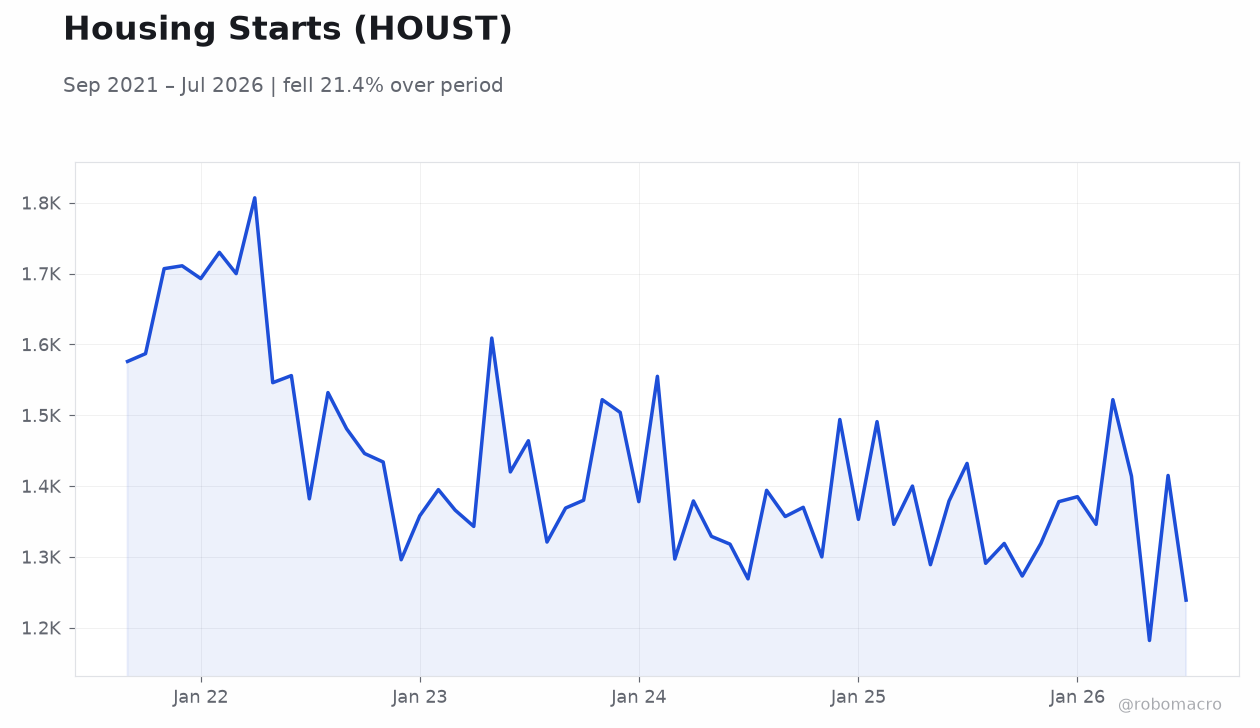
| Housing Starts Level | 1.4m | 1.4m | 1.2m |
| Building Permits Month-over-Month Preliminary | -2.60 | - | 5 |
| Export Prices Month-over-Month | -0.70 | 0.20 | -1.30 |
| Housing Starts Month-over-Month | 19.70 | - | -12.40 |
| Import Prices Month-over-Month | -0.30 | 0.10 | -0.40 |
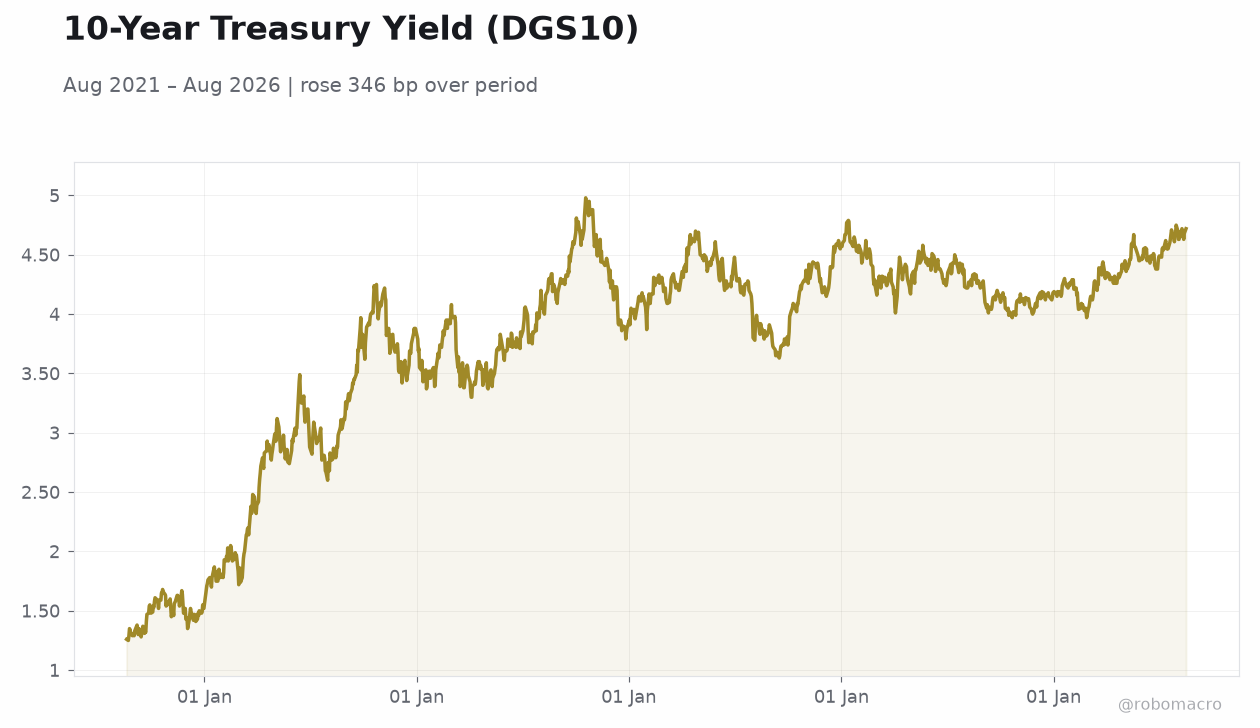 10-Year Treasury Yield (DGS10) | Type: macro_line | Percent: 4.72 (2026-08-17) | Range: 1.25–4.98 | Trend(6pt): 1.26,3.82,4.3,4.43,4.68,4.72
Today's Economic Events
| Data | Prior | Cons | Time |
|---|---|---|---|
| EIA Weekly Crude Oil Inventory | 17.4m | 200,000 | 06:30 |
| EIA Weekly Gasoline Inventory | -968,000 | - | 06:30 |
| FOMC Meeting Minutes | - | - | 10:00 |
| Thursday (2026-08-20) | |||
| Philadelphia Fed Manufacturing Index | 41.40 | 25 | 04:30 |
| Weekly Jobless Claims | 209,000 | 210,000 | 04:30 |
| Friday (2026-08-21) | |||
| S&P Global Composite PMI Flash | 54.50 | - | 05:45 |
| S&P Global Manufacturing PMI Flash | 53.90 | 53.90 | 05:45 |
| S&P Global Services PMI Flash | 54.60 | 54 | 05:45 |
- Housing starts missed forecasts sharply while permits beat
- Equities fell as 10-year yields reached 4.72 percent
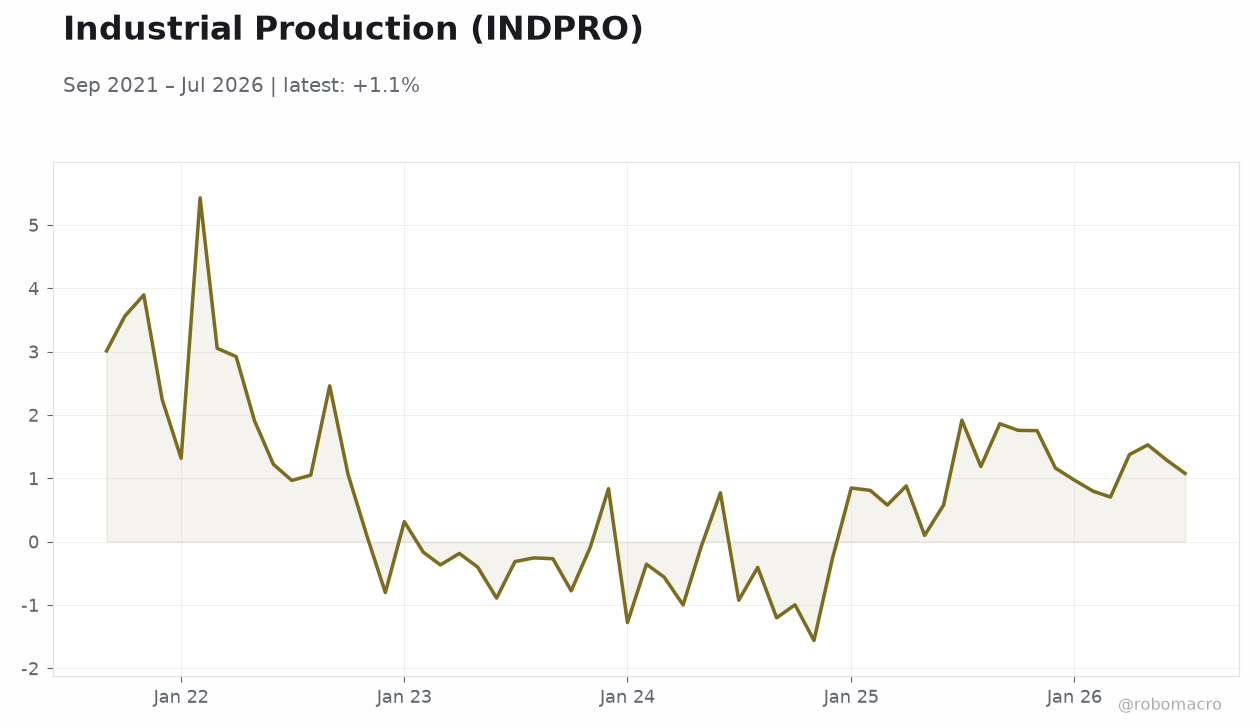
- Gold rose 1.3 percent amid softer industrial output
Yesterday's Recap
US housing data delivered mixed signals that weighed on sentiment. Housing starts dropped 12.4 percent month-over-month to 1.239 million, well below the 1.35 million consensus, while building permits rose 5 percent to 1.443 million. Industrial production grew only 0.2 percent, slightly under expectations, and pending home sales fell 2.3 percent.
The NY Empire State Manufacturing Index beat at 20.6 and the NAHB index edged higher to 35. Equities closed lower with the S&P 500 down 0.69 percent, Nasdaq 100 falling 1.68 percent, and Russell 2000 off 1.30 percent. Treasury yields climbed, with the 2-year at 4.19 percent and the 10-year at 4.72 percent.
Gold advanced 1.3 percent to 4,422.80 as investors sought safety. API crude stocks posted a large draw of 3.28 million barrels, while export and import prices both declined more than expected.
The Day Ahead
Markets will monitor follow-through from yesterday’s housing and production releases. The MBA 30-year mortgage rate release later this week will test whether higher yields are already curbing demand. API crude stock data showed a large draw that may support energy prices.
Broader attention remains on whether the mixed housing print alters views on consumer resilience. Treasury moves will set the tone for equity positioning into the end of the week. Analysts will also watch for any updates on pending home sales revisions that could refine the housing outlook.
EIA crude inventory figures due today will provide further insight into energy balances.
Other Economic Notes
US GDP expanded 1.5 percent annualized in the first quarter and 2.1 percent year-over-year, indicating moderate underlying growth. Retail sales rose 5.01 percent year-over-year through July, supporting the view of steady consumer spending. Unemployment held at 4.1 percent, consistent with a labor market that has cooled but remains above recessionary levels.
CPI inflation stood at 3.3 percent year-over-year in July, keeping price pressures above the Fed’s target. These figures together suggest the economy is expanding at a below-trend pace without clear signs of overheating or contraction. Net long-term TIC flows came in at $172.7 billion, below the prior $231.2 billion but still positive.