US Macro Daily(Beta Mode)
Q2 GDP Steady at 1.5% as Core PCE Matches Forecast
Market Snapshot
| Asset | Level | Change |
|---|---|---|
| S&P 500 | 7,675.70 | -0.02% |
| Nasdaq 100 | 29,224.52 | +0.05% |
| Dow Jones | 53,463.88 | -0.21% |
| Russell 2000 | 3,005.90 | -0.14% |
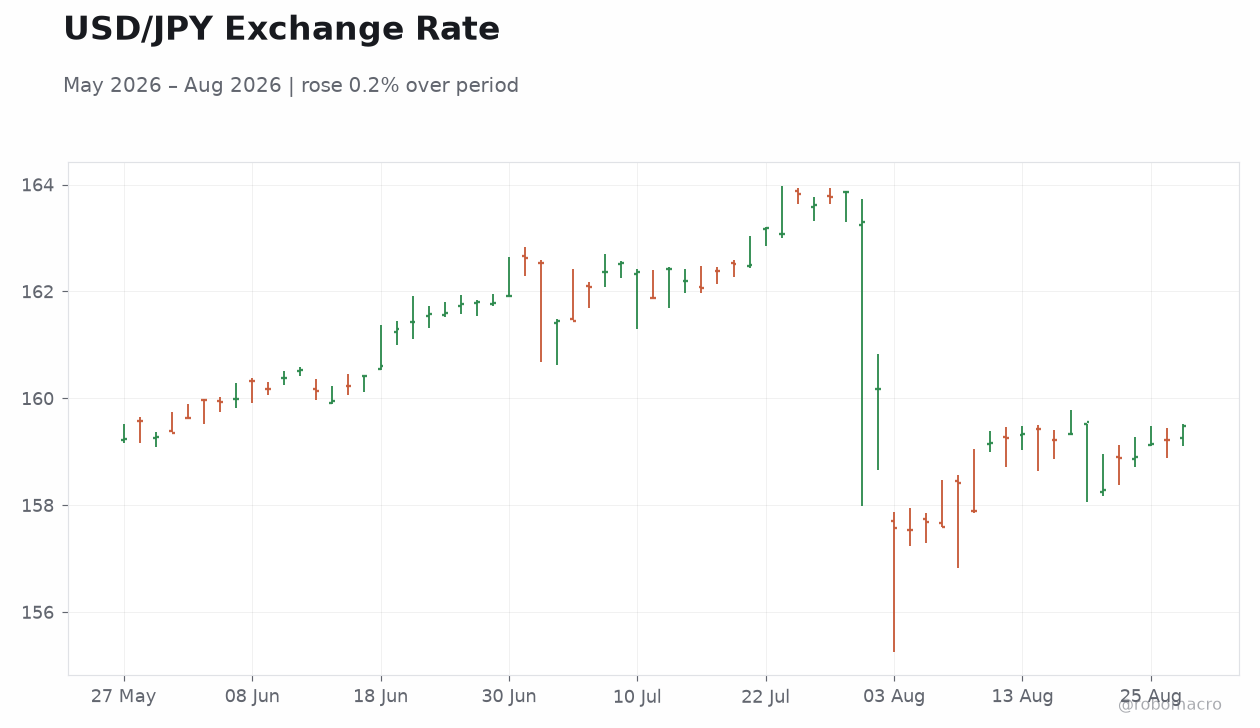
| USD/JPY | 159.48 | +0.16% |
| EUR/USD | 1.16 | -0.26% |
| GBP/USD | 1.36 | -0.53% |
| Gold | 4,640.40 | +0.92% |
| WTI Crude | 82.28 | +0.06% |
| Bitcoin | 79,615.58 | +0.74% |
| US 2Y Treasury | 4.17% | -1.65% |
| US 10Y Treasury | 4.64% | -1.28% |
Prior Economic Events
| Data | Prior | Cons | Actual |
|---|---|---|---|
| Chicago Fed National Activity Index | 0.06 | - | -0.08 |
| Treasury Secretary Bessent Speech | - | - | - |
| Speech by Fed's Barkin | - | - | - |
| ADP Employment Change Weekly | 9,500 | - | 11,750 |
| S&P/Case-Shiller Home Price Year-over-Year | 1.60 | 1.70 | 2.10 |
| CB Consumer Confidence | 90.20 | - | 89.40 |
| New Home Sales Level | 678,000 | 620,000 | 607,000 |
| New Home Sales Month-over-Month | 7.60 | - | -10.50 |
| Speech by Fed's Barkin | - | - | - |
| MBA 30-Year Mortgage Rate | 6.77 | - | 6.78 |
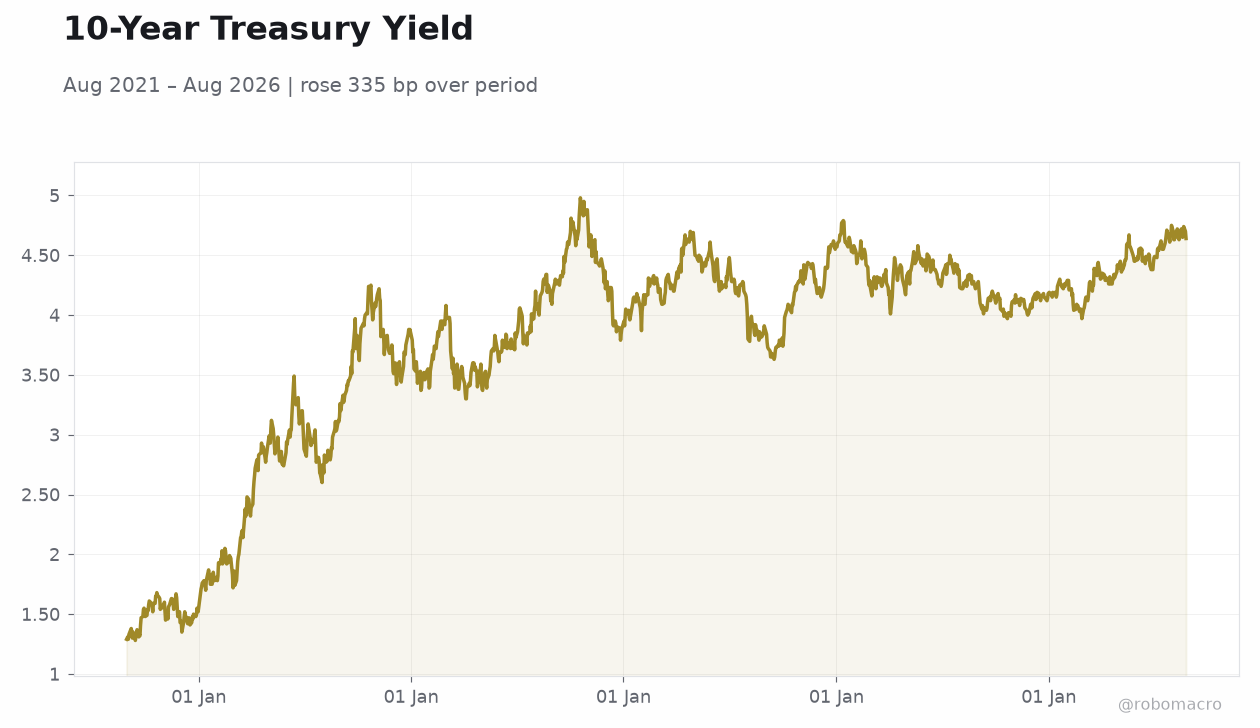 10-Year Treasury Yield | Type: macro_line | %: 4.64 (2026-08-25) | Range: 1.28–4.98 | Trend(6pt): 1.29,3.75,4.31,4.43,4.7,4.64
Today's Economic Events
| Data | Prior | Cons | Time |
|---|---|---|---|
| Goods Trade Balance Advance | -101,400m | -99,000m | 04:30 |
| Retail Inventories excluding Autos Month-over-Month Advance | -0.40 | - | 04:30 |
| Weekly Jobless Claims | 206,000 | 208,000 | 04:30 |
| Wholesale Inventories Month-over-Month Advance | 0.20 | 0.10 | 04:30 |
| Friday (2026-08-28) | |||
| Chicago PMI Index | 57.60 | 57 | 05:45 |
| Non Farm Payrolls Annual Revision Prel | -911,000 | - | 06:00 |
| Speech by Fed's Chair Warsh | - | - | 06:00 |
| Michigan Consumer Sentiment Final | 55.20 | 51 | 06:00 |
- Q2 GDP confirmed at 1.5% QoQ with personal income rising 0.4% MoM.
- Core PCE matched 0.2% consensus while durable goods orders jumped 1.1%.
- Equities held near flat; 10-year yield fell 6 bps to 4.64%.
Yesterday's Recap
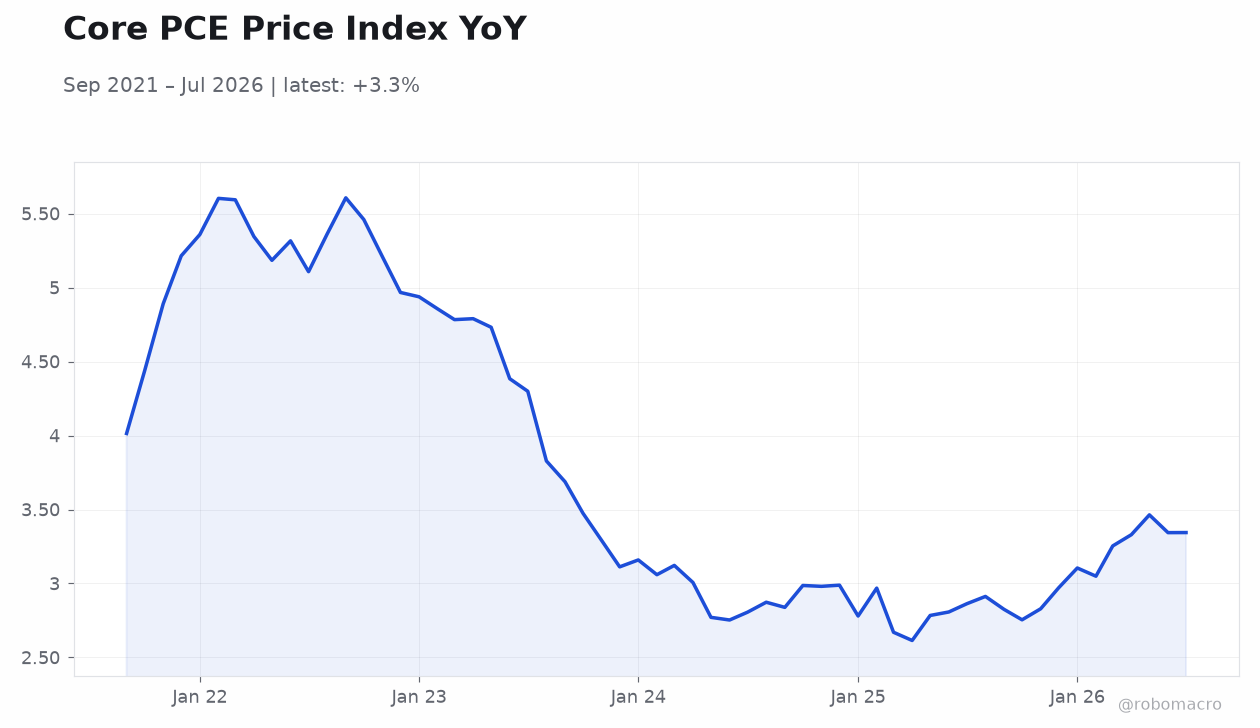
US data showed the economy expanding at a 1.5% annualized pace in Q2, matching the prior estimate and signaling slower growth. Core PCE rose 0.2% MoM as expected, keeping the year-over-year rate above the Fed’s 2% target for the 65th straight month. Durable goods orders surged 1.1% while personal income climbed 0.4% and spending rose 0.2%.
Case-Shiller home prices increased 2.1% YoY, yet new home sales fell 10.5% MoM and consumer confidence slipped to 89.4. ADP private payrolls rose 11,750 weekly. The S&P 500 closed at 7,675.70, down 0.02%, the Nasdaq 100 edged up 0.05%, and the 10-year Treasury yield declined to 4.64%.
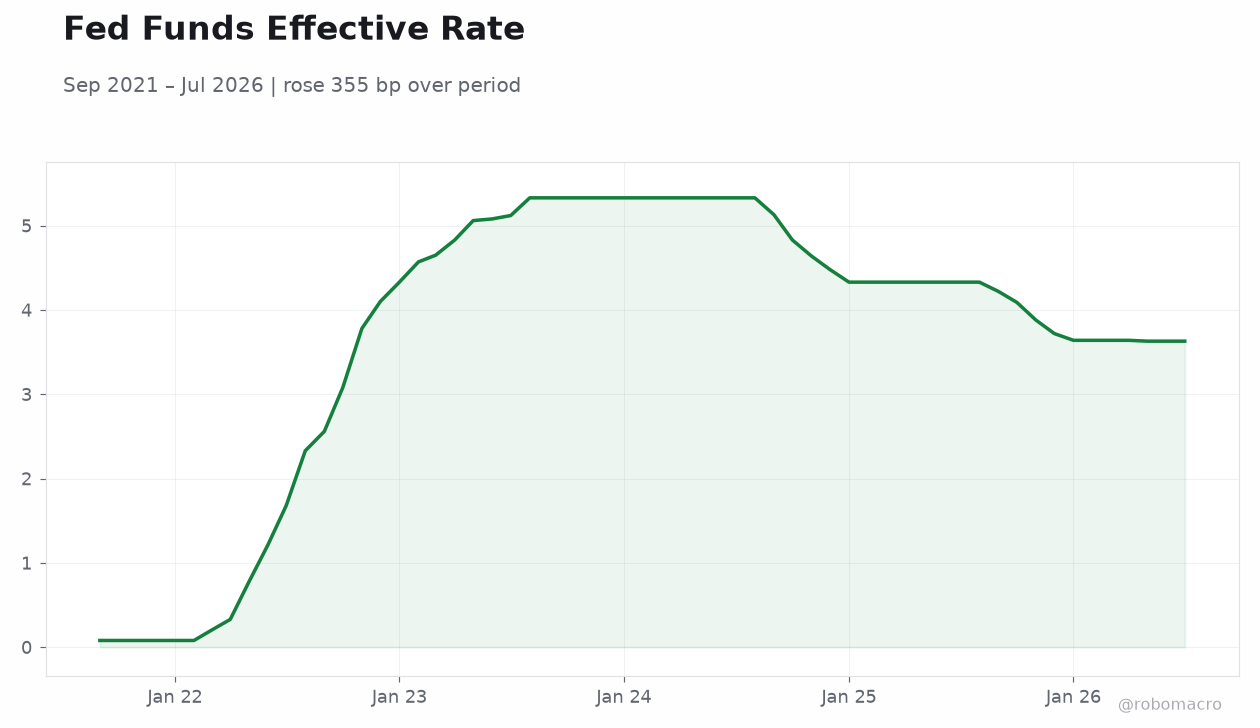
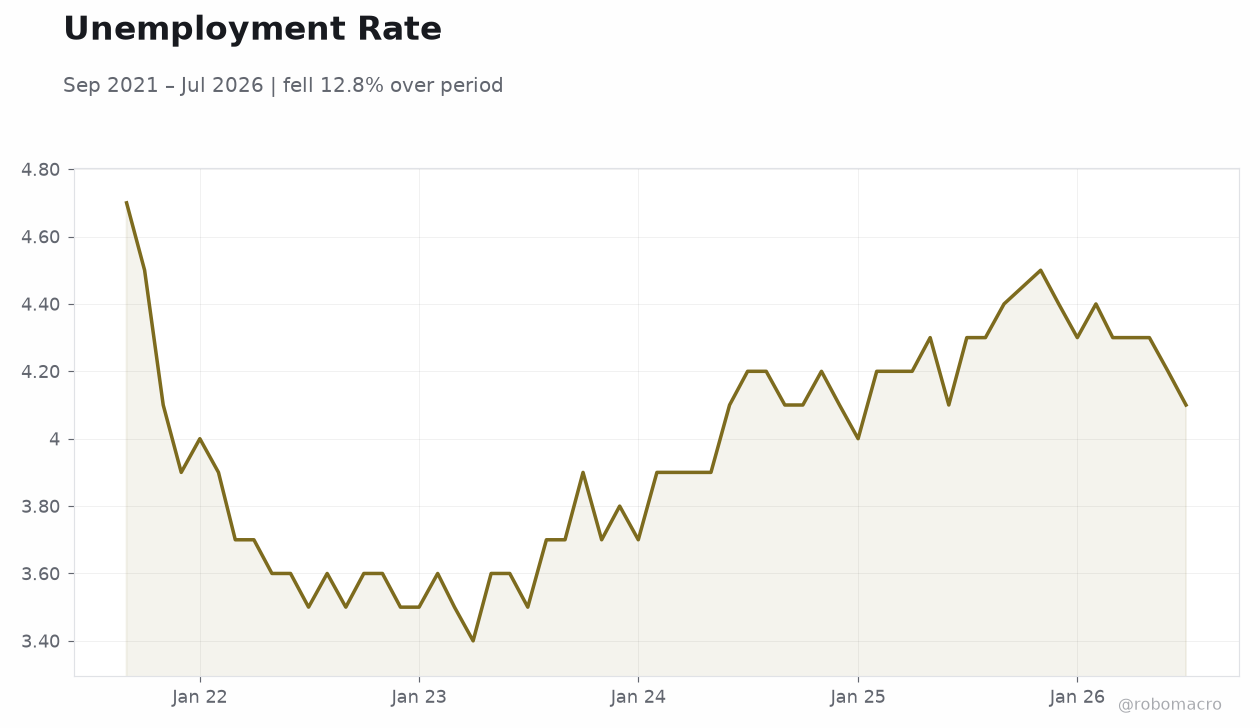
Gold advanced 0.92% to $4,640.40 amid the mixed inflation and growth signals. Retail sales running at 5.01% YoY continue to support consumer resilience despite higher borrowing costs. Unemployment at 4.1% remains low enough to keep the Fed on hold while inflation stays elevated.
The Day Ahead
Markets will focus on Nvidia earnings and any follow-up comments from regional Fed speakers. Treasury auctions and mortgage rate data are scheduled, with the 30-year fixed rate already at 6.78%. Traders will monitor USD/JPY near 159.48 and EUR/USD at 1.16 for signs of dollar strength.
Equity futures point to a cautious open ahead of potential tariff-related headlines. Volatility is expected to remain contained unless inflation or labor data surprise. The combination of 1.5% GDP growth and persistent 3.3% CPI prints points to a soft-landing scenario with limited room for aggressive easing.
Treasury yields at 4.17% on the 2-year and 4.64% on the 10-year reflect markets pricing fewer cuts than previously expected.
Other Economic Notes
The combination of 1.5% GDP growth and persistent 3.3% CPI prints points to a soft-landing scenario with limited room for aggressive easing. Retail sales running at 5.01% YoY continue to support consumer resilience despite higher borrowing costs. Treasury yields at 4.17% on the 2-year and 4.64% on the 10-year reflect markets pricing fewer cuts than previously expected.
Unemployment at 4.1% remains low enough to keep the Fed on hold while inflation stays elevated. <i>↓ p.2</i>