US Macro Daily(Beta Mode)
PCE Aligns as GDP Slows to 1.5%
Market Snapshot
| Asset | Level | Change |
|---|---|---|
| S&P 500 | 7,730.99 | +0.72% |
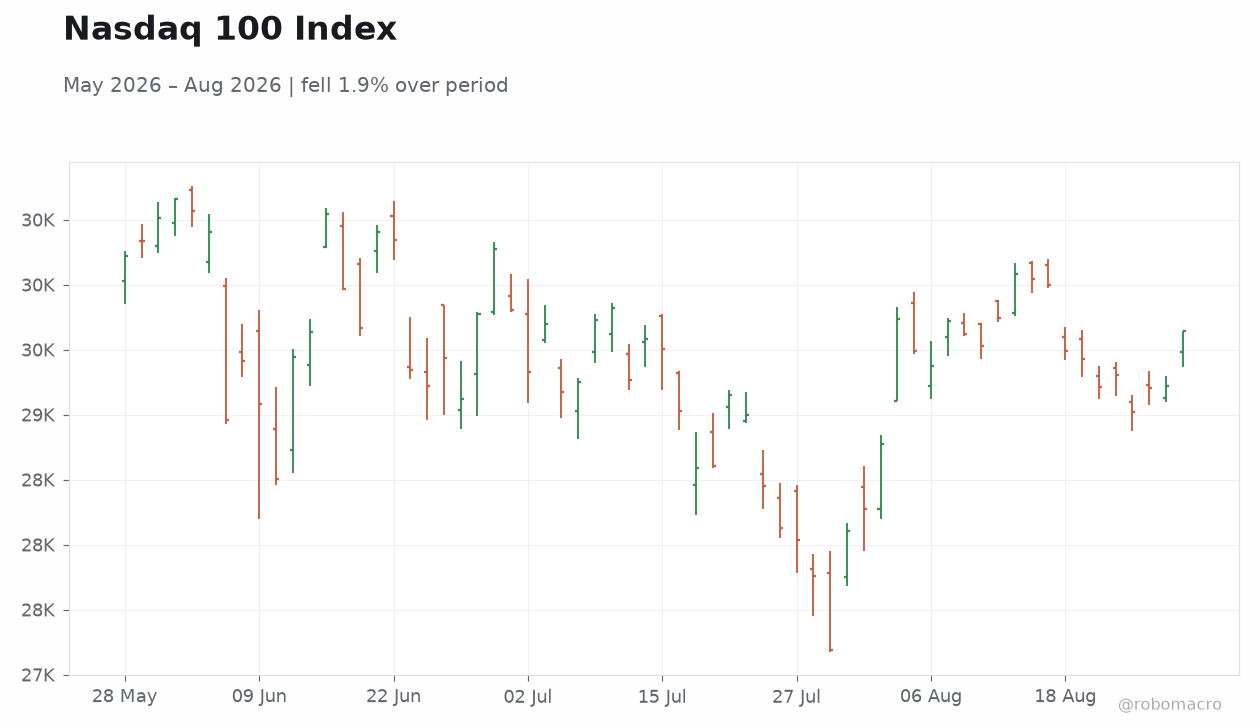
| Nasdaq 100 | 29,641.56 | +1.43% |
| Dow Jones | 53,569.44 | +0.20% |
| Russell 2000 | 3,014.34 | +0.28% |
| USD/JPY | 159.64 | +0.24% |
| EUR/USD | 1.17 | -0.01% |
| GBP/USD | 1.36 | -0.04% |
| Gold | 4,654.10 | +0.96% |
| WTI Crude | 83.41 | -0.14% |
| Bitcoin | 79,599.38 | -0.82% |
| US 2Y Treasury | 4.19% | +0.48% |
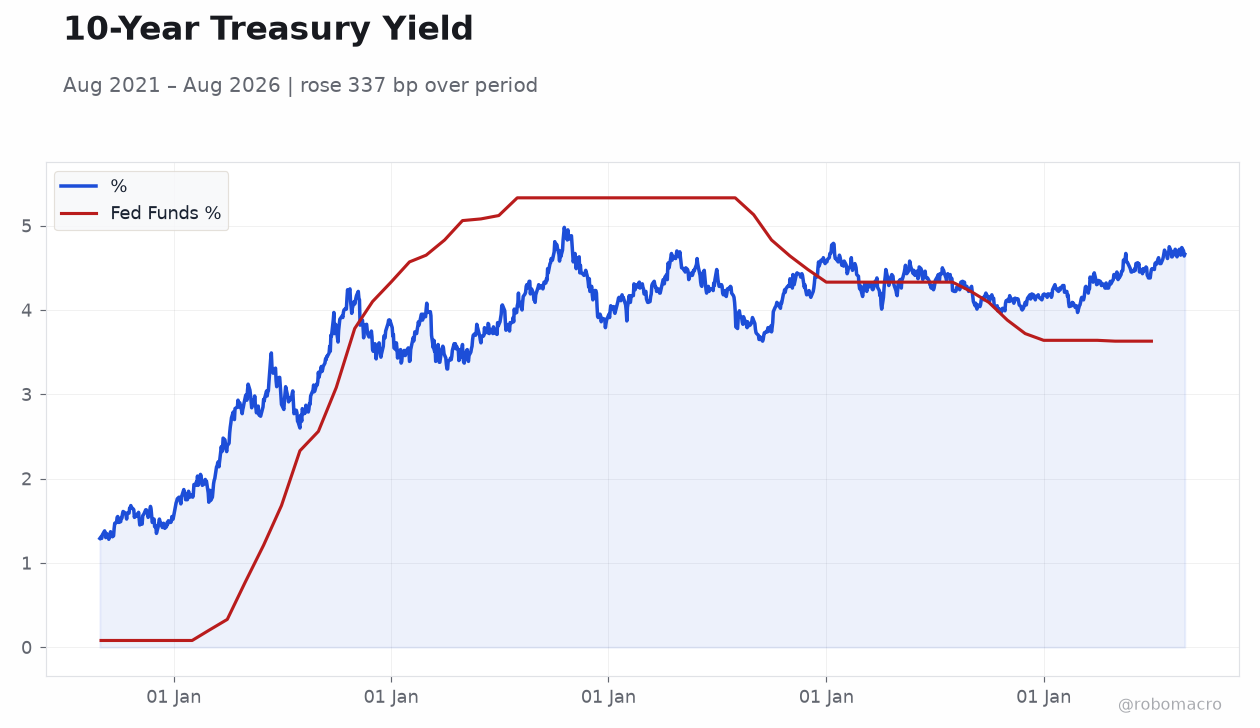
| US 10Y Treasury | 4.66% | +0.43% |
Prior Economic Events
| Data | Prior | Cons | Actual |
|---|---|---|---|
| Chicago Fed National Activity Index | 0.06 | - | -0.08 |
| Treasury Secretary Bessent Speech | - | - | - |
| Speech by Fed's Barkin | - | - | - |
| ADP Employment Change Weekly | 9,500 | - | 11,750 |
| S&P/Case-Shiller Home Price Year-over-Year | 1.60 | 1.70 | 2.10 |
| CB Consumer Confidence | 90.20 | - | 89.40 |
| New Home Sales Level | 678,000 | 620,000 | 607,000 |
| New Home Sales Month-over-Month | 7.60 | - | -10.50 |
| Speech by Fed's Barkin | - | - | - |
| MBA 30-Year Mortgage Rate | 6.77 | - | 6.78 |
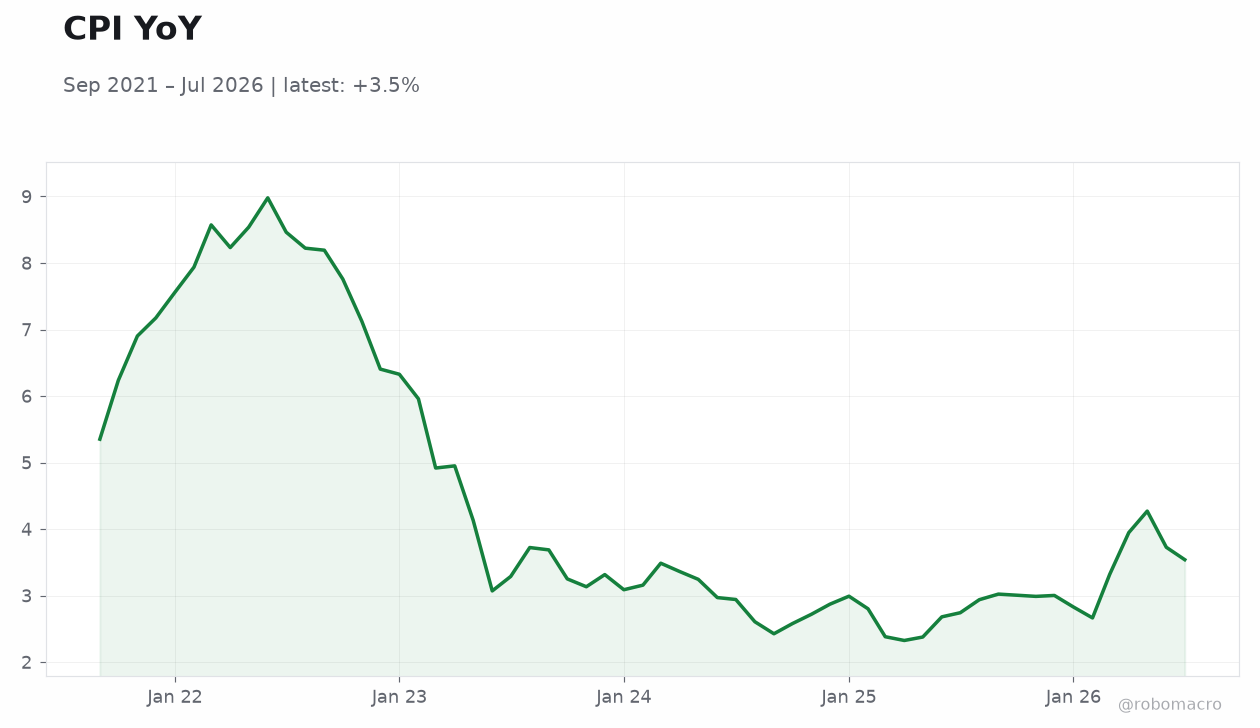
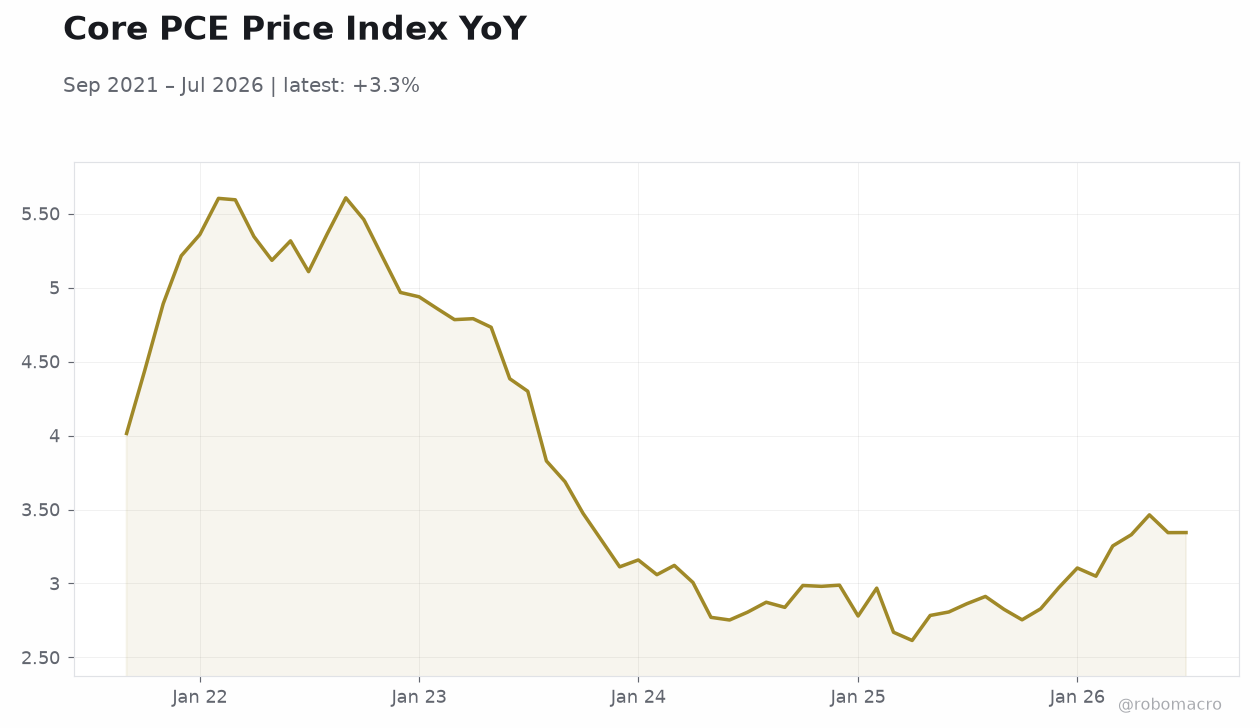 Core PCE Price Index YoY | Type: macro_line | YoY %: 3.344 (2026-07-01) | Range: 2.615–5.606 | Trend(6pt): 4.014,5.208,3.159,2.67,3.464,3.344
Today's Economic Events
| Data | Prior | Cons | Time |
|---|---|---|---|
| Chicago PMI Index | 57.60 | 57 | 05:45 |
| Non Farm Payrolls Annual Revision Prel | -911,000 | - | 06:00 |
| Speech by Fed's Chair Warsh | - | - | 06:00 |
| Michigan Consumer Sentiment Final | 55.20 | 51 | 06:00 |
- Core PCE rises 0.2% m/m in line with forecasts while Q2 GDP revises down to 1.5% annualized
- Equities advance with Nasdaq 100 up 1.43% on tech gains as 10-year yield climbs to 4.66%
- Personal income beats at 0.4% m/m but new home sales fall 10.5% m/m to 607,000 units
Yesterday's Recap
US data showed mixed signals on growth and inflation. The second estimate for Q2 GDP growth came in at 1.5% annualized, below the prior 2.1% reading and matching consensus. Core PCE rose 0.2% m/m as expected, while durable goods orders jumped 1.1% m/m versus a 0.5% consensus.
Personal income increased 0.4% m/m, outpacing forecasts, and personal spending rose 0.2% m/m. S&P/Case-Shiller home prices accelerated to 2.1% y/y. Consumer confidence slipped to 89.4 and new home sales dropped sharply.
Equity markets rose, led by the Nasdaq 100 at +1.43%, while the S&P 500 gained 0.72% and the 10-year Treasury yield increased 0.43% to 4.66%. Gold advanced 0.96% to $4,654.10. The ADP employment change printed 11,750 and the Chicago Fed National Activity Index fell to -0.08.
Mortgage rates edged up to 6.78%. Broader equity breadth remained positive with the Dow Jones rising 0.20% and Russell 2000 adding 0.28%. Currency moves stayed contained, with USD/JPY at 159.64.
The Day Ahead
Attention shifts to the Jackson Hole conference where Fed speakers including Kevin Warsh will address policy amid inflation concerns. No major data releases are scheduled for August 28. Markets will parse comments for signals on the path of the 3.63% fed funds rate.
Treasury yields and USD crosses may react to any hawkish tones on price pressures. Equity positioning could adjust ahead of potential shifts in rate-cut odds. Broader focus remains on how labor and inflation data interact with forward guidance.
The Chicago PMI Index is also due and could highlight regional manufacturing trends.
Other Economic Notes
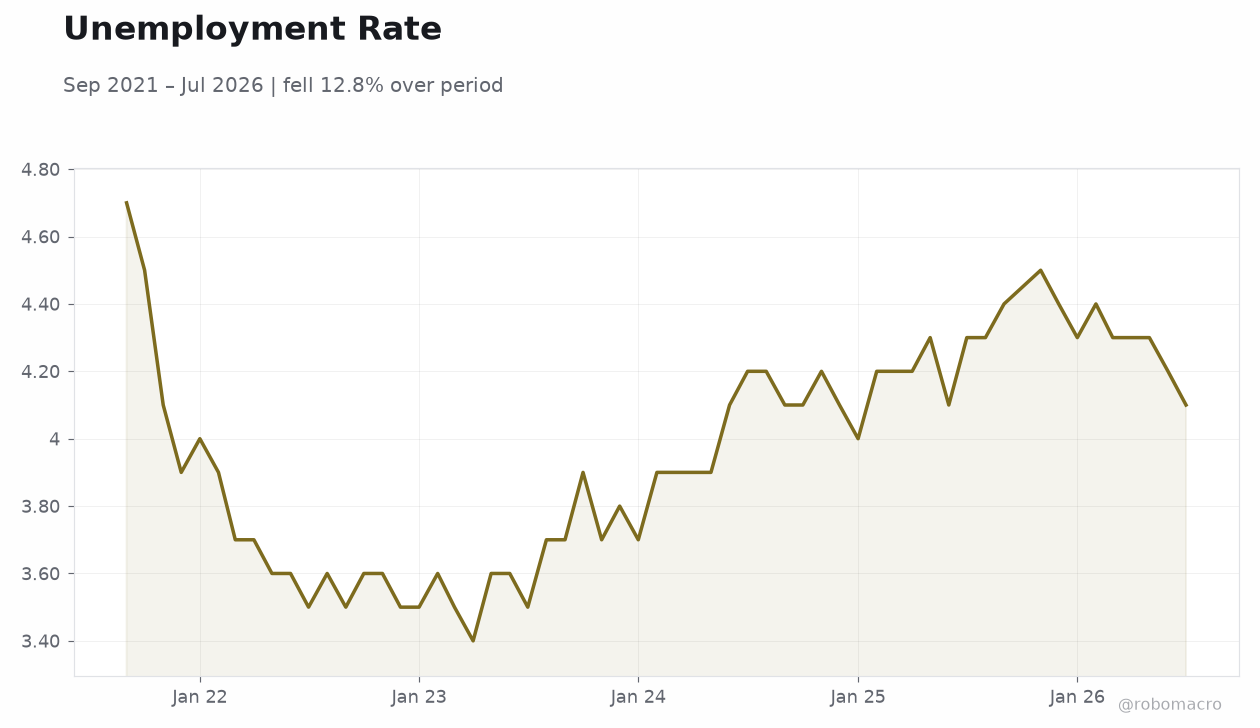
The US economy shows resilience in income and orders data yet faces softening in housing and consumer sentiment. Retail sales growth at 5.01% y/y supports spending but unemployment at 4.10% and CPI at 3.30% y/y keep policy vigilance high. Tariff actions with Canada add uncertainty to trade-sensitive sectors.
<i>↓ p.2</i>