US Macro Daily(Beta Mode)
Dallas Fed Surges Ahead of ISM Print
Market Snapshot
| Asset | Level | Change |
|---|---|---|
| S&P 500 | 7,686.14 | -0.33% |
| Nasdaq 100 | 29,456.97 | +0.08% |
| Dow Jones | 53,185.90 | -0.70% |
| Russell 2000 | 2,956.45 | -0.54% |
| USD/JPY | 160.12 | +0.50% |
| EUR/USD | 1.16 | +0.05% |
| GBP/USD | 1.35 | -0.06% |
| Gold | 4,424.80 | -0.14% |
| WTI Crude | 87.80 | +2.38% |
| Bitcoin | 77,946.20 | -0.77% |
| US 2Y Treasury | 4.34% | 0 bp |
| US 10Y Treasury | 4.75% | +2 bp |
Prior Economic Events
| Data | Prior | Cons | Actual |
|---|---|---|---|
| Dallas Fed Manufacturing Index | 1.30 | - | 11.60 |
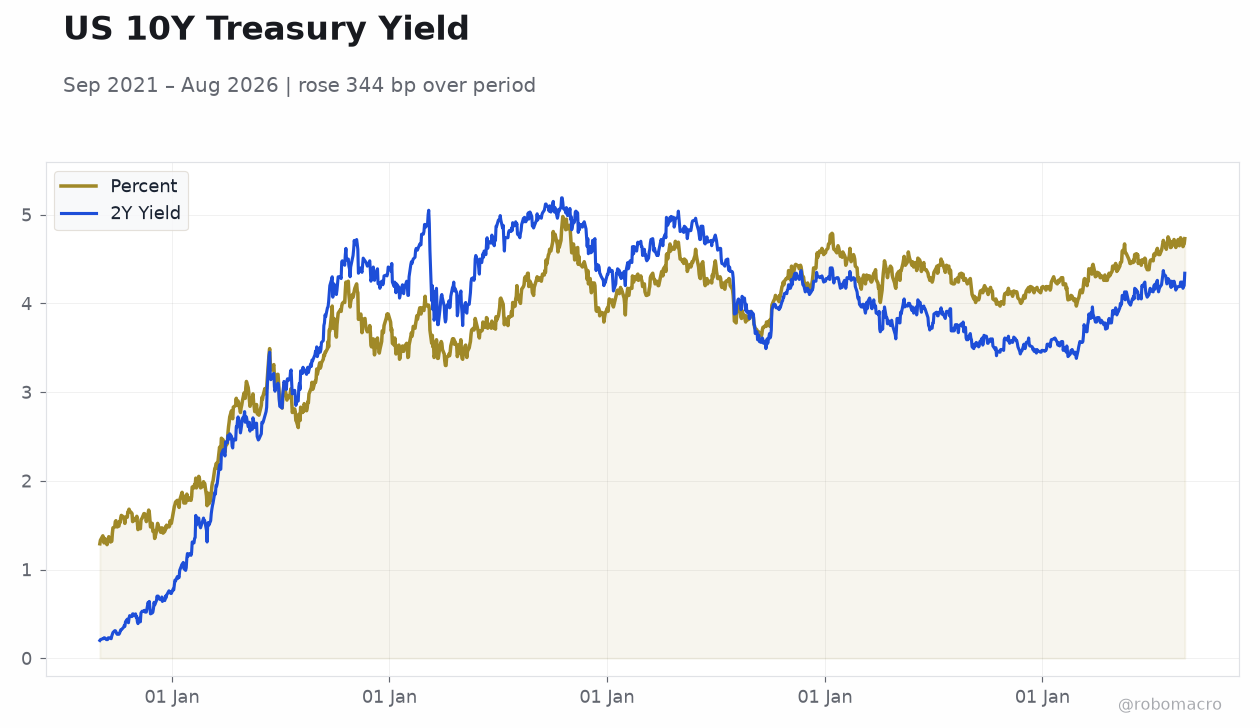 US 10Y Treasury Yield | Type: macro_line | Percent: 4.73 (2026-08-28) | Range: 1.28–4.98 | Trend(6pt): 1.29,3.51,4.19,4.41,4.67,4.73 | 2Y Yield: 4.34 (2026-08-28) | Range: 0.2–5.19 | Trend(6pt): 0.2,4.28,4.54,3.89,4.2,4.34
Today's Economic Events
| Data | Prior | Cons | Time |
|---|---|---|---|
| Speech by Fed's Barr | - | - | 05:05 |
| ISM Manufacturing PMI Index | 55.60 | 55.20 | 06:00 |
| JOLTs Job Openings Level | 7.4m | 7.3m | 06:00 |
| ISM Manufacturing Employment Level | 52.80 | - | 06:00 |
| API Weekly Crude Oil Stocks | 4.2m | - | 12:30 |
- Dallas Fed Manufacturing Index jumps to 11.6 from 1.3
- S&P 500 falls 0.33% while 2Y Treasury yield rises to 4.34%
- Markets await ISM Manufacturing and JOLTs data today
Yesterday's Recap
The Dallas Fed Manufacturing Index climbed sharply to 11.6 on August 31, signaling stronger regional factory activity than the prior 1.3 reading. Equity markets closed mixed, with the S&P 500 declining 0.33% to 7,686.14 and the Dow Jones dropping 0.70% to 53,185.90 while the Nasdaq 100 edged up 0.08%. Treasury yields increased across the curve, lifting the 2Y note to 4.34% and the 10Y note to 4.73%.
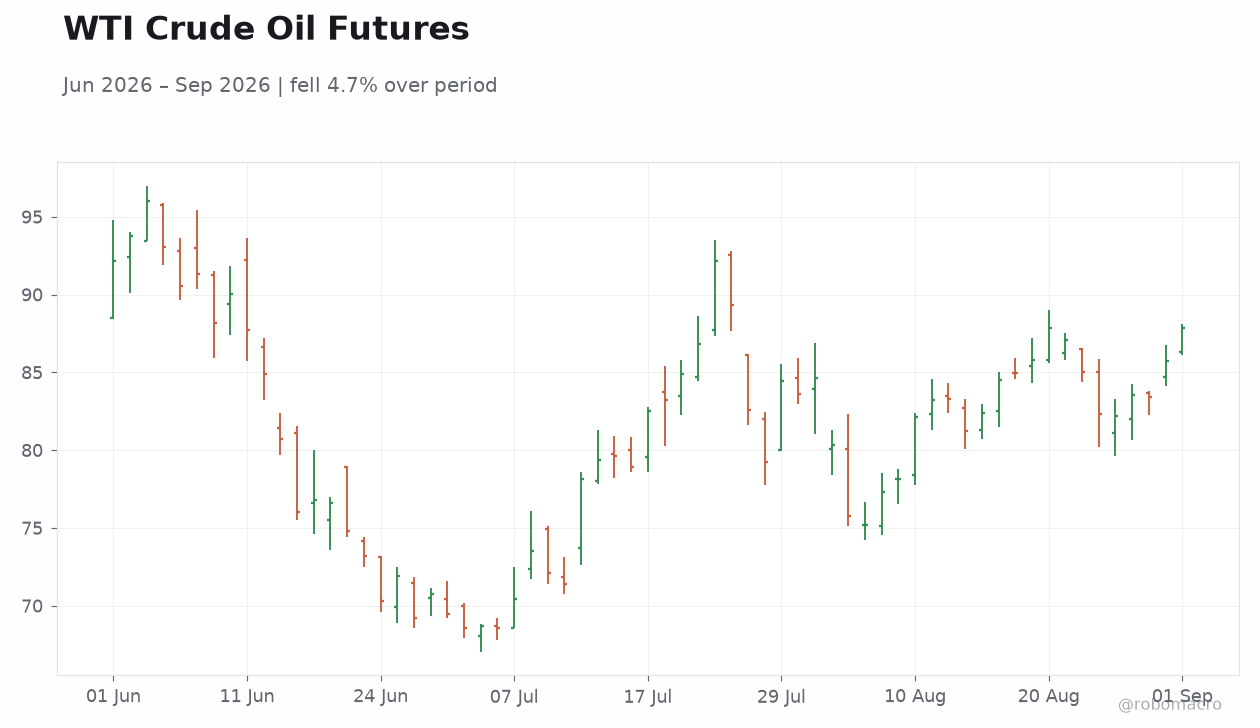
WTI Crude advanced 2.38% to 87.80 amid supply concerns. The USD/JPY pair rose 0.50% to 160.12 as the dollar strengthened modestly against the yen. Bitcoin slipped 0.77% to 77,946.20.
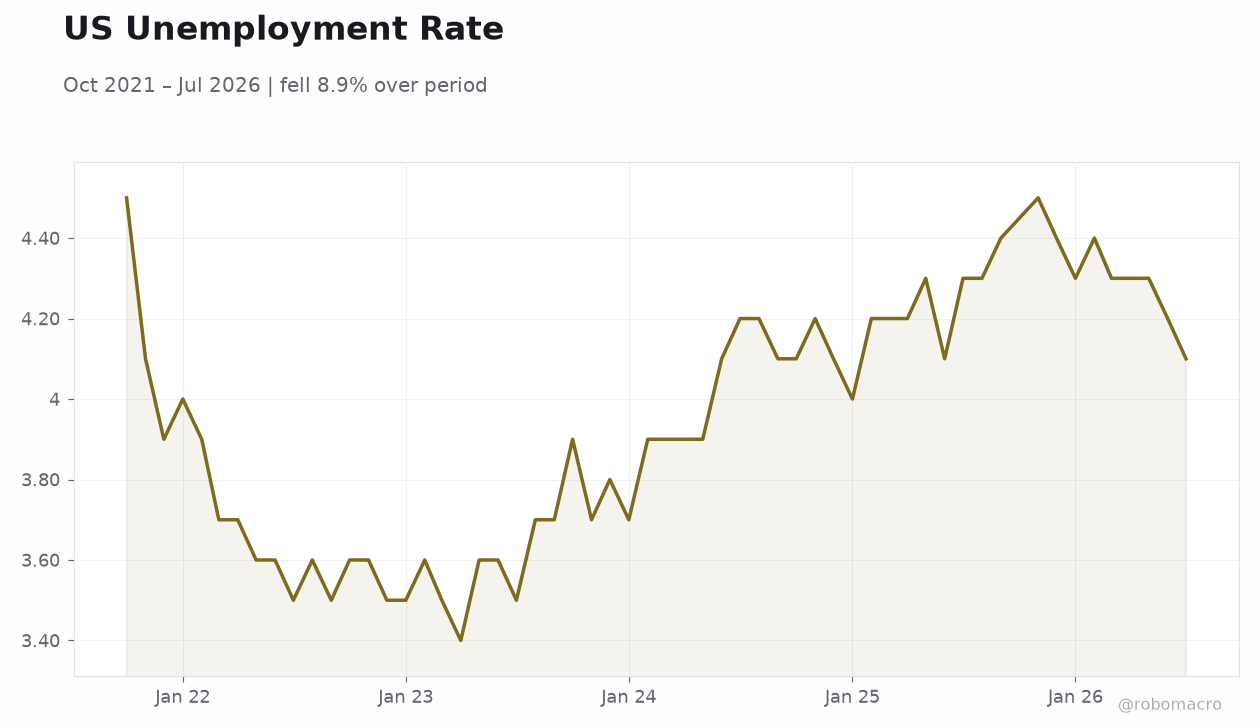
Overall, the session reflected caution ahead of the September 1 data slate and the long weekend. US GDP expanded at a 1.50% annualized rate in the first quarter while year-over-year growth registered 2.10%. Retail sales rose 5.01% year-over-year through July, supporting consumer resilience despite the 4.10% unemployment rate.
The Day Ahead
Investors will focus on the 6:00 a.m. ISM Manufacturing PMI release, expected at 55.2 versus the prior 55.6, alongside JOLTs Job Openings projected at 7.3 million. Fed Governor Michael Barr is scheduled to speak at 5:05 a.m., offering potential policy signals.
The ISM Manufacturing Employment sub-index and API crude oil stock data round out the calendar at lower impact. Markets will parse any deviation in factory readings for clues on growth momentum and labor demand. Positioning remains light into the holiday-shortened week, with attention turning to ADP employment and factory orders on September 2.
CPI inflation stood at 3.30% year-over-year in July, above the Fed’s 2% target. The 3.63% federal funds rate continues to anchor policy expectations.
Other Economic Notes
These indicators together point to moderate expansion with persistent price pressures that limit room for aggressive easing. US GDP expanded at a 1.50% annualized rate in the first quarter while year-over-year growth registered 2.10%. Retail sales rose 5.01% year-over-year through July, supporting consumer resilience despite the 4.10% unemployment rate.
CPI inflation stood at 3.30% year-over-year in July, above the Fed’s 2% target. The 3.63% federal funds rate continues to anchor policy expectations. These indicators together point to moderate expansion with persistent price pressures that limit room for aggressive easing.