US Macro Daily(Beta Mode)
ISM Manufacturing Misses as Stocks Slide
Market Snapshot
| Asset | Level | Change |
|---|---|---|
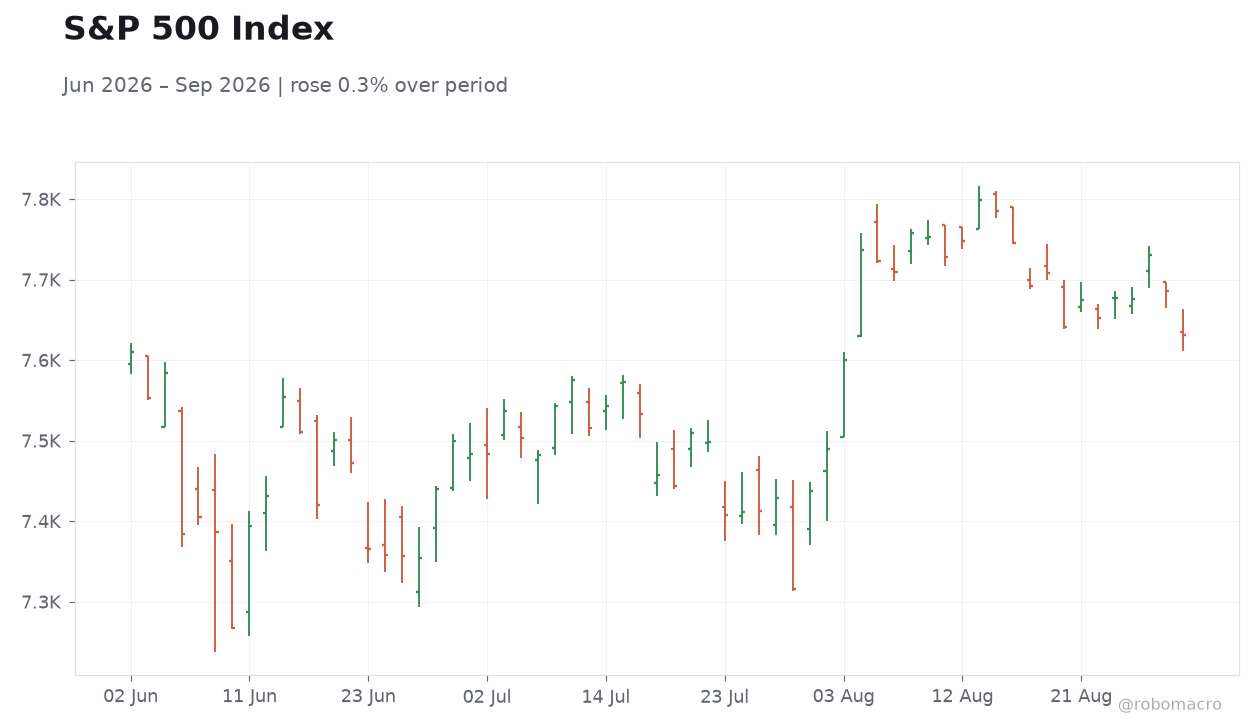
| S&P 500 | 7,631.47 | -0.71% |
| Nasdaq 100 | 29,077.22 | -1.29% |
| Dow Jones | 52,766.88 | -0.79% |
| Russell 2000 | 2,920.13 | -1.23% |
| USD/JPY | 159.90 | +0.10% |
| EUR/USD | 1.16 | -0.36% |
| GBP/USD | 1.35 | -0.49% |
| Gold | 4,354.70 | +0.15% |
| WTI Crude | 90.41 | +0.21% |
| Bitcoin | 76,594.44 | -1.05% |
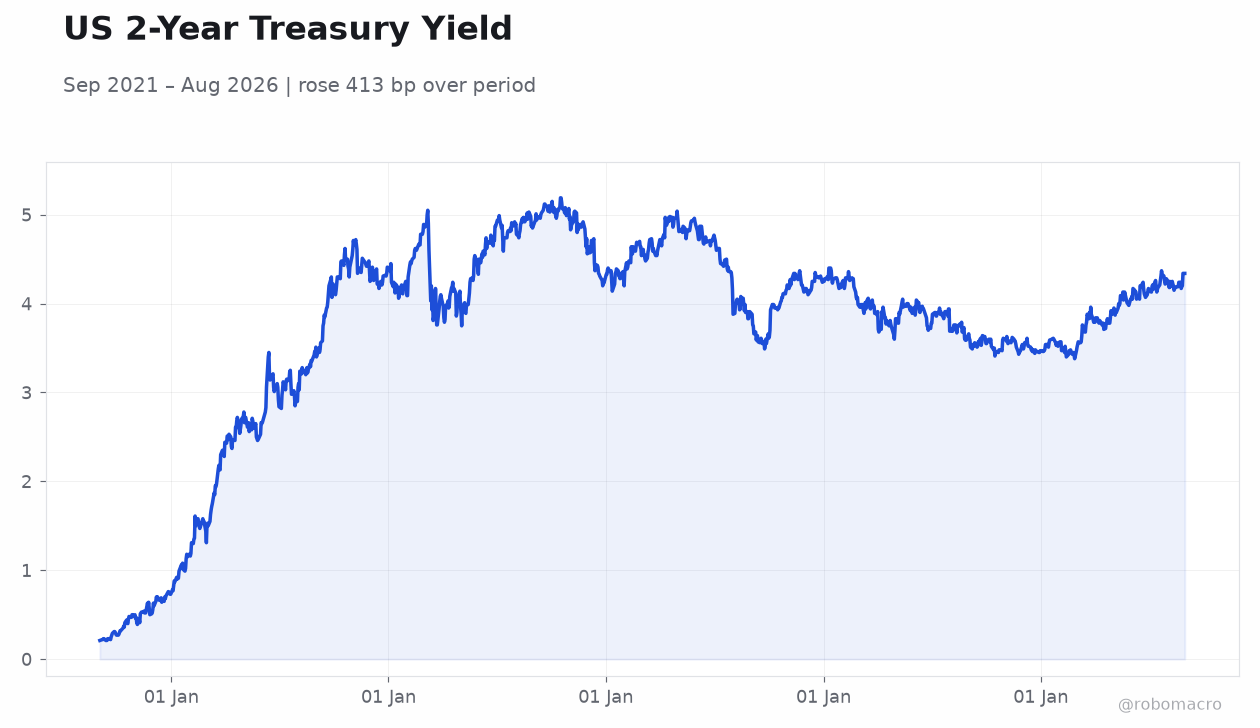
| US 2Y Treasury | 4.39% | +5 bp |
| US 10Y Treasury | 4.79% | +4 bp |
Prior Economic Events
| Data | Prior | Cons | Actual |
|---|---|---|---|
| Dallas Fed Manufacturing Index | 1.30 | - | 11.60 |
| Speech by Fed's Barr | - | - | - |
| ISM Manufacturing PMI Index | 55.60 | 55.20 | 54.60 |
| JOLTs Job Openings Level | 7.2m | 7.3m | 7.3m |
| ISM Manufacturing Employment Level | 52.80 | - | 51.20 |
| API Weekly Crude Oil Stocks | 4.2m | -800,000 | -2.6m |
| MBA 30-Year Mortgage Rate | 6.78 | - | - |
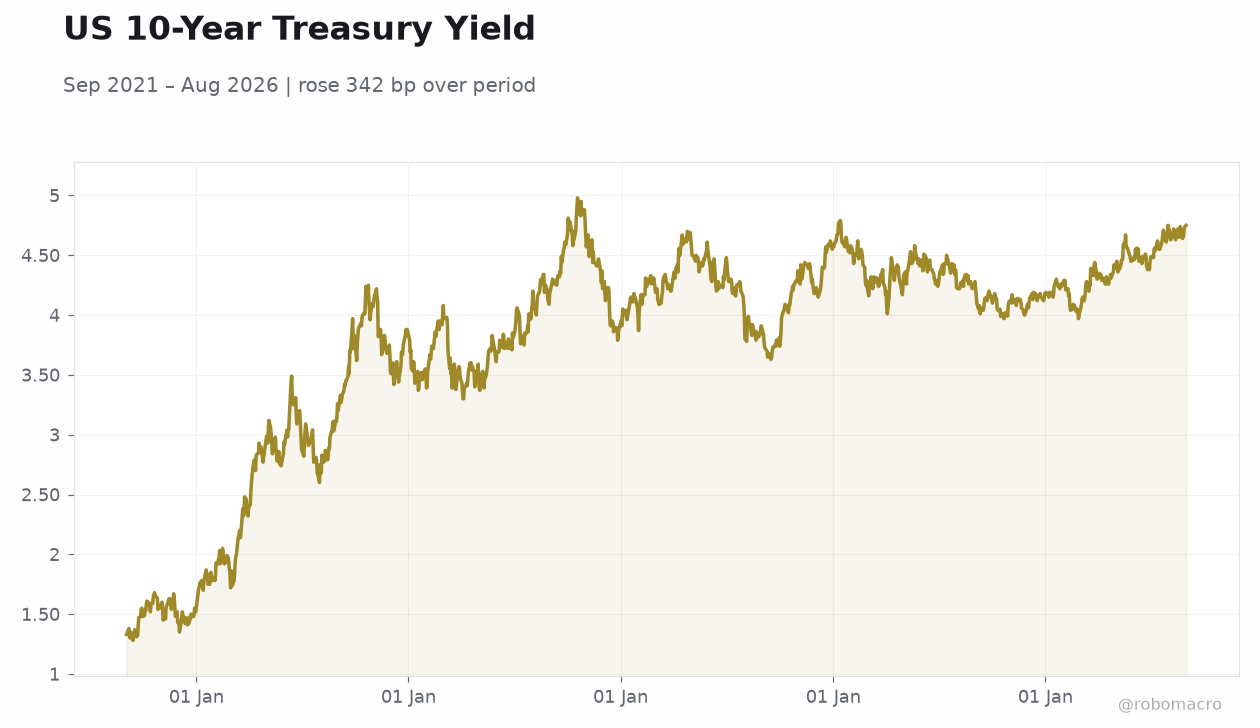 US 10-Year Treasury Yield | Type: macro_line | Percent: 4.75 (2026-08-31) | Range: 1.28–4.98 | Trend(6pt): 1.33,3.6,4.22,4.46,4.73,4.75
Today's Economic Events
| Data | Prior | Cons | Time |
|---|---|---|---|
| ADP Employment Change | 44,000 | 47,000 | 04:15 |
| Factory Orders Month-over-Month | -0.30 | 0.70 | 06:00 |
| EIA Weekly Crude Oil Inventory | 95,000 | -400,000 | 06:30 |
| EIA Weekly Gasoline Inventory | -2.5m | - | 06:30 |
| Thursday (2026-09-03) | |||
| Exports Level | 314,700m | - | 04:30 |
| Imports Level | 388,000m | - | 04:30 |
| Speech by Fed's Waller | - | - | 04:30 |
| Trade Balance | -73,300m | -90,000m | 04:30 |
| Weekly Jobless Claims | 203,000 | 205,000 | 04:30 |
- ISM Manufacturing PMI fell to 54.6 in August, missing consensus of 55.2 and signaling slower factory activity.
- Equities declined with S&P 500 down 0.71% to 7,631.47 and Nasdaq 100 off 1.29%, while 10-year Treasury yields rose 4 bp to 4.79%.
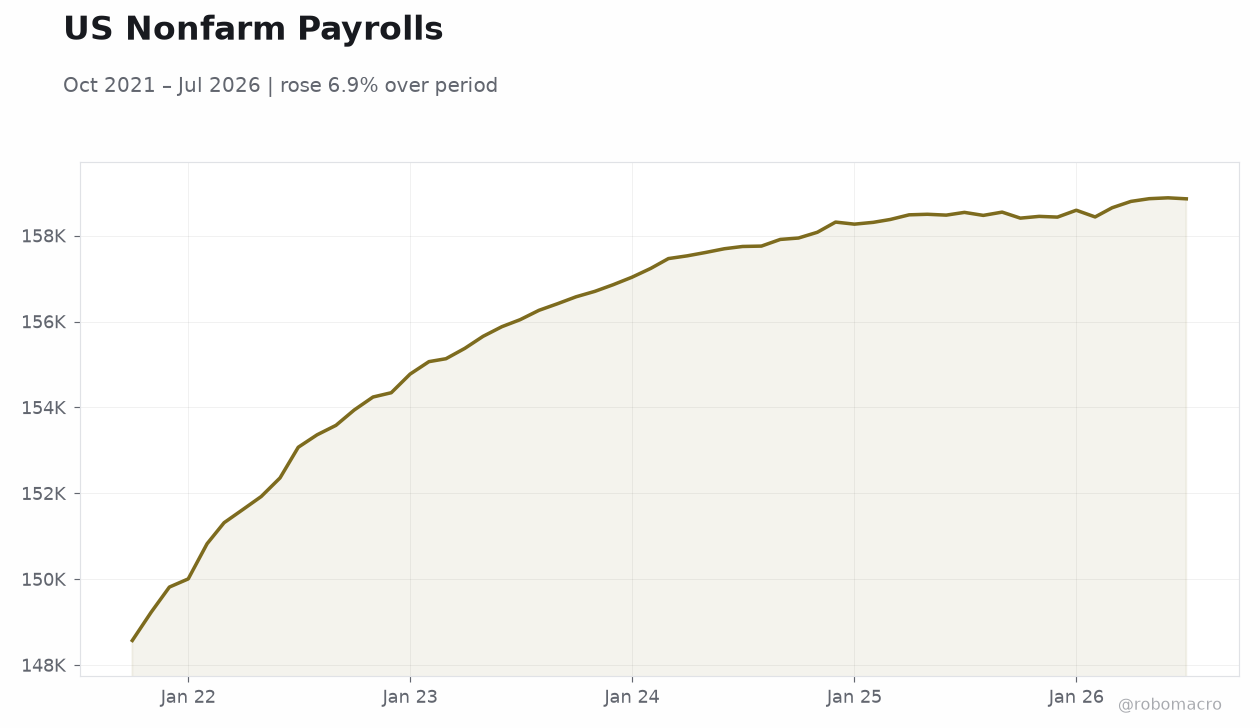
- JOLTs job openings edged lower to 7.271 million, tempering labor market strength ahead of ADP payrolls data.
Yesterday's Recap
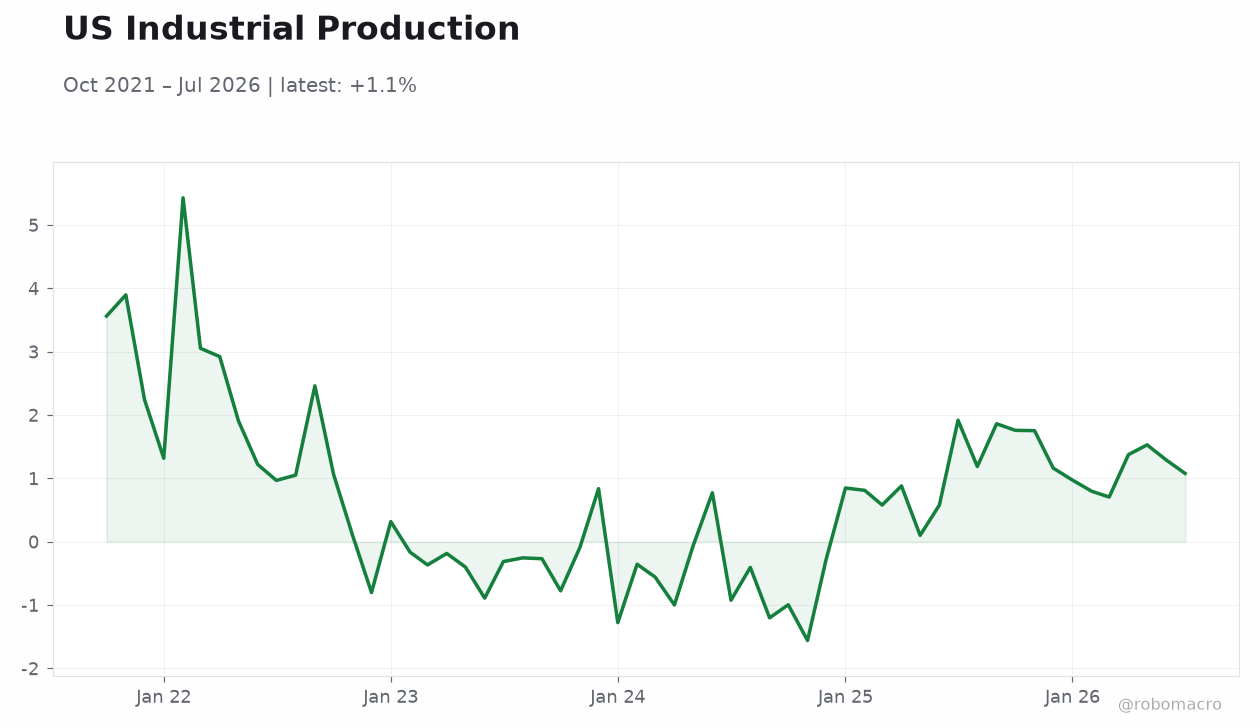
US data releases showed manufacturing momentum easing. The ISM Manufacturing PMI dropped to 54.6 from 55.6, with the employment sub-index falling to 51.2. Dallas Fed Manufacturing Index rose sharply to 11.6.
JOLTs job openings came in at 7.271 million versus 7.3 million expected. Equity markets reacted negatively, with the Dow Jones declining 0.79% to 52,766.88 and Russell 2000 falling 1.23%. Treasury yields climbed, pushing the 10-year note to 4.75%.
Oil prices edged higher to 90.41 amid supply concerns. The USD/JPY pair held near 159.90. API crude stocks fell 2.6 million barrels, exceeding the expected draw and adding to energy-market tightness.
These prints reinforced a picture of cooling factory activity while labor demand remained resilient enough to limit immediate rate-cut expectations.
The Day Ahead
ADP Employment Change is due at 4:15 ET with consensus at 47,000. Factory Orders are expected to rise 0.7% month-over-month. EIA crude and gasoline inventory reports follow at 6:30 ET.
Thursday brings Exports and Imports levels plus a speech by Fed's Waller. Markets will monitor these releases for labor and trade signals. Oil inventory draws could influence energy prices and inflation views.
No major FOMC speakers are scheduled until later in the week. The combination of ADP and trade data will help gauge whether recent softness in manufacturing is spreading to broader demand or remains contained.
Other Economic Notes
US GDP growth stood at 1.50% QoQ SAAR and 2.10% YoY in the latest reading. Retail sales expanded 5.01% YoY, supporting consumer resilience. Unemployment held at 4.10% while CPI inflation registered 3.30% YoY.
The Fed Funds rate sits at 3.63%. Elevated oil prices near 90.41 add to price pressures. Treasury 2-year yields remained at 4.34%, reflecting steady policy expectations.
<i>↓ p.2</i>