US Macro Daily(Beta Mode)
Equities Advance Ahead of Fed Decision
Market Snapshot
| Asset | Level | Change |
|---|---|---|
| S&P 500 | 7,656.98 | +0.86% |
| Nasdaq 100 | 29,368.44 | +0.91% |
| Dow Jones | 52,573.29 | +0.98% |
| Russell 2000 | 2,903.94 | +0.45% |
| USD/JPY | 154.54 | +0.04% |
| EUR/USD | 1.15 | -0.55% |
| GBP/USD | 1.35 | -0.14% |
| Gold | 4,332.20 | -0.78% |
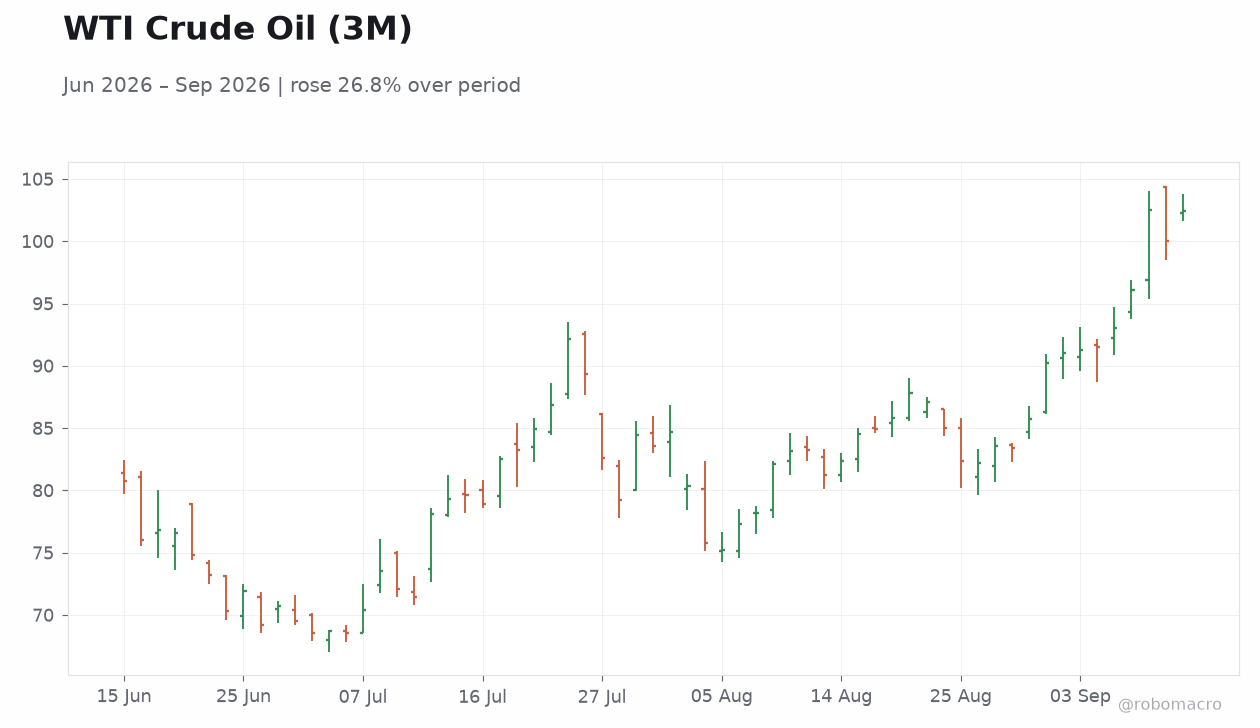
| WTI Crude | 102.43 | +2.38% |
| Bitcoin | 77,789.58 | +1.24% |
| US 2Y Treasury | 4.56% | +2.93% |
| US 10Y Treasury | 4.95% | +2.48% |
Prior Economic Events
| Data | Prior | Cons | Actual |
|---|---|---|---|
| No events available | |||
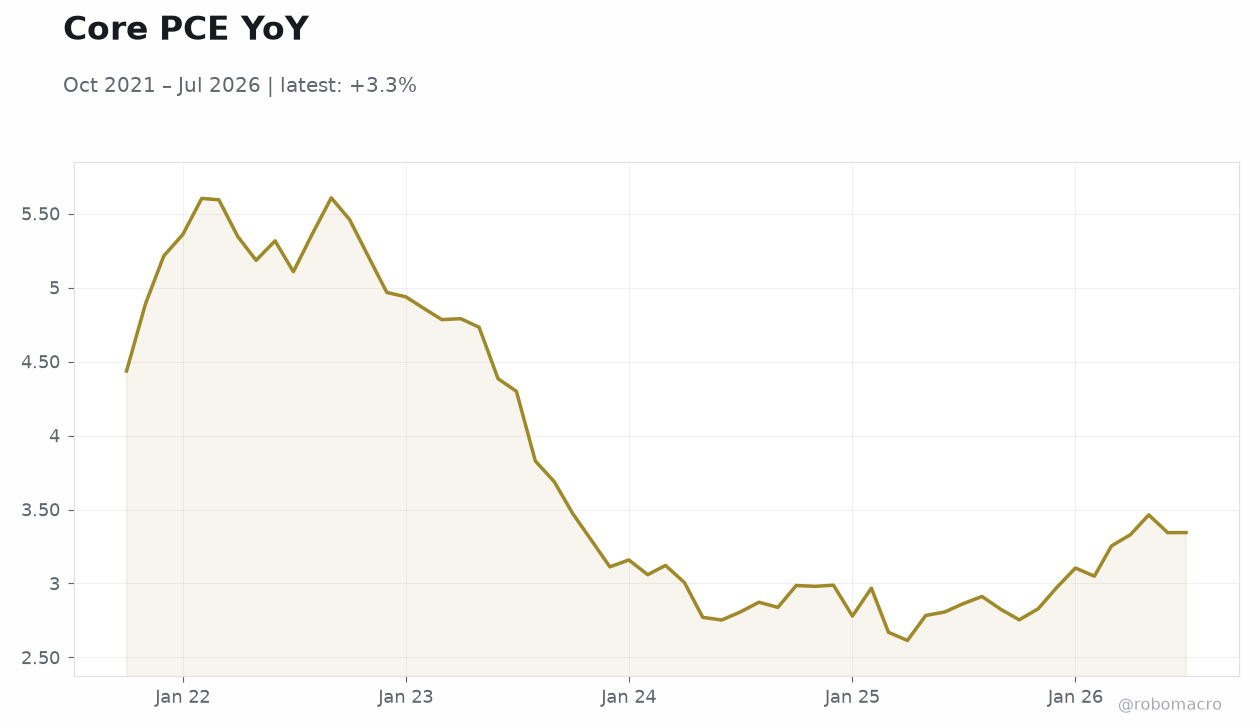 Core PCE YoY | Type: macro_line | Index: 3.344 (2026-07-01) | Range: 2.615–5.606 | Trend(6pt): 4.437,4.967,3.059,2.615,3.344,3.344
Today's Economic Events
| Data | Prior | Cons | Time |
|---|---|---|---|
| Tuesday (2026-09-15) | |||
| ADP Employment Change Weekly | 12,000 | - | 04:15 |
| NY Empire State Manufacturing Index | 20.60 | 15 | 04:30 |
| API Weekly Crude Oil Stocks | -300,000 | - | 12:30 |
| Wednesday (2026-09-16) | |||
| MBA 30-Year Mortgage Rate | 6.85 | - | 03:00 |
| Retail Sales Month-over-Month | -0.60 | 0.90 | 04:30 |
| Export Prices Month-over-Month | -1.30 | - | 04:30 |
| Import Prices Month-over-Month | -0.40 | 0.20 | 04:30 |
| Retail Sales Control Group Month-over-Month | -0.40 | - | 04:30 |
- Equities posted broad gains with S&P 500 rising 0.86% to 7,656.98 as investors positioned for the FOMC meeting.
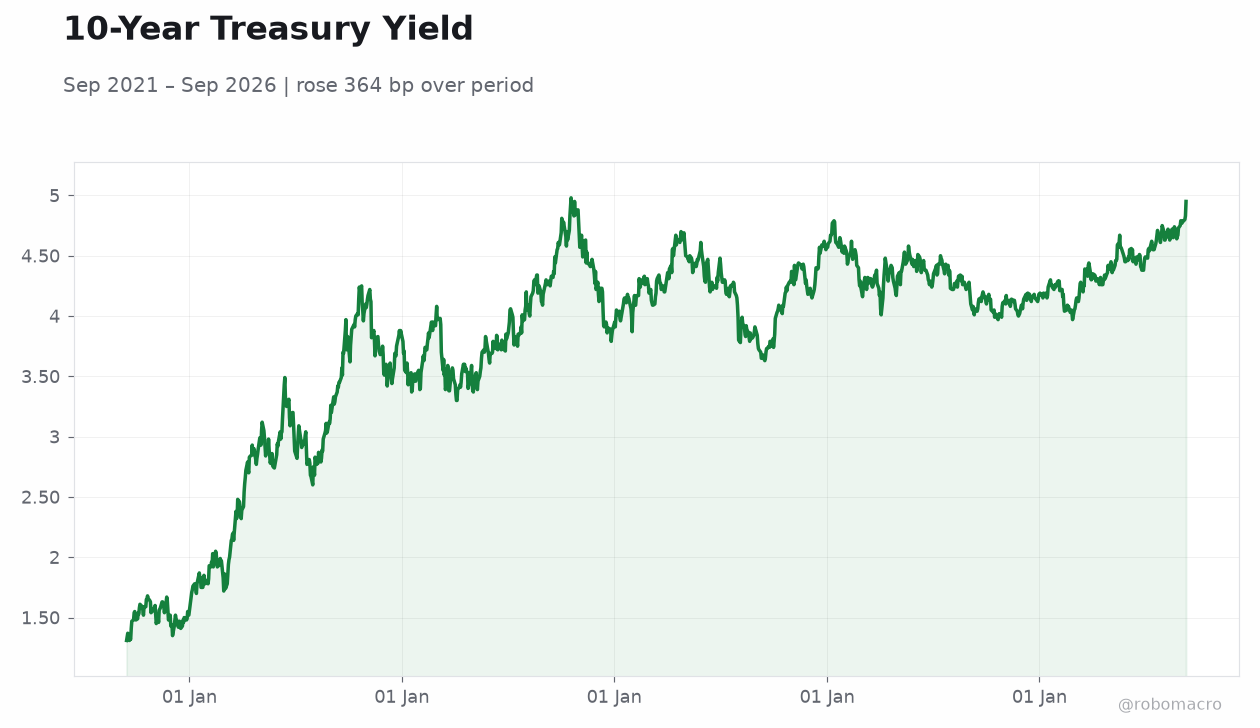
- Treasury yields climbed sharply, with the 2-year reaching 4.56% and the 10-year at 4.95%, reflecting higher rate-hike odds.
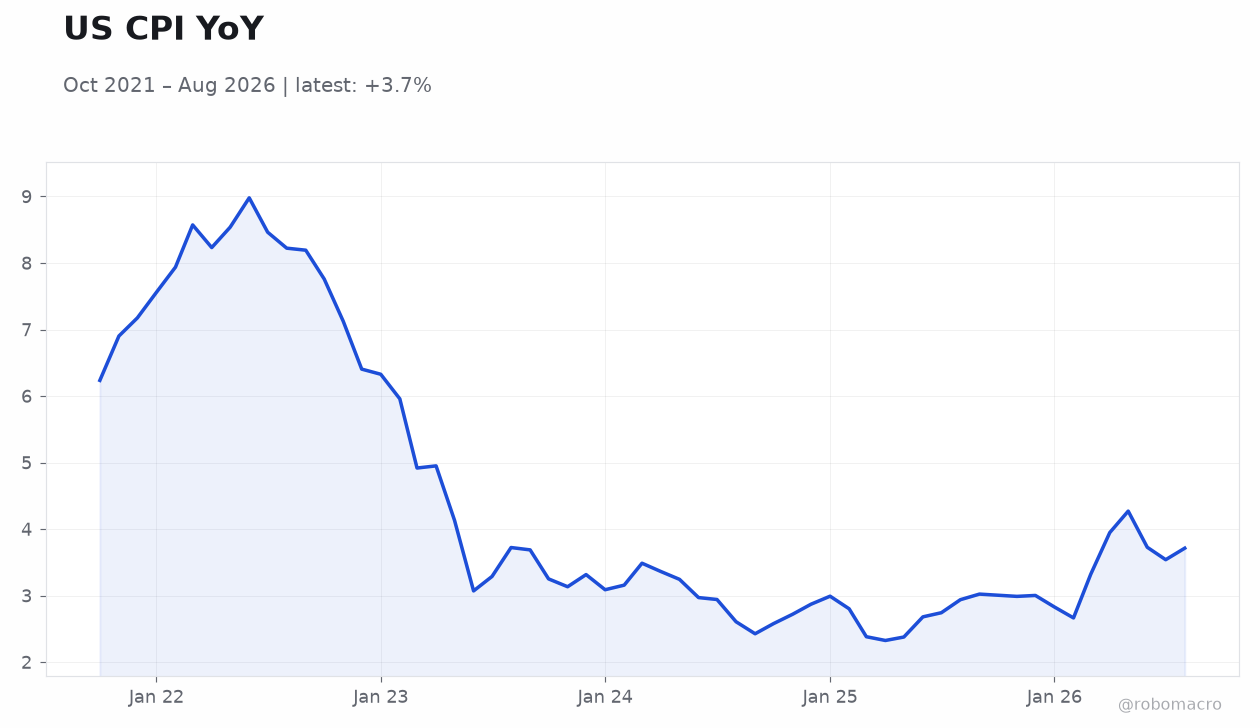
- August CPI held at 3.40% YoY, keeping pressure on the Fed to tighten policy further at the September 16 decision.
Yesterday's Recap
US markets recorded no economic data releases on September 13. Equity indices advanced across the board, led by the Dow Jones which gained 0.98% to 52,573.29 while the Nasdaq 100 rose 0.91% to 29,368.44. The Russell 2000 added 0.45% to 2,903.94.
Treasury yields increased notably, with the 2-year yield climbing 2.93% to 4.56% and the 10-year yield rising 2.48% to 4.95%. WTI Crude jumped 2.38% to 102.43 while gold declined 0.78% to 4,332.20. EUR/USD fell 0.55% to 1.15 and USD/JPY edged 0.04% higher to 154.54.
Bitcoin gained 1.24% to 77,789.58 amid the risk-on tone.
The Day Ahead
Attention turns to Tuesday’s ADP Employment Change and NY Empire State Manufacturing Index, which will provide early labor and regional activity signals. Wednesday brings the critical Retail Sales report, with consensus calling for a 0.9% month-over-month rebound after the prior -0.6% print, alongside import and export price data. Business Inventories, NAHB Housing Market Index, and EIA crude inventories will round out the morning releases.
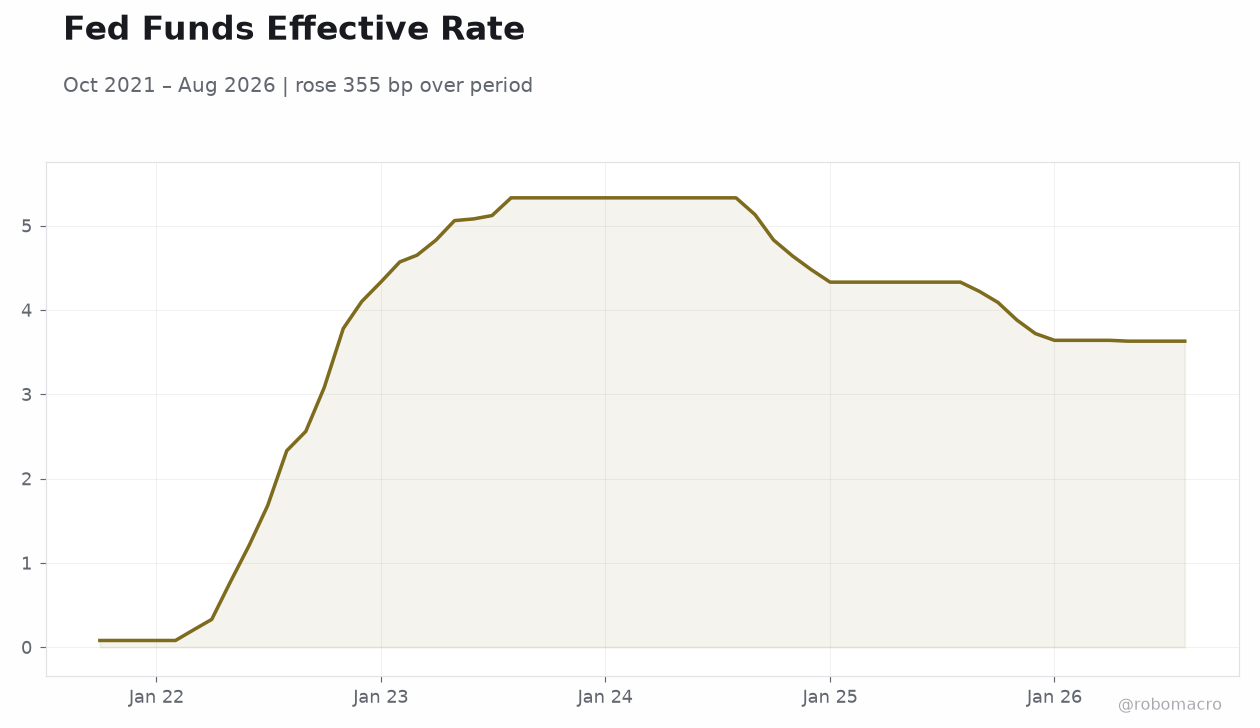
The FOMC interest-rate decision, economic projections, and Chair press conference represent the dominant market-moving events, with pricing now favoring a 25 basis point hike. Markets will scrutinize any updates to the dot plot and forward guidance for signals on the terminal rate path.
Other Economic Notes
Persistent inflation at 3.40% YoY continues to anchor expectations for further policy tightening despite GDP growth slowing to a 1.50% annualized pace in the latest reading. Retail sales momentum remains solid at 5.01% year-over-year, supporting the view that consumer demand can withstand higher rates. Unemployment at 4.10% shows labor-market resilience that reduces the urgency for easing.
Rising 2-year and 10-year yields reflect markets embedding a higher-for-longer stance, which could pressure housing and capex if sustained. Broader equity strength suggests investors continue to price a soft-landing outcome even as the Fed signals resolve on inflation.