US Macro Daily(Beta Mode)
Oil Surge Lifts Yields Ahead of FOMC
Market Snapshot
| Asset | Level | Change |
|---|---|---|
| S&P 500 | 7,586.66 | -0.44% |
| Nasdaq 100 | 28,982.96 | -0.50% |
| Dow Jones | 51,980.90 | -0.84% |
| Russell 2000 | 2,865.29 | -0.93% |
| USD/JPY | 155.13 | +1.11% |
| EUR/USD | 1.15 | -0.44% |
| GBP/USD | 1.35 | -0.35% |
| Gold | 4,346.60 | -0.12% |
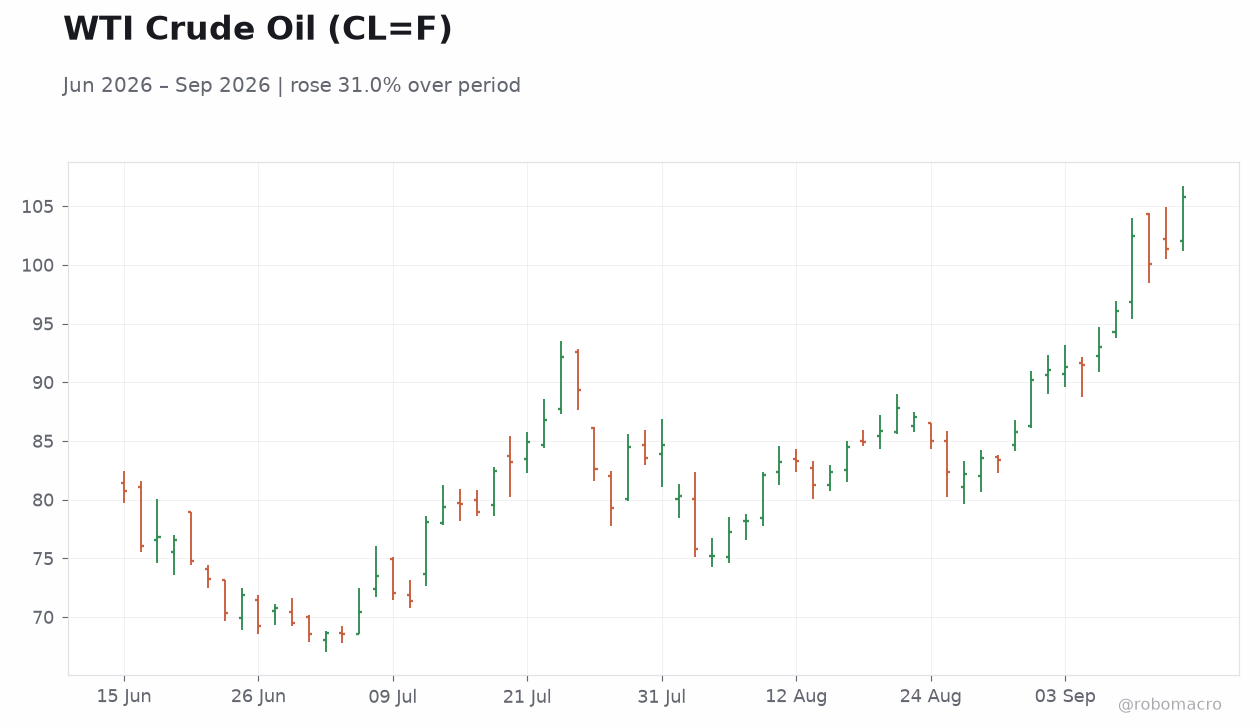
| WTI Crude | 105.72 | +4.27% |
| Bitcoin | 76,602.02 | -2.00% |
| US 2Y Treasury | 4.65% | +2 bp |
| US 10Y Treasury | 4.97% | +1 bp |
Prior Economic Events
| Data | Prior | Cons | Actual |
|---|---|---|---|
| ADP Employment Change Weekly | 12,250 | - | 16,250 |
| NY Empire State Manufacturing Index | 20.60 | 14.75 | - |
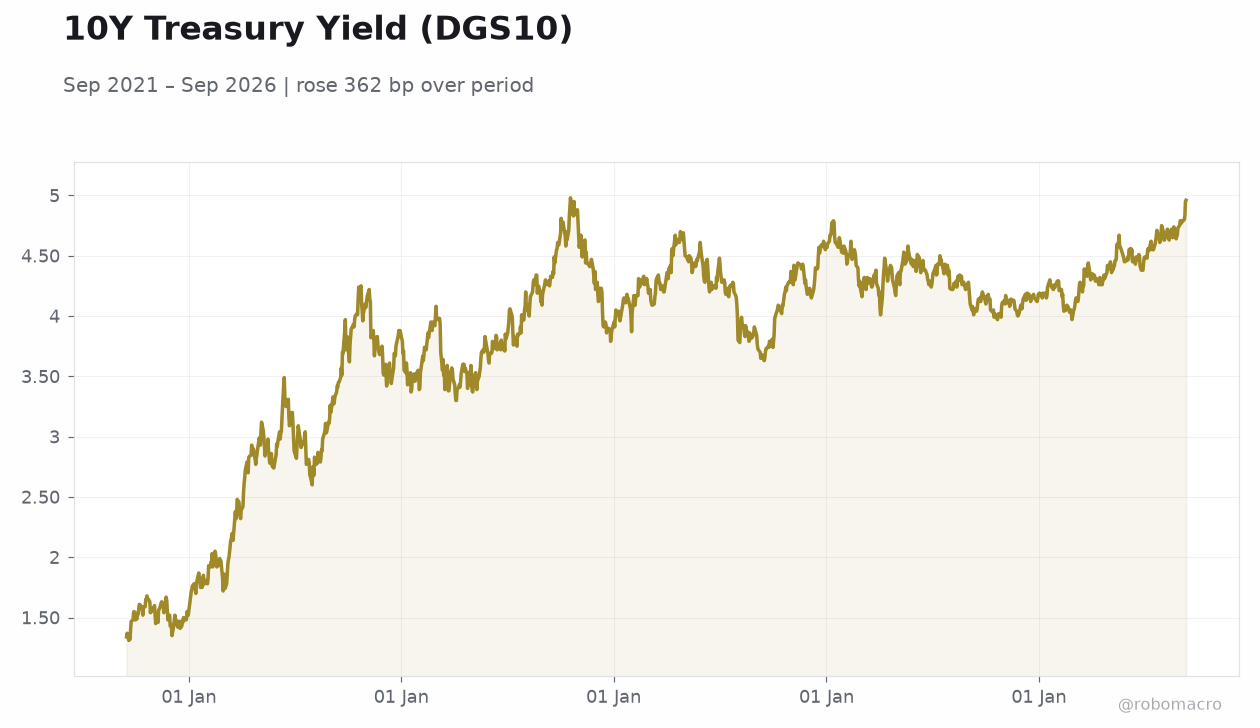 10Y Treasury Yield (DGS10) | Type: macro_line | Yield %: 4.96 (2026-09-11) | Range: 1.31–4.98 | Trend(6pt): 1.34,3.44,4.29,4.36,4.95,4.96
Today's Economic Events
| Data | Prior | Cons | Time |
|---|---|---|---|
| API Weekly Crude Oil Stocks | -300,000 | - | 12:30 |
| Wednesday (2026-09-16) | |||
| MBA 30-Year Mortgage Rate | 6.85 | - | 03:00 |
| Retail Sales Month-over-Month | -0.60 | 0.90 | 04:30 |
| Export Prices Month-over-Month | -1.30 | 0.50 | 04:30 |
| Import Prices Month-over-Month | -0.40 | 0.40 | 04:30 |
| Retail Sales Control Group Month-over-Month | -0.40 | 0.40 | 04:30 |
| Retail Sales excluding Autos Month-over-Month | -0.30 | 0.60 | 04:30 |
| Business Inventories Month-over-Month | 0 | 0.80 | 06:00 |
| NAHB Housing Market Index | 35 | 34 | 06:00 |
- Equities decline as oil jumps over 4%
- 10-year yield reaches 4.97%
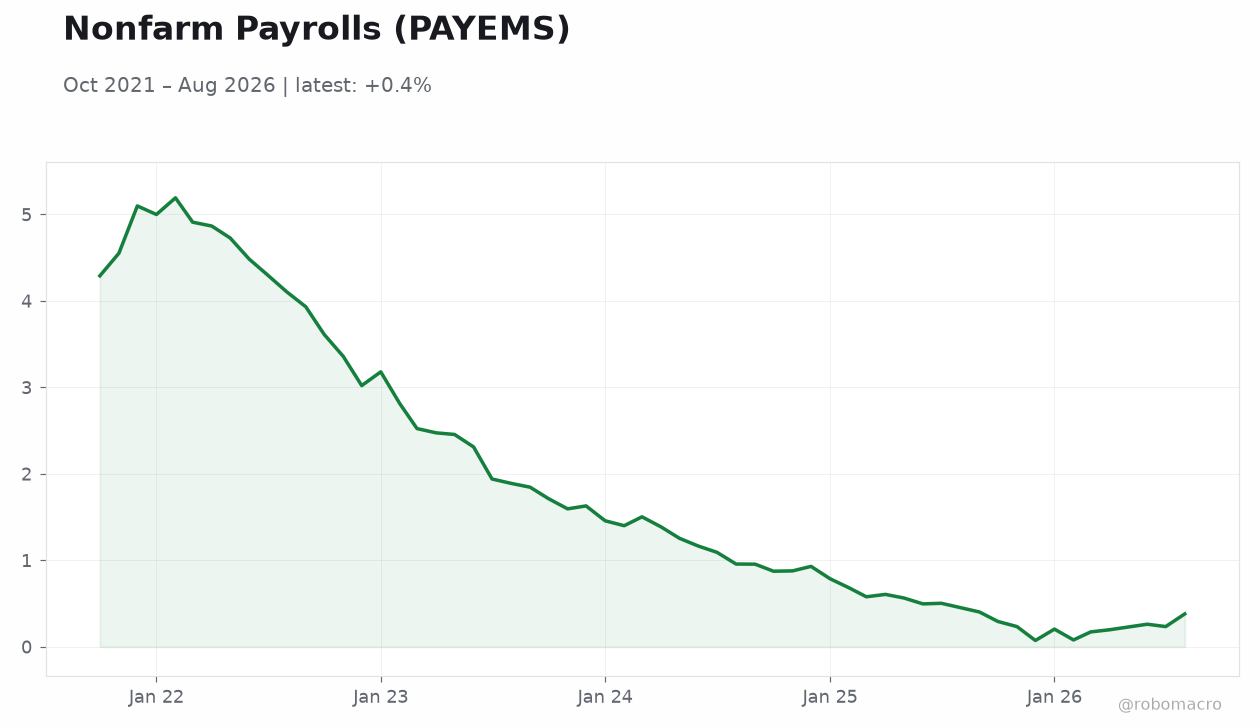
- ADP employment beats prior reading
Yesterday's Recap
US equity indices closed lower on September 14 amid rising oil prices and Treasury yields. The S&P 500 fell 0.44% to 7,586.66 while the Nasdaq 100 declined 0.50% to 28,982.96. The Dow Jones dropped 0.84% to 51,980.90 and the Russell 2000 fell 0.93% to 2,865.29.
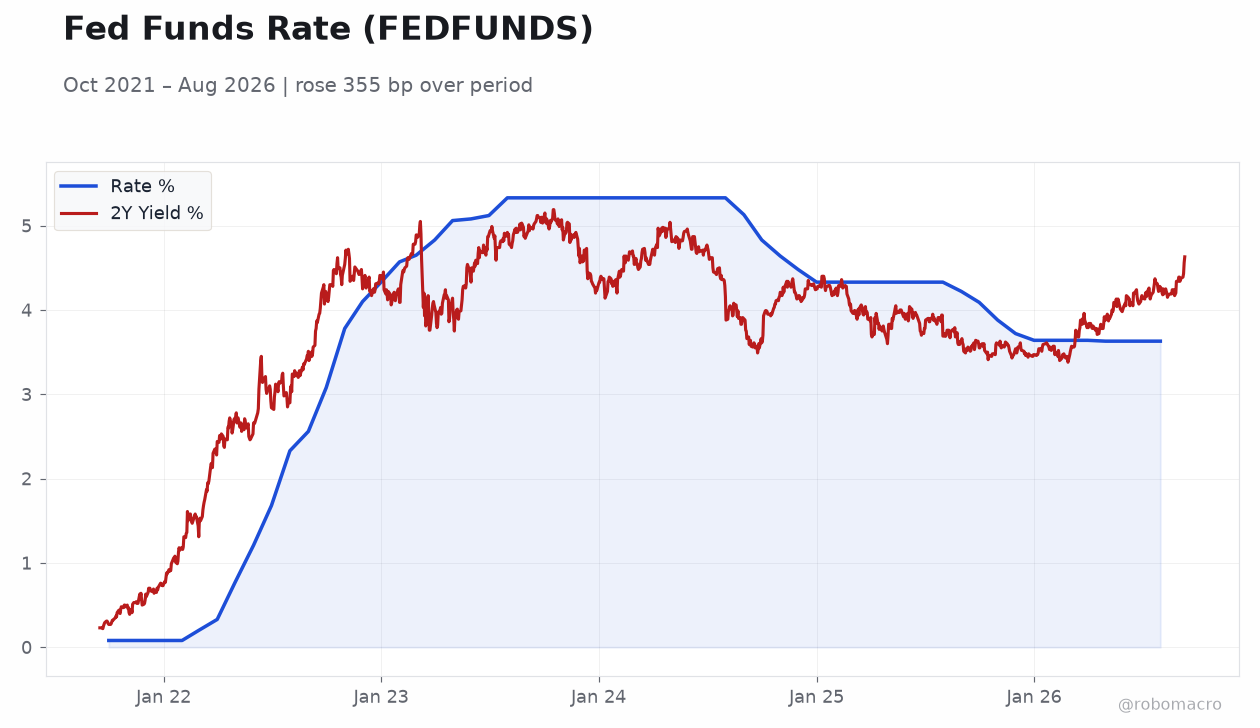
WTI Crude rose 4.27% to 105.72 as Gulf supply concerns intensified. The 2-year Treasury yield increased 2 bp to 4.65% and the 10-year yield rose 1 bp to 4.97%. USD/JPY advanced 1.11% to 155.13 while EUR/USD slipped 0.44% to 1.15.
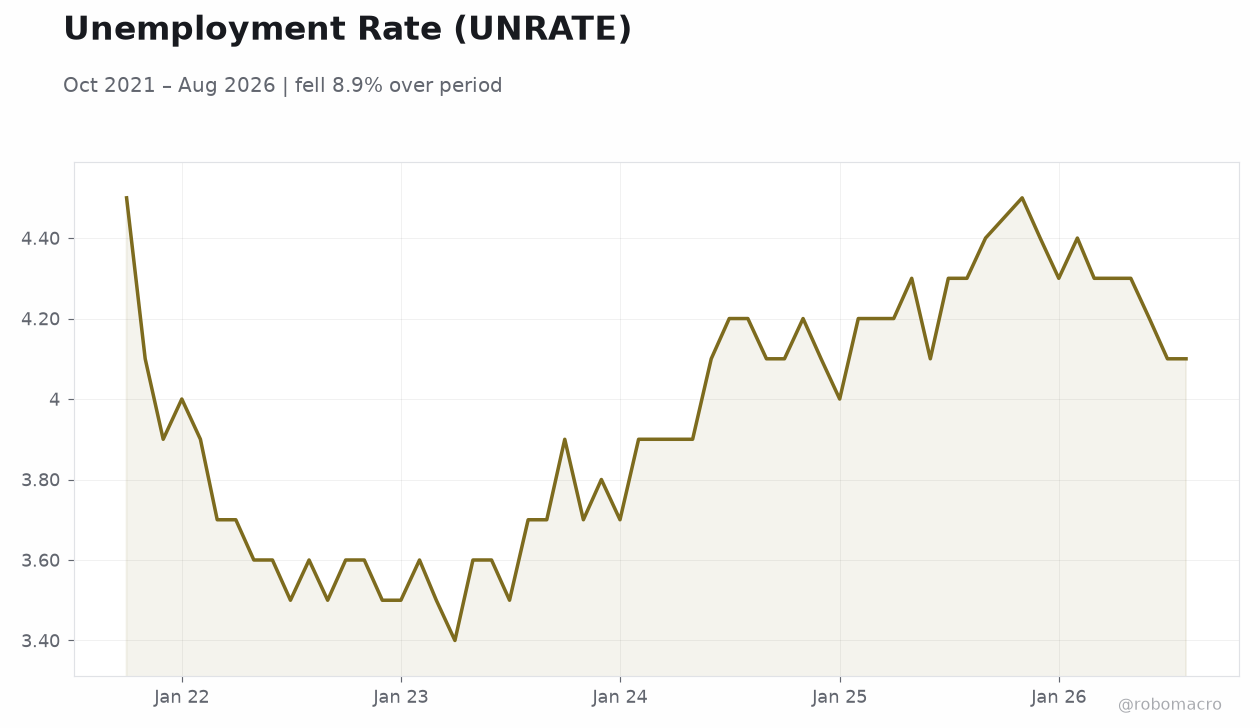
ADP Employment Change printed 16,250 versus the prior 12,250; the NY Empire State Manufacturing Index showed no new reading against a consensus of 14.75. US GDP grew 2.10% year-over-year in the latest reading with a 1.50% annualized quarterly pace. CPI inflation stands at 3.40% year-over-year while unemployment holds at 4.10%.
Retail sales expanded 5.01% over the past year, supporting consumer resilience.
The Day Ahead
High-impact US data on September 16 include Retail Sales MoM with a consensus of +0.9% after a -0.6% prior. Retail Sales excluding Autos are expected at +0.6% and the Control Group at +0.4%. Export Prices MoM are forecast at +0.5% and Import Prices at +0.4%.
The FOMC will release updated economic projections and the policy decision at 10:00 ET, followed by the press conference. Additional releases cover MBA 30-year mortgage rates, NAHB Housing Market Index, Business Inventories, and EIA crude and gasoline inventories. Markets will focus on any shifts in the Fed’s growth and inflation outlook.
Persistent energy price gains add upside risk to near-term inflation prints.
Other Economic Notes
US-Canada trade tensions escalated with President Trump’s tariffs on Canadian imports prompting retaliatory measures that are affecting key sectors in several Republican-leaning states. The United Steelworkers union plans to address the issue. Trade frictions with Canada over tariffs are weighing on manufacturing supply chains in several states.
Gulf states have halted Hormuz-related talks while Saudi Arabia conducted strikes on Houthi targets, pushing Brent above $105. Peru is seeking US tariff relief through diplomatic channels. ↓ p.2