US Macro Daily(Beta Mode)
Fed Decision Looms Over Retail Sales Data
Market Snapshot
| Asset | Level | Change |
|---|---|---|
| S&P 500 | 7,585.73 | -0.45% |
| Nasdaq 100 | 28,937.84 | -0.65% |
| Dow Jones | 52,093.11 | -0.63% |
| Russell 2000 | 2,870.29 | -0.76% |
| USD/JPY | 155.11 | +0.47% |
| EUR/USD | 1.15 | -0.07% |
| GBP/USD | 1.35 | -0.21% |
| Gold | 4,388.10 | +1.28% |
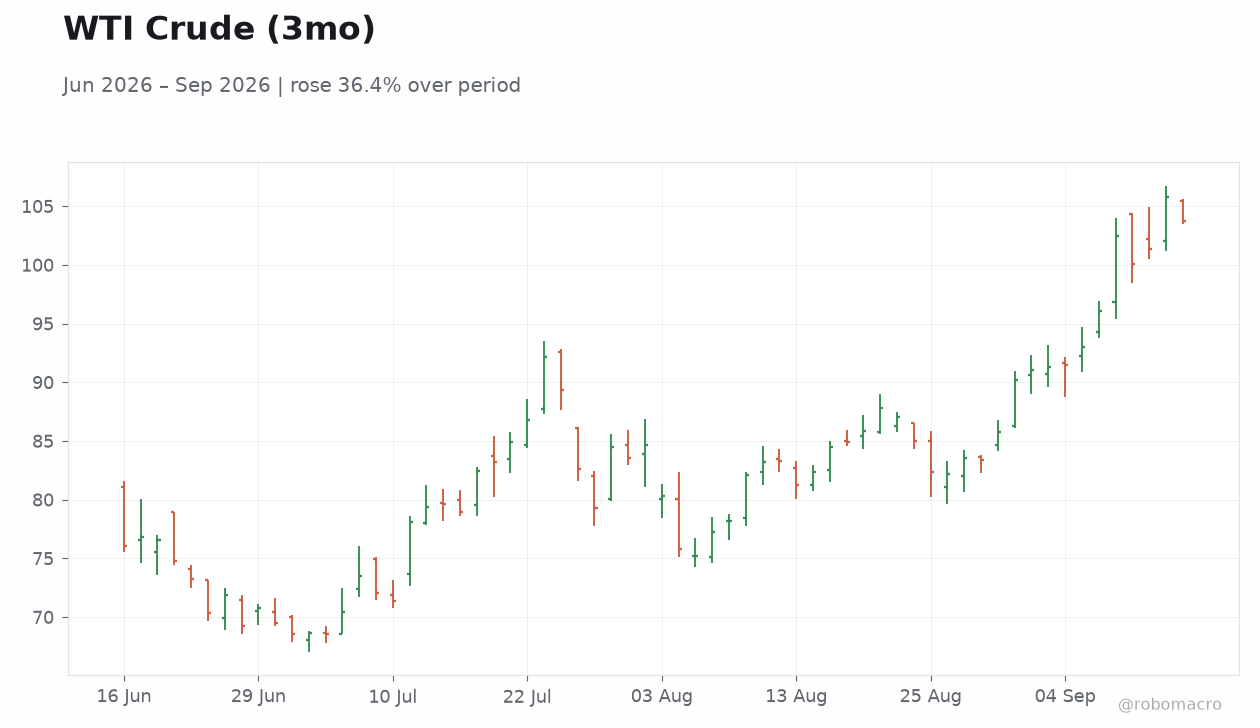
| WTI Crude | 103.65 | -2.06% |
| Bitcoin | 75,974.29 | +0.48% |
| US 2Y Treasury | 4.67% | +2 bp |
| US 10Y Treasury | 5.00% | +3 bp |
Prior Economic Events
| Data | Prior | Cons | Actual |
|---|---|---|---|
| ADP Employment Change Weekly | 12,250 | - | 16,250 |
| NY Empire State Manufacturing Index | 20.60 | 14.75 | 7.60 |
| API Weekly Crude Oil Stocks | -300,000 | -1.8m | 7.1m |
| MBA 30-Year Mortgage Rate | 6.85 | - | - |
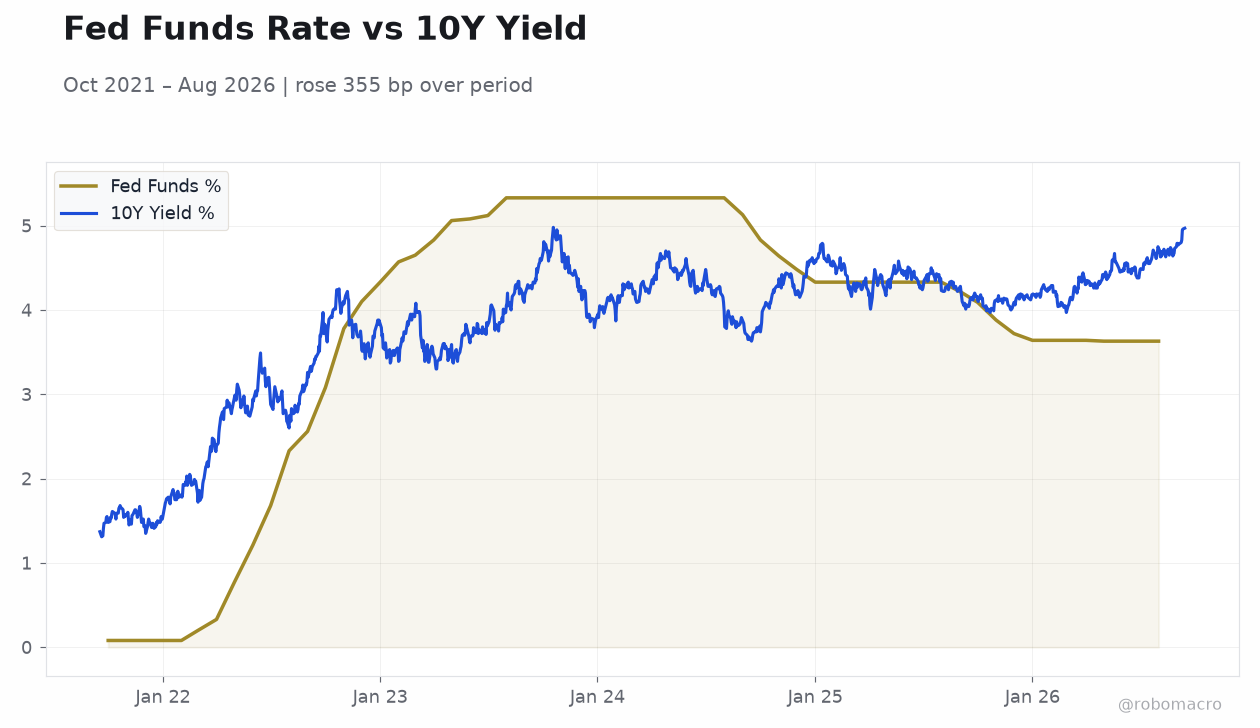 Fed Funds Rate vs 10Y Yield | Type: macro_line | Fed Funds %: 3.63 (2026-08-01) | Range: 0.08–5.33 | Trend(5pt): 0.08,4.1,5.33,4.33,3.63 | 10Y Yield %: 4.97 (2026-09-14) | Range: 1.31–4.98 | Trend(6pt): 1.37,3.48,4.31,4.41,4.96,4.97
Today's Economic Events
| Data | Prior | Cons | Time |
|---|---|---|---|
| Retail Sales Month-over-Month | -0.60 | 0.80 | 04:30 |
| Export Prices Month-over-Month | -1.30 | 0.50 | 04:30 |
| Import Prices Month-over-Month | -0.40 | 0.40 | 04:30 |
| Retail Sales Control Group Month-over-Month | -0.40 | 0.40 | 04:30 |
| Retail Sales excluding Autos Month-over-Month | -0.30 | 0.50 | 04:30 |
| Business Inventories Month-over-Month | 0 | 0.30 | 06:00 |
| NAHB Housing Market Index | 35 | 34 | 06:00 |
| EIA Weekly Crude Oil Inventory | -391,000 | -1.6m | 06:30 |
| EIA Weekly Gasoline Inventory | 1.3m | -1m | 06:30 |
| FOMC Economic Projections Level | - | - | 10:00 |
- Equities fell and yields rose ahead of the FOMC decision
- NY Empire State manufacturing index plunged below consensus
- API crude stocks posted a large surprise build
Yesterday's Recap
Equities declined across major indices on September 15, with the S&P 500 falling 0.45 percent to 7,585.73, the Nasdaq 100 dropping 0.65 percent to 28,937.84, the Dow Jones declining 0.63 percent to 52,093.11, and the Russell 2000 slipping 0.76 percent to 2,870.29. Treasury yields climbed, pushing the 2-year yield to 4.67 percent after a 2 basis point increase and the 10-year yield to 5.00 percent after a 3 basis point rise. The dollar strengthened against the yen, lifting USD/JPY to 155.11, while EUR/USD eased to 1.15 and GBP/USD fell to 1.35.
Gold advanced 1.28 percent to 4,388.10 as WTI crude dropped 2.06 percent to 103.65. ADP Employment Change printed at 16,250, above the prior 12,250 reading. The NY Empire State Manufacturing Index collapsed to 7.60, missing the 14.75 consensus and prior 20.60 level.
API Weekly Crude Oil Stocks surprised with a 7.14 million barrel build against an expected 1.8 million barrel draw.
The Day Ahead
Retail Sales Month-over-Month headline data are scheduled for release at 4:30 a.m. ET with a consensus of 0.8 percent following the prior minus 0.6 percent print. Export Prices, Import Prices, Retail Sales excluding Autos, and the Retail Sales Control Group are also due at the same time.
Business Inventories and the NAHB Housing Market Index follow at 6:00 a.m. ET. EIA crude and gasoline inventory figures arrive at 6:30 a.m.
ET. The FOMC Interest Rate Decision, economic projections, and press conference at 10:00 a.m. ET represent the dominant market-moving events, with markets pricing in a rate increase to 4.00 percent from the prevailing 3.63 percent level.
Other Economic Notes
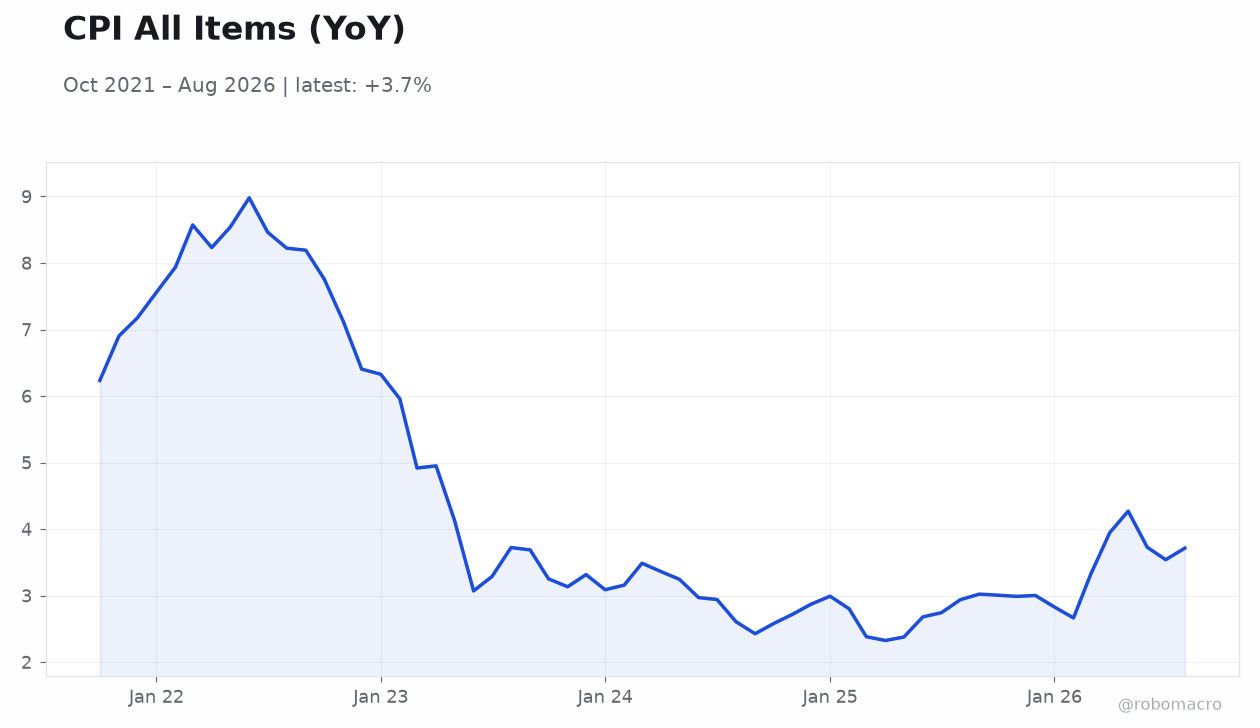
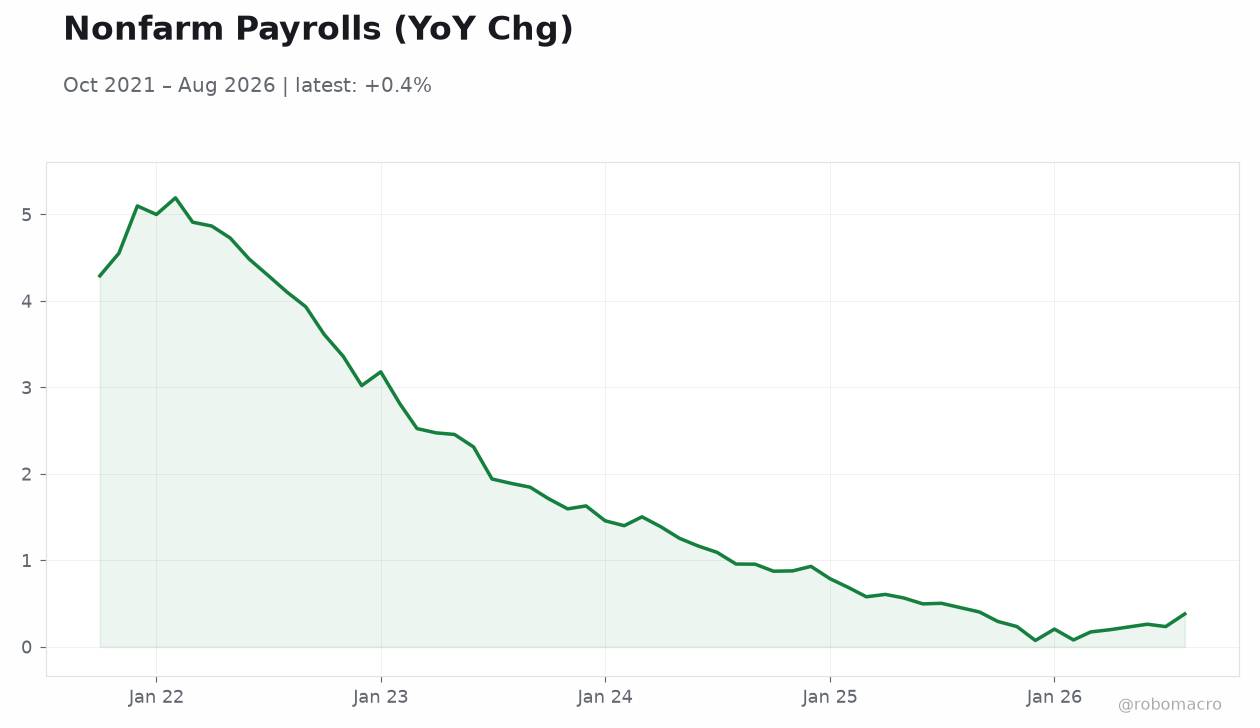
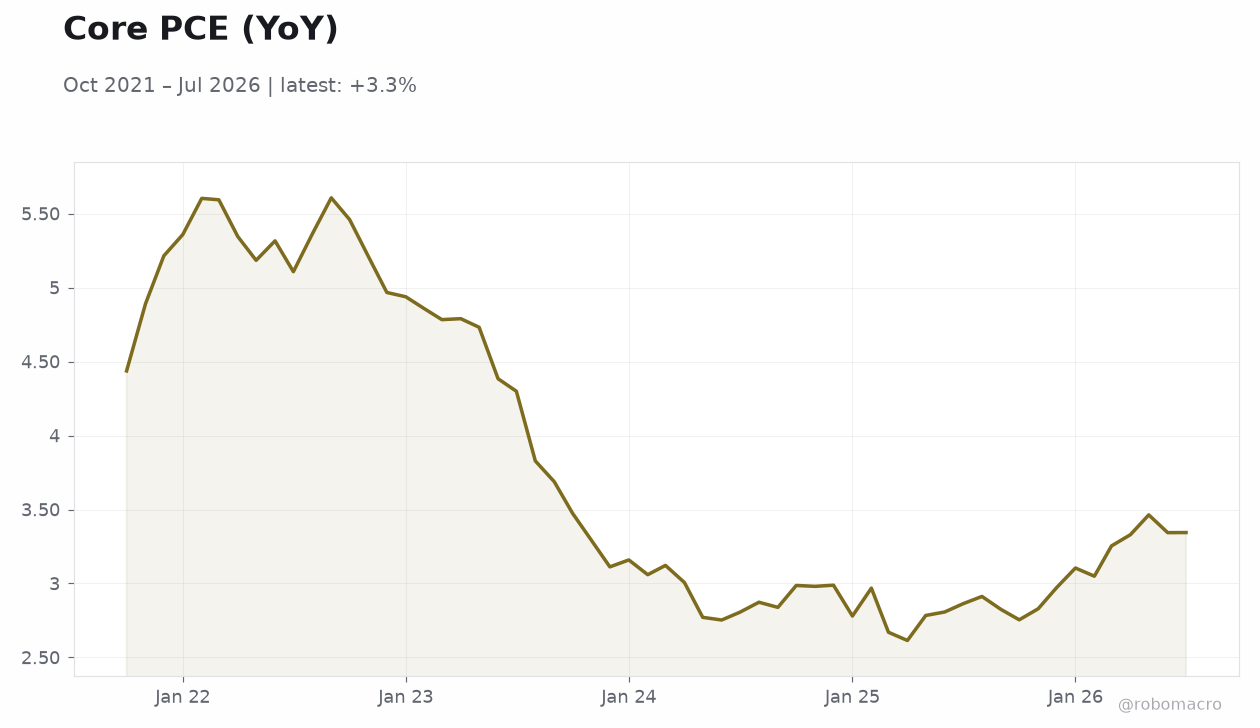
Softer manufacturing survey results and the unexpected crude inventory build have not shifted the market focus from the upcoming policy decision. Treasury yields near 5.00 percent on the 10-year reflect persistent inflation concerns despite US CPI YoY at 3.40 percent and unemployment at 4.10 percent. GDP growth figures remain modest, with the latest QoQ SAAR at 1.50 percent and YoY at 2.10 percent, while Retail Sales YoY stand at 5.01 percent.
These data points underscore a resilient but slowing expansion that the Federal Reserve must balance against price pressures.