US Macro Daily(Beta Mode)
Fed Raises Rates to 4% on Retail Sales Beat
Market Snapshot
| Asset | Level | Change |
|---|---|---|
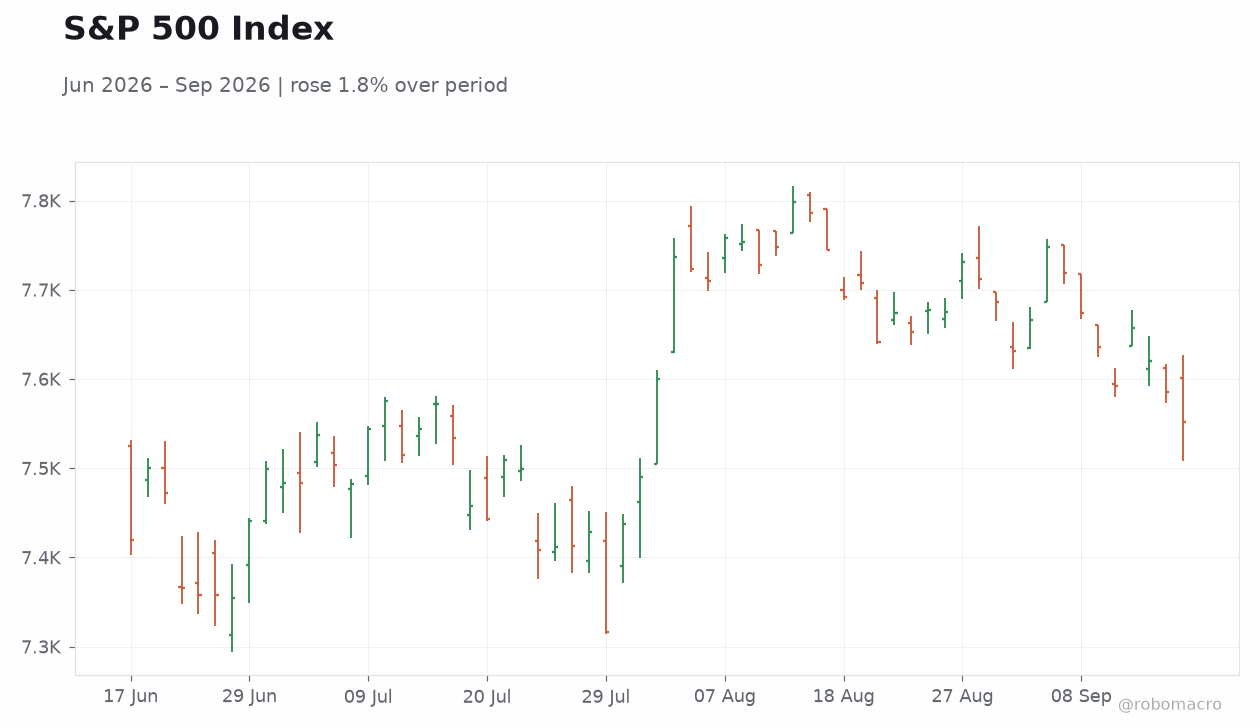
| S&P 500 | 7,551.81 | -0.45% |
| Nasdaq 100 | 28,945.06 | +0.02% |
| Dow Jones | 51,461.90 | -1.21% |
| Russell 2000 | 2,858.81 | -0.40% |
| USD/JPY | 155.68 | +0.27% |
| EUR/USD | 1.15 | -0.49% |
| GBP/USD | 1.34 | -0.74% |
| Gold | 4,361.00 | -0.60% |
| WTI Crude | 100.86 | -1.53% |
| Bitcoin | 76,327.13 | +0.23% |
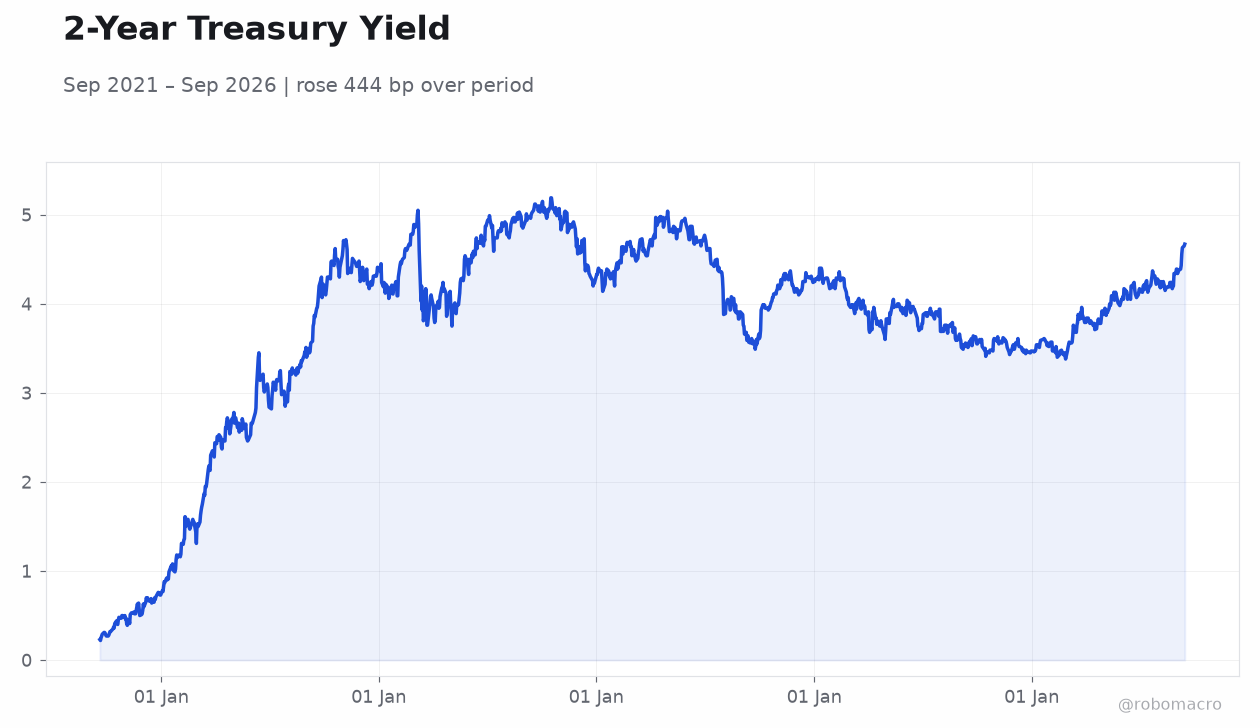
| US 2Y Treasury | 4.74% | +7 bp |
| US 10Y Treasury | 5.01% | +1 bp |
Prior Economic Events
| Data | Prior | Cons | Actual |
|---|---|---|---|
| ADP Employment Change Weekly | 12,250 | - | 16,250 |
| NY Empire State Manufacturing Index | 20.60 | 14.75 | 7.60 |
| API Weekly Crude Oil Stocks | -300,000 | -1.8m | 7.1m |
| MBA 30-Year Mortgage Rate | 6.85 | - | 6.97 |
| Retail Sales Month-over-Month | -0.50 | 0.80 | 1.20 |
| Export Prices Month-over-Month | -1.40 | 0.50 | 0.60 |
| Import Prices Month-over-Month | -0.30 | 0.40 | 0.70 |
| Retail Sales Control Group Month-over-Month | -0.40 | 0.40 | 1.40 |
| Retail Sales excluding Autos Month-over-Month | -0.20 | 0.50 | 1.40 |
| Business Inventories Month-over-Month | 0.10 | 0.30 | 0.80 |
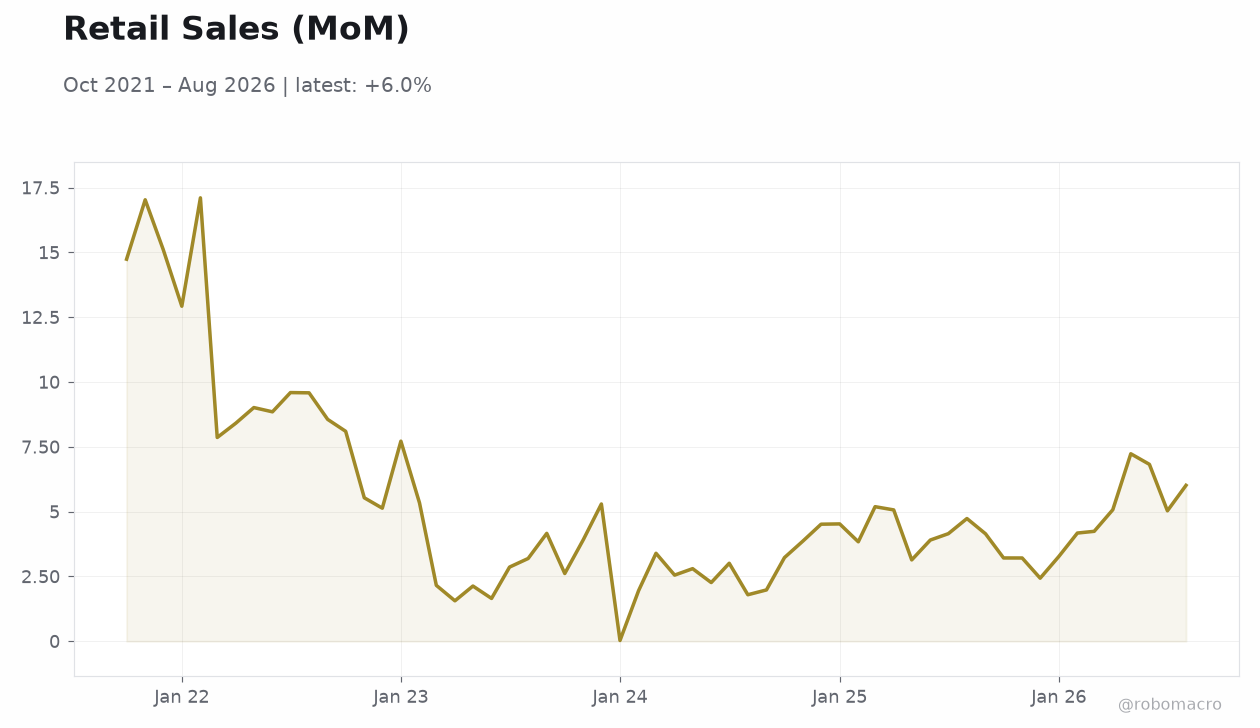 Retail Sales (MoM) | Type: macro_line | YoY %: 6.015 (2026-08-01) | Range: 0.02984–17.11 | Trend(6pt): 14.74,5.134,1.953,5.067,6.825,6.015
Today's Economic Events
| Data | Prior | Cons | Time |
|---|---|---|---|
| Building Permits Preliminary | 1.4m | 1.4m | 04:30 |
| Housing Starts Level | 1.2m | 1.3m | 04:30 |
| Building Permits Month-over-Month Preliminary | 4.30 | - | 04:30 |
| Housing Starts Month-over-Month | -12.40 | - | 04:30 |
| Philadelphia Fed Manufacturing Index | 47.40 | 30.50 | 04:30 |
| Weekly Jobless Claims | 206,000 | 208,000 | 04:30 |
| Pending Home Sales Month-over-Month | -2.30 | 2 | 06:00 |
| Pending Home Sales Year-over-Year | -2.20 | - | 06:00 |
- Retail sales jumped 1.2% MoM, beating consensus 0.8%, with control group and ex-autos both rising 1.4%.
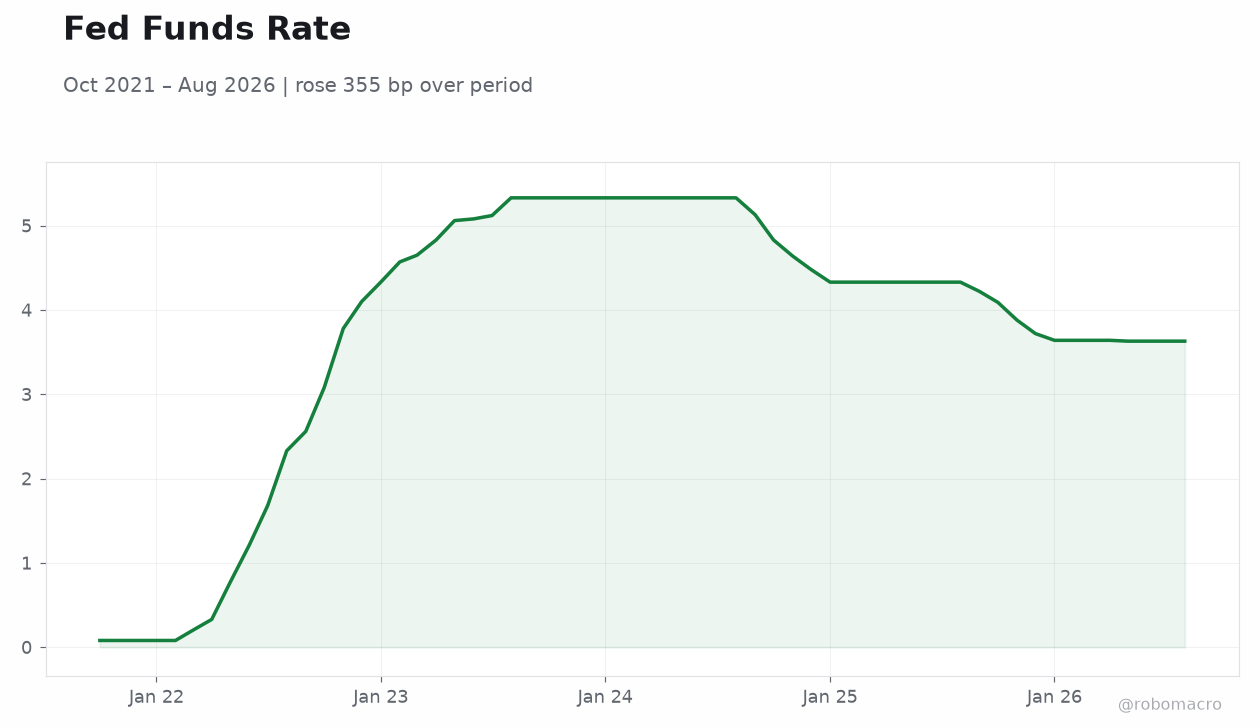
- FOMC raised policy rate to 4.00% and released fresh projections, lifting 2-year yield 7 bp to 4.74%.
- Equities fell, with S&P 500 down 0.45% and Dow Jones off 1.21%, while WTI crude slipped 1.53%.
Yesterday's Recap
Retail sales posted a sharp 1.2% MoM gain against an 0.8% consensus, while the control group advanced 1.4% and sales excluding autos also rose 1.4%. Export prices increased 0.6% and import prices climbed 0.7%, both exceeding forecasts. The FOMC lifted the policy rate to 4.00% from 3.75% and published updated economic projections.
The NAHB Housing Market Index fell to 32 from 35, and business inventories rose 0.8%. EIA data showed crude stocks down 640k barrels. Equities closed lower, led by the Dow Jones decline of 1.21% to 51,461.90, while the S&P 500 fell 0.45% to 7,551.81.
Treasury yields rose, with the 2-year adding 7 bp to 4.74% and the 10-year adding 1 bp to 5.01%. ADP employment rose to 16,250 while the Empire State manufacturing index dropped to 7.60. Mortgage rates climbed to 6.97%.
The combination of robust consumer spending and the quarter-point tightening reinforced signals of resilient demand even as borrowing costs increase.
The Day Ahead
Building permits and housing starts will be released at 8:30 ET, with markets focused on the preliminary readings and their month-over-month changes. These figures will provide fresh insight into residential construction trends after the NAHB index weakened. No Federal Reserve speakers are scheduled.
Traders will also monitor any follow-through reaction to yesterday’s retail sales and rate decision. Oil inventory updates from the EIA may influence energy prices. Attention will center on whether the strong sales print sustains equity pressure or prompts rotation into rate-sensitive sectors.
Other Economic Notes
Stronger-than-expected retail sales and price data point to resilient consumer demand despite higher borrowing costs. Business inventories rose more than forecast, suggesting firms are building stocks amid solid sales. The drop in the NAHB index highlights ongoing pressure on housing from elevated mortgage rates, which climbed to 6.97%.
Broader price measures for exports and imports turned positive, adding to evidence of firming external demand. ↓ p.2