US Macro Daily(Beta Mode)
Fed Lifts Rate to 4% After Retail Sales Beat
Market Snapshot
| Asset | Level | Change |
|---|---|---|
| S&P 500 | 7,637.76 | +1.14% |
| Nasdaq 100 | 29,446.98 | +1.73% |
| Dow Jones | 51,778.04 | +0.61% |
| Russell 2000 | 2,874.63 | +0.55% |
| USD/JPY | 157.93 | +1.23% |
| EUR/USD | 1.15 | -0.07% |
| GBP/USD | 1.33 | -0.34% |
| Gold | 4,407.20 | +0.17% |
| WTI Crude | 96.59 | -5.22% |
| Bitcoin | 77,962.58 | +2.04% |
| US 2Y Treasury | 4.74% | +7 bp |
| US 10Y Treasury | 5.01% | +1 bp |
Prior Economic Events
| Data | Prior | Cons | Actual |
|---|---|---|---|
| ADP Employment Change Weekly | 12,250 | - | 16,250 |
| NY Empire State Manufacturing Index | 20.60 | 14.75 | 7.60 |
| API Weekly Crude Oil Stocks | -300,000 | -1.8m | 7.1m |
| MBA 30-Year Mortgage Rate | 6.85 | - | 6.97 |
| Retail Sales Month-over-Month | -0.50 | 0.80 | 1.20 |
| Export Prices Month-over-Month | -1.40 | 0.50 | 0.60 |
| Import Prices Month-over-Month | -0.30 | 0.40 | 0.70 |
| Retail Sales Control Group Month-over-Month | -0.40 | 0.40 | 1.40 |
| Retail Sales excluding Autos Month-over-Month | -0.20 | 0.50 | 1.40 |
| Business Inventories Month-over-Month | 0.10 | 0.30 | 0.80 |
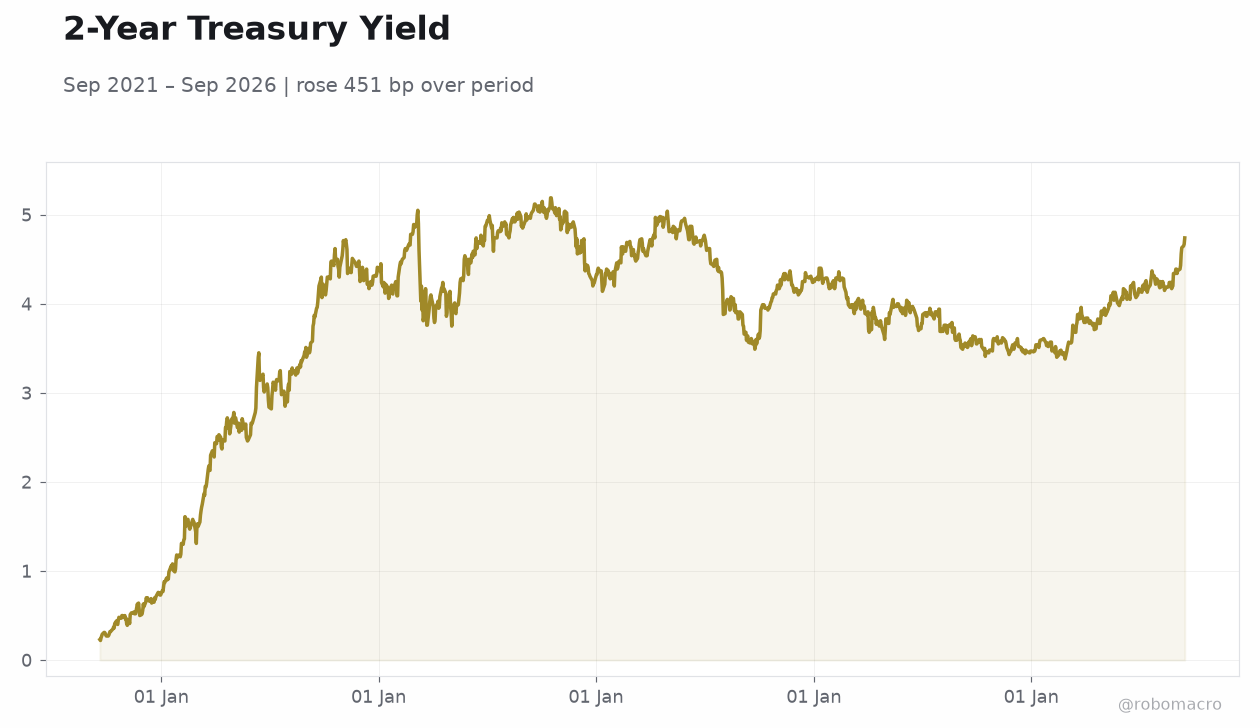 2-Year Treasury Yield | Type: macro_line | Percent: 4.74 (2026-09-16) | Range: 0.22–5.19 | Trend(6pt): 0.23,4.25,4.73,3.97,4.65,4.74
Today's Economic Events
| Data | Prior | Cons | Time |
|---|---|---|---|
| Industrial Production Month-over-Month | 0.20 | 0.30 | 05:15 |
| Speech by Fed's Bowman | - | - | 05:30 |
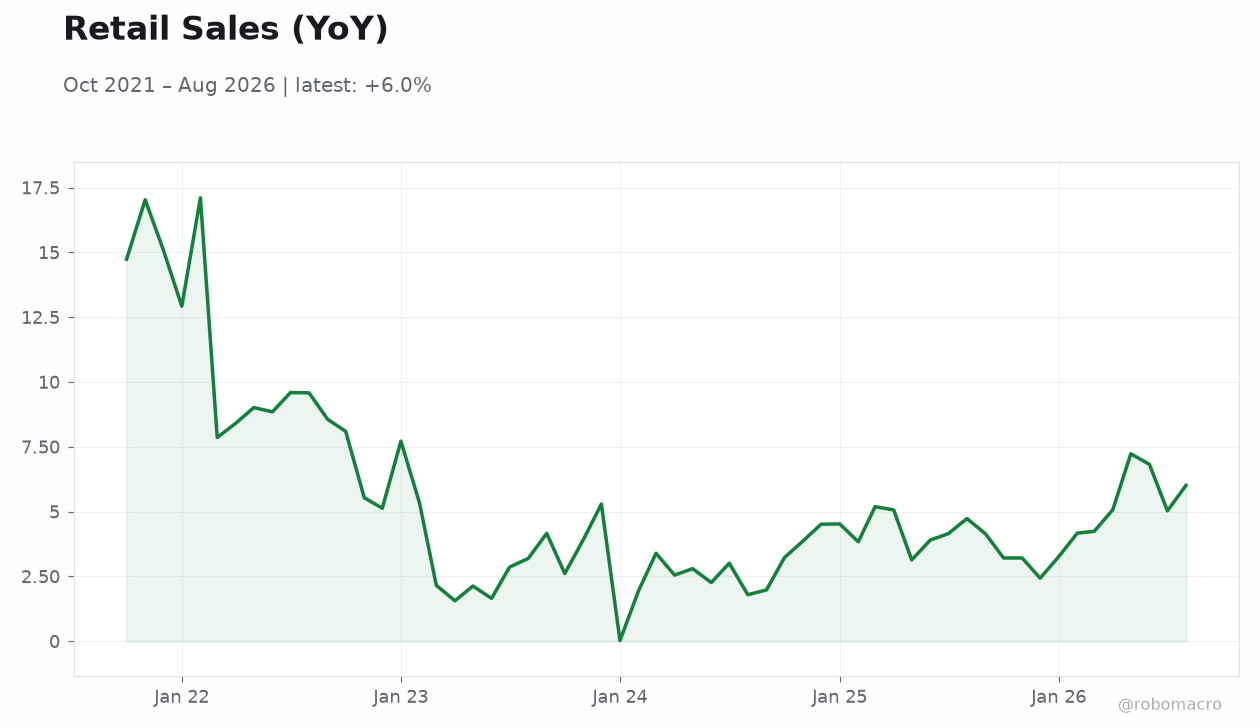
- Retail sales rose 1.2% MoM, beating consensus 0.8%, with control group up 1.4%.
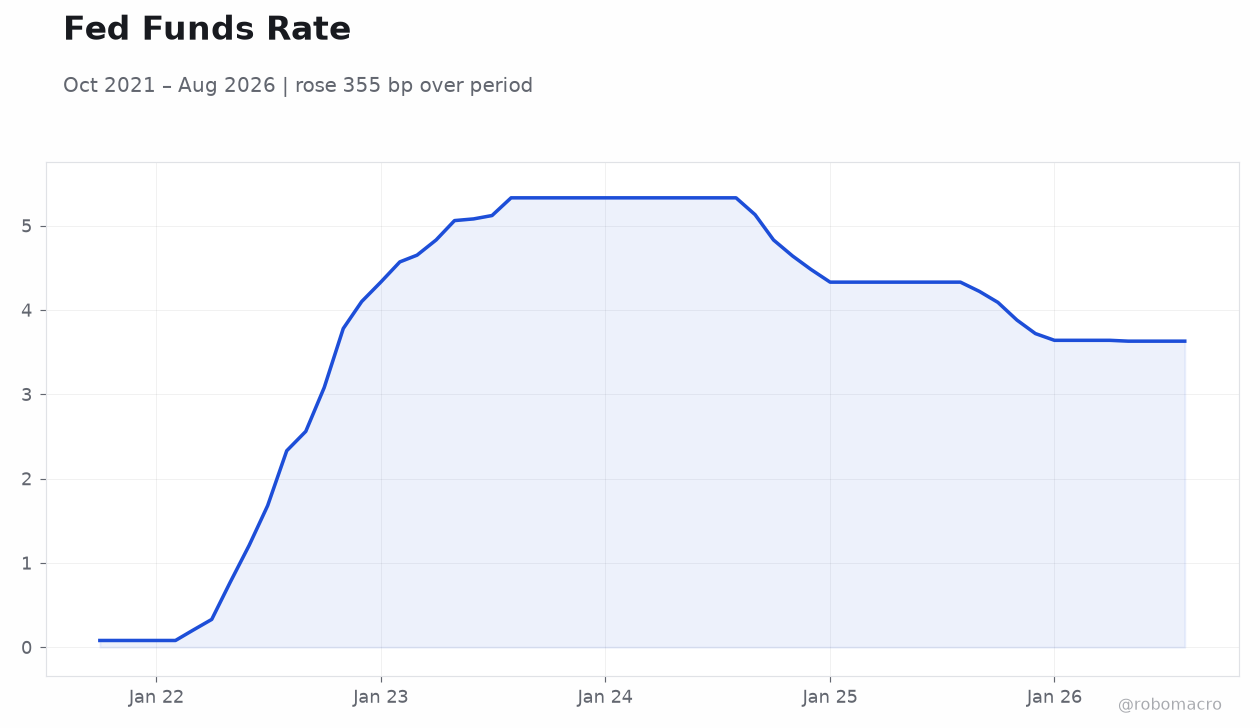
- FOMC lifted policy rate to 4.00% from 3.75% and issued fresh projections.
- Equities advanced, led by Nasdaq 100 +1.73%, while 2-year yield climbed 7 bp to 4.74%.
Yesterday's Recap
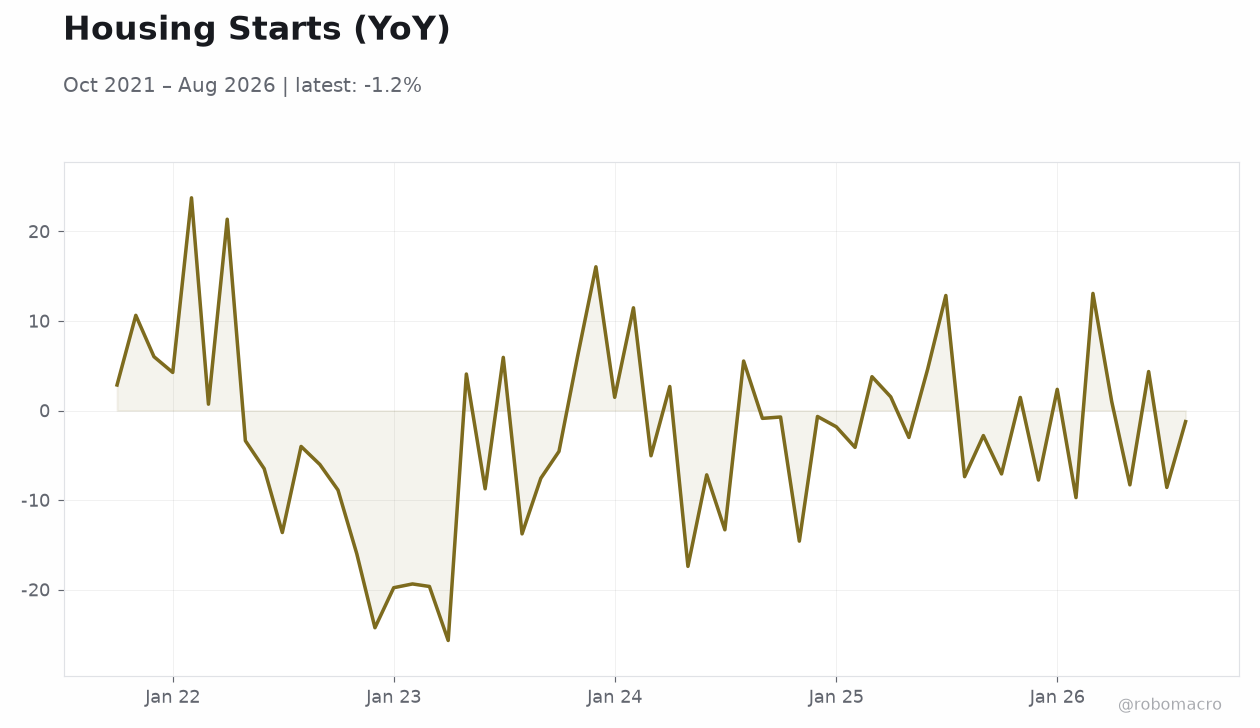
Retail sales posted a strong 1.2% MoM increase against 0.8% consensus, with the control group and ex-autos components both surging 1.4%. Export prices rose 0.6% and import prices 0.7%, while business inventories climbed 0.8% versus 0.3% expected. The NAHB Housing Market Index fell to 32 from 35, signaling further weakness in homebuilding.
ADP employment change printed 16,250 and the NY Empire State Manufacturing Index dropped to 7.60. The FOMC raised the federal funds rate to 4.00%, releasing updated economic projections that reinforced a tighter stance. Equity indices closed higher, with the S&P 500 up 1.14% to 7,637.76 and the Nasdaq 100 gaining 1.73%.
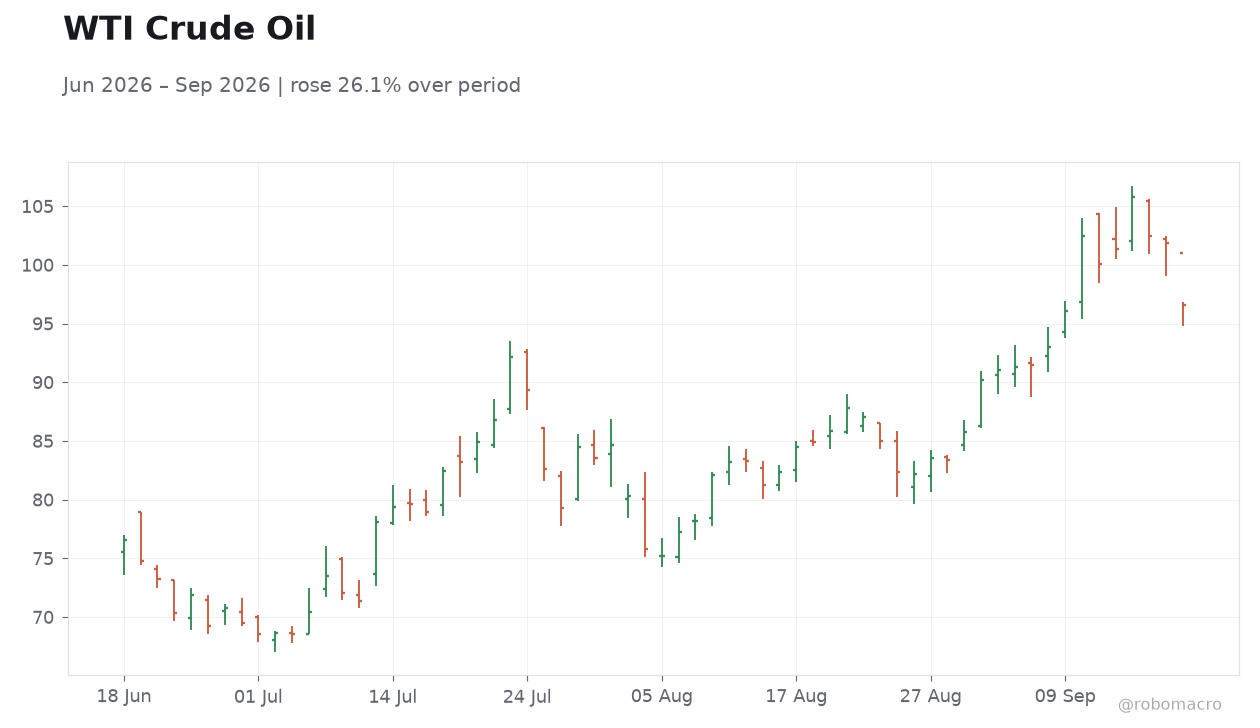
WTI crude fell 5.22% to 96.59 as the 2-year Treasury yield rose 7 bp to 4.74% and the 10-year yield added 1 bp to 5.01%. Oil inventories declined 640k barrels while gasoline stocks rose 794k.
The Day Ahead
Industrial production is scheduled for release at 5:15 a.m. ET and carries the highest market impact, with consensus at +0.3% MoM. Fed Governor Bowman is set to speak at 5:30 a.m.
ET, offering fresh insight into the post-hike outlook. Traders will monitor any revisions to prior inventory or sales data that could alter growth assessments. Oil inventory figures and mortgage rate updates may influence energy and housing sectors.
Markets will price incremental policy tightening expectations following yesterday’s decision. Broader activity indicators will be watched closely for signs of moderation in the second half of the year.
Other Economic Notes
Stronger-than-expected retail sales point to resilient consumer spending despite elevated borrowing costs. Housing market sentiment continued to erode, with the NAHB index reaching its lowest level in the recent series. Elevated business inventories at 0.8% suggest firms are building stocks ahead of potential demand softening.
The combination of firm consumption and weak housing data keeps inflation risks in focus while supporting the case for sustained higher rates. Broader activity indicators will be watched closely for signs of moderation in the second half of the year. The stronger retail print and rate hike reinforced expectations for tighter policy.