US Macro Daily(Beta Mode)
Hot CPI Stokes Hike Bets; Equities Slump
Market Snapshot
| Asset | Level | Change |
|---|---|---|
| S&P 500 | 7,718.94 | -1.11% |
| Nasdaq 100 | 29,950.82 | -2.02% |
| Dow Jones | 51,621.48 | -0.09% |
| Russell 2000 | 2,729.53 | -1.93% |
| USD/JPY | 157.82 | -0.32% |
| EUR/USD | 1.12 | +0.13% |
| GBP/USD | 1.33 | +0.01% |
| Gold | 4,177.80 | +1.70% |
| WTI Crude | 93.95 | -1.20% |
| Bitcoin | 80,949.73 | -0.75% |
| US 2Y Treasury | 4.82% | +3 bp |
| US 10Y Treasury | 5.19% | -2 bp |
Prior Economic Events
| Data | Prior | Cons | Actual |
|---|---|---|---|
| Existing Home Sales Month-over-Month | -3.20 | - | 1.50 |
| Speech by Fed's Barkin | - | - | - |
| Monthly Budget Statement | -167,000m | -29,000m | - |
| Speech by Fed's Collins | - | - | - |
| Speech by Fed's Bowman | - | - | - |
| MBA 30-Year Mortgage Rate | 7.49 | - | 7.50 |
| Core Inflation Rate Month-over-Month | 0.30 | 0.20 | 0.30 |
| Core Inflation Rate Year-over-Year | 2.40 | 2.50 | 2.60 |
| Inflation Rate Month-over-Month | 0.40 | 0.60 | 0.60 |
| Inflation Rate Year-over-Year | 3.40 | 3.60 | 3.70 |
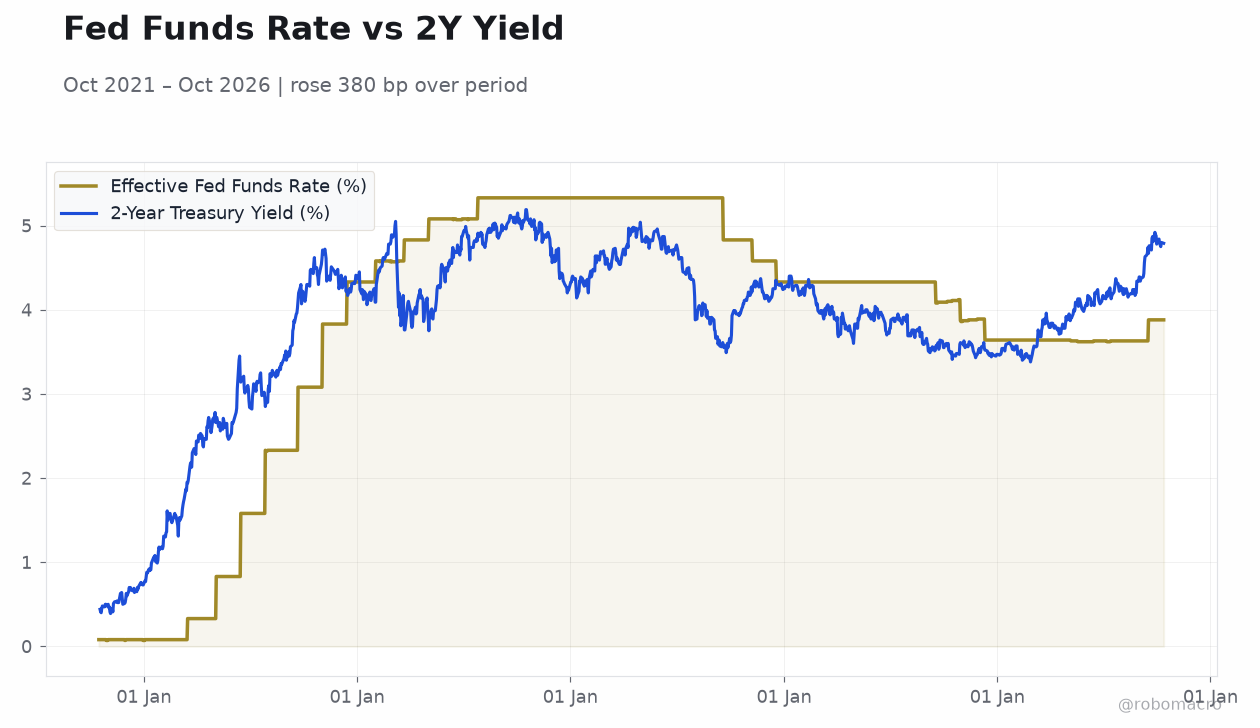 Fed Funds Rate vs 2Y Yield | Type: macro_line | Effective Fed Funds Rate (%): 3.88 (2026-10-13) | Range: 0.07–5.33 | Trend(5pt): 0.08,4.33,5.33,4.33,3.88 | 2-Year Treasury Yield (%): 4.79 (2026-10-13) | Range: 0.39–5.19 | Trend(6pt): 0.44,4.06,4.93,3.95,4.8,4.79
Today's Economic Events
| Data | Prior | Cons | Time |
|---|---|---|---|
| Producer Price Index Month-over-Month | 0.40 | 0.50 | 08:30 |
| Retail Sales Month-over-Month | 1.20 | 0.30 | 08:30 |
| Core PPI Month-over-Month | 0.20 | 0.30 | 08:30 |
| NY Empire State Manufacturing Index | 7.60 | 10.30 | 08:30 |
| Philadelphia Fed Manufacturing Index | 37.80 | 28.40 | 08:30 |
| Retail Sales Control Group Month-over-Month | 1.40 | 0.30 | 08:30 |
| Retail Sales Excluding Autos Month-over-Month | 1.40 | 0.50 | 08:30 |
| Weekly Jobless Claims | 197,000 | 200,000 | 08:30 |
| Business Inventories Month-over-Month | 0.80 | 0.40 | 10:00 |
| EIA Weekly Crude Oil Inventory | -3.2m | 200,000 | 12:00 |
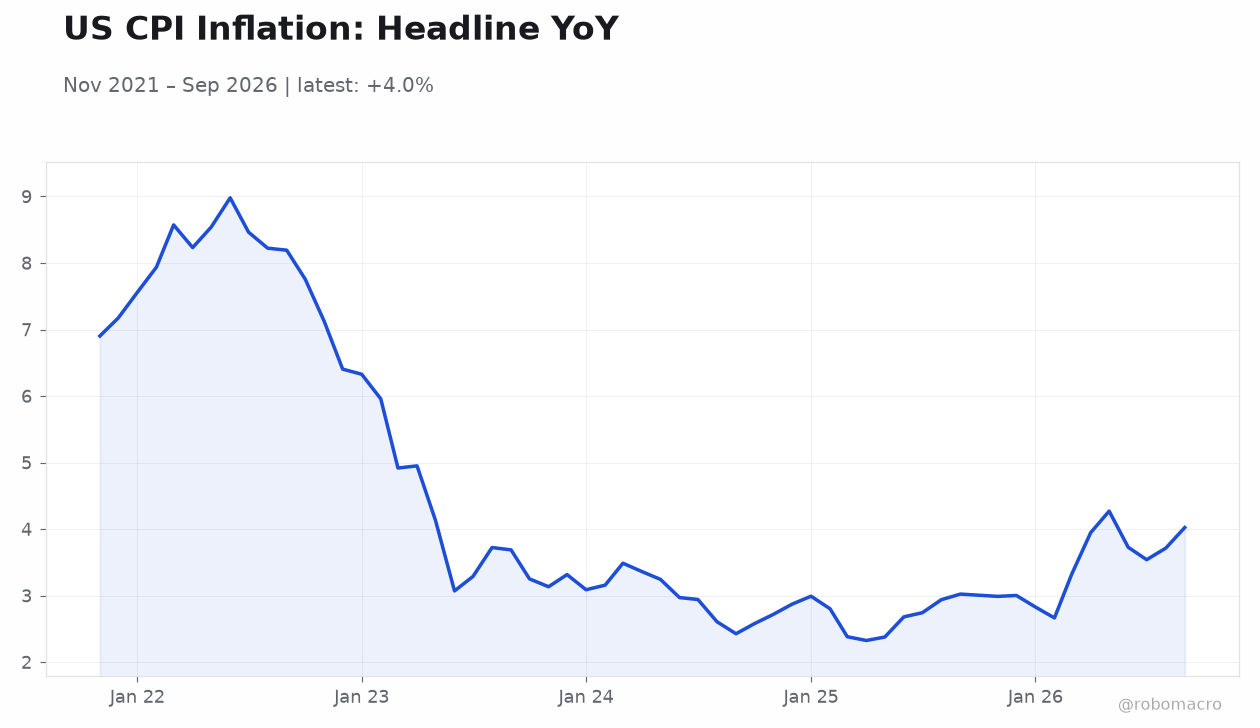
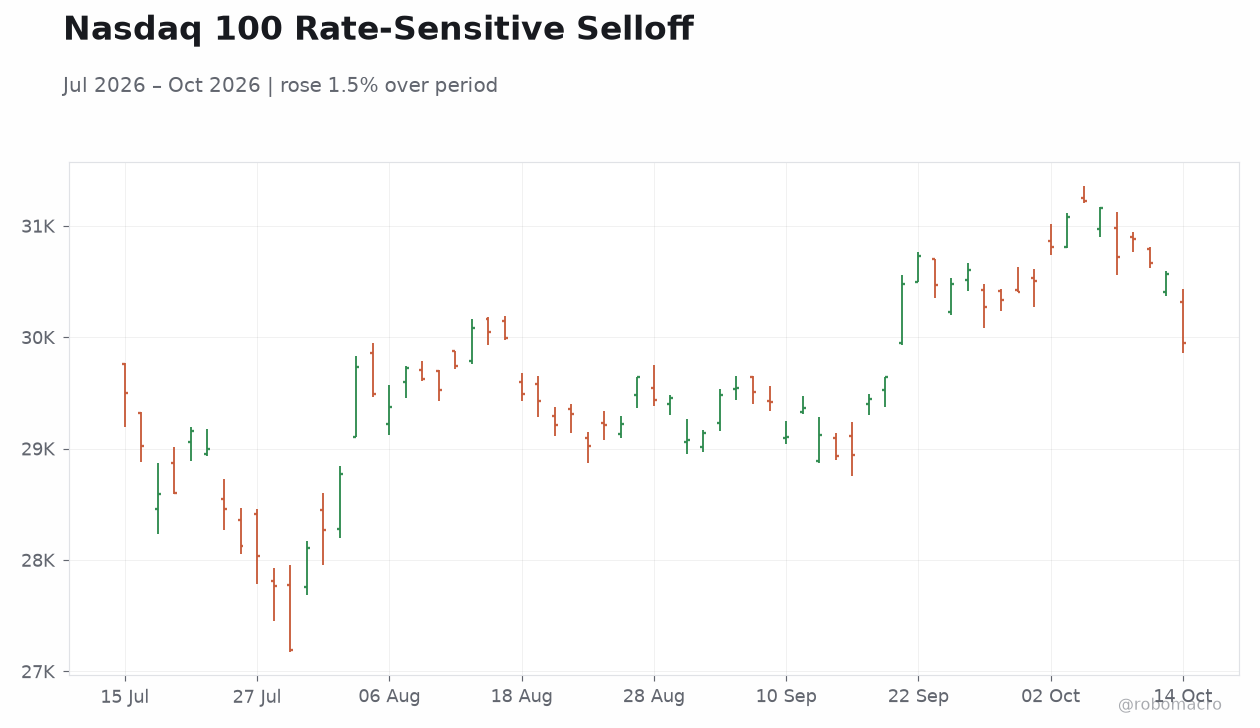
- September CPI ran hot at 3.7% YoY headline and 0.6% MoM, with core at 2.6% YoY, pushing Wall Street to raise December rate-hike odds and sinking the Nasdaq 100 2.0%.
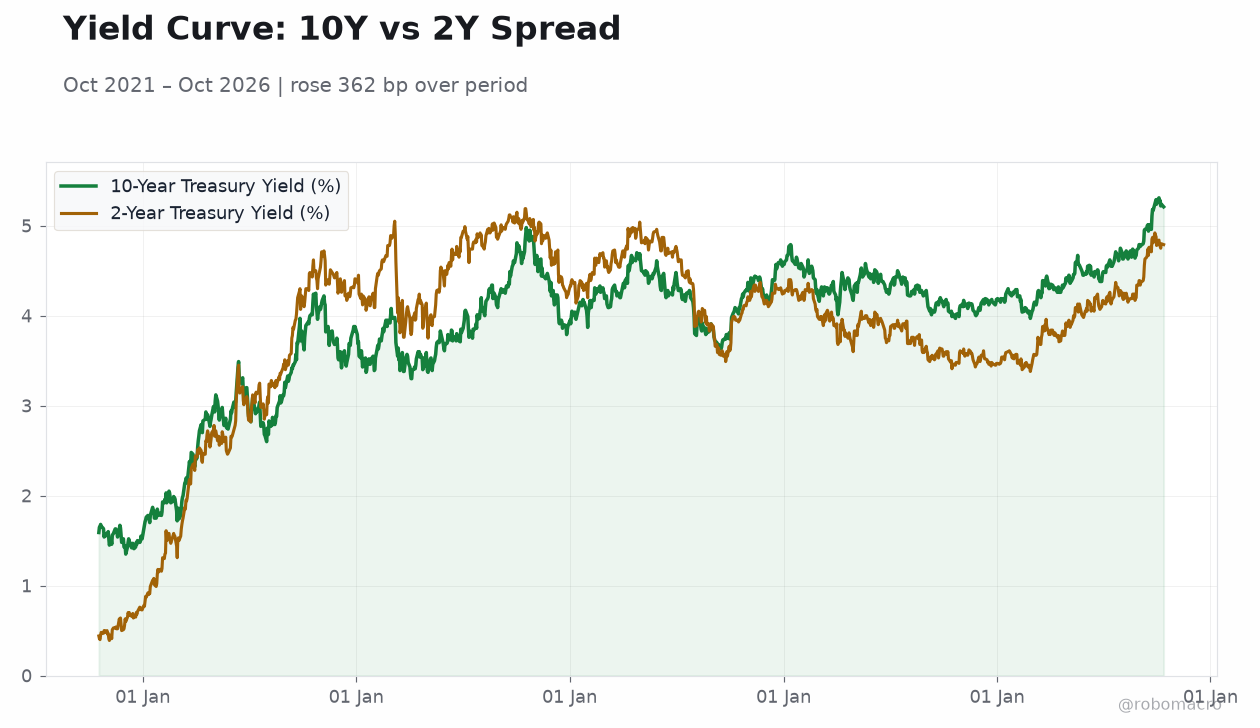
- The 2-year yield rose 3 bp to 4.82% while the 10-year eased 2 bp to 5.19%, flattening the curve as front-end pricing adjusted to a stickier inflation path.
- Fed speakers dominated the tape: Daly flagged further hikes but not necessarily this month, while the Beige Book showed moderate growth amid rising price pressures.
Yesterday's Recap
September CPI delivered an upside surprise, with the headline index rising 0.6% MoM and 3.7% YoY versus consensus of 3.6%, while core inflation held at 0.3% MoM but edged up to 2.6% YoY against a 2.5% forecast. The CPI index printed at 336.94 versus 334.98 previously, confirming the acceleration in price pressures. Equity markets sold off on the print: the S&P 500 fell 1.11% to 7,718.94, the Nasdaq 100 dropped 2.02% to 29,950.82, and the Russell 2000 lost 1.93%, though the Dow was nearly flat at -0.09%.
The dollar mixed: EUR/USD added 0.13% to 1.12 while USD/JPY eased 0.32% to 157.82. Treasuries told a two-speed story: the 2-year yield backed up 3 bp to 4.82% on hike expectations, while the long end rallied 2 bp to 5.19%. Gold rallied 1.70% to $4,177.80 as an inflation hedge, and WTI crude fell 1.20% to $93.95.
On the housing front, existing home sales rebounded 1.5% MoM after a 3.2% decline, and the MBA 30-year mortgage rate ticked up to 7.50%. API crude inventories posted a massive 11.1 million barrel draw.
The Day Ahead
Today's calendar includes producer price data at 8:30 AM ET, which will be scrutinized for pipeline inflation signals following the hot CPI; consensus looks for a 0.5% MoM gain after 0.4% previously. Fed speak continues with Barkin and Bowman on the circuit, offering chances to parse the December hike debate. Energy markets watch EIA inventory data after the large API draw.
Earnings season picks up with major companies reporting.
Other Economic Notes
The Beige Book painted a picture of moderate growth alongside building price pressures, with firms specifically flagging higher diesel costs filtering through the economy. Federal Reserve data has challenged the narrative of a K-shaped economy, suggesting household balance sheets are more resilient than pessimists argue. Housing remains squeezed: mortgage rates at 7.50% continue to test affordability even as existing sales bounced from August's slump.
Oil's strength near $94 adds to the inflation complex, complicating the Fed's disinflation narrative just as core progress stalls.