US Macro Daily(Beta Mode)
Yields Climb as Fed Tightening Bets Firm
Market Snapshot
| Asset | Level | Change |
|---|---|---|
| S&P 500 | 7,690.73 | +0.41% |
| Nasdaq 100 | 29,529.35 | +1.17% |
| Dow Jones | 51,966.03 | -0.07% |
| Russell 2000 | 2,728.30 | +0.25% |
| USD/JPY | 157.81 | -0.21% |
| EUR/USD | 1.12 | -0.12% |
| GBP/USD | 1.33 | +0.03% |
| Gold | 4,140.30 | -0.48% |
| WTI Crude | 100.81 | -2.75% |
| Bitcoin | 81,512.45 | -0.42% |
| US 2Y Treasury | 4.77% | +3 bp |
| US 10Y Treasury | 5.15% | +6 bp |
Prior Economic Events
| Data | Prior | Cons | Actual |
|---|---|---|---|
| No events available | |||
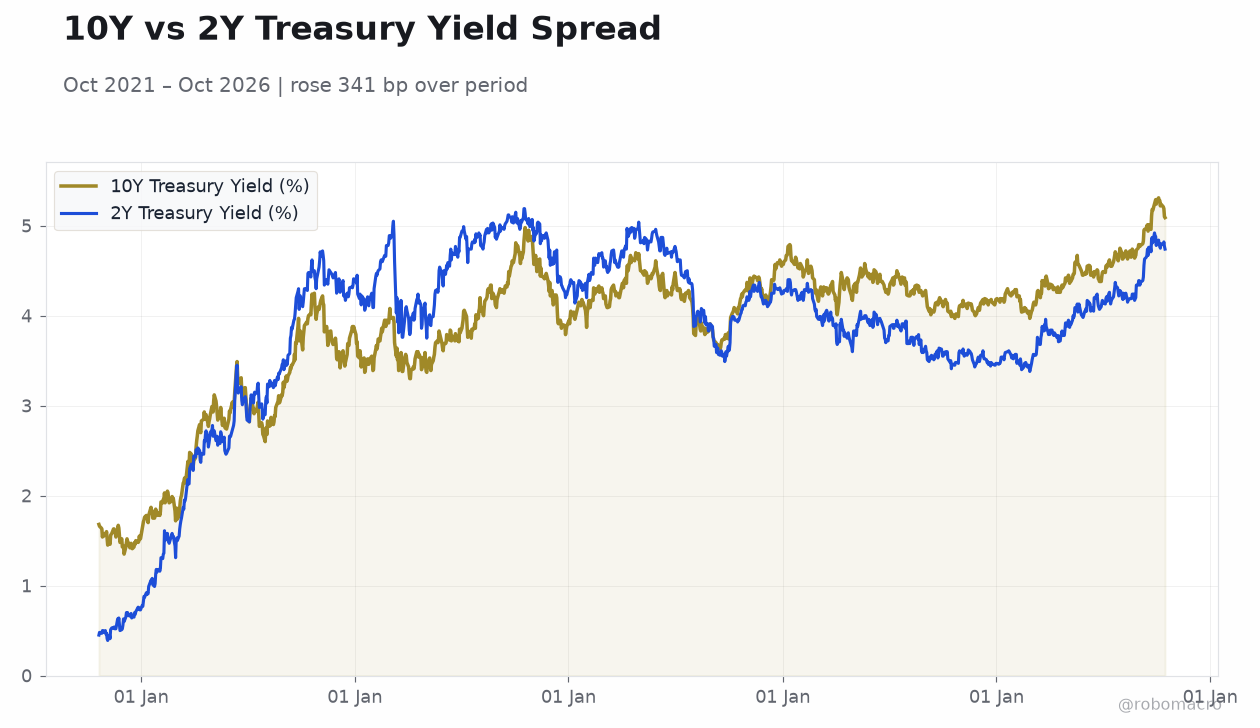 10Y vs 2Y Treasury Yield Spread | Type: macro_line | 10Y Treasury Yield (%): 5.09 (2026-10-16) | Range: 1.35–5.31 | Trend(6pt): 1.68,3.52,4.64,4.44,5.1,5.09 | 2Y Treasury Yield (%): 4.74 (2026-10-16) | Range: 0.39–5.19 | Trend(6pt): 0.45,4.21,4.98,3.88,4.77,4.74
Today's Economic Events
| Data | Prior | Cons | Time |
|---|---|---|---|
| No events available | |||
- Long-end Treasuries sold off, with the 10-year yield rising 6 bp to 5.15% and the 2-year up 3 bp to 4.77%, steepening the curve as markets price a firmer Fed path.
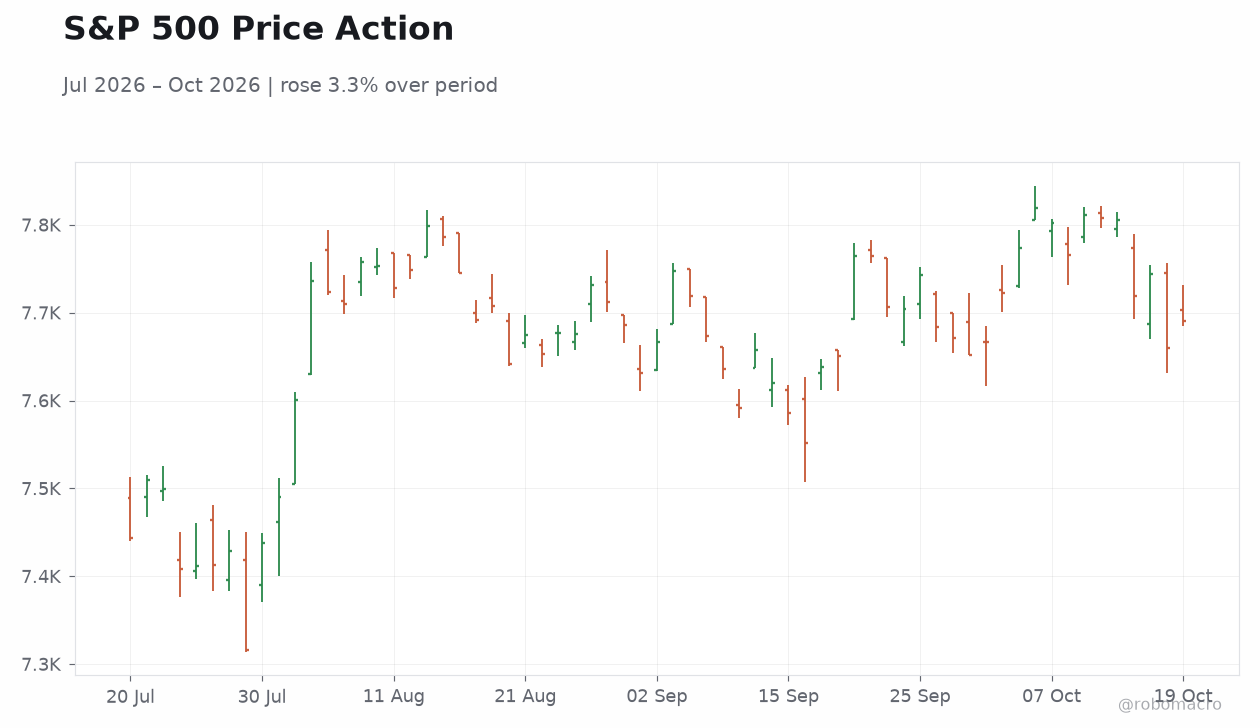
- Nasdaq 100 outperformed (+1.17%) while the Dow slipped (-0.07%), a narrow tech-led rebound after last week's selloff; WTI crude fell 2.75% to $100.81.
- Gold eased 0.48% to $4,140.30 and Bitcoin slipped 0.42% to $81,512 as caution builds ahead of Fed communication and inflation data.
Yesterday's Recap
US markets opened the week with a split tape as the S&P 500 added 0.41% to 7,690.73 and the Nasdaq 100 jumped 1.17% to 29,529.35, recovering part of last week's losses, while the Dow Jones edged down 0.07% to 51,966.03 and the Russell 2000 gained 0.25% to 2,728.30. The move was concentrated in growth and semiconductor names rather than broad risk appetite. Rates told a different story: the 10-year Treasury yield climbed 6 bp to 5.15% and the 2-year rose 3 bp to 4.77%, extending last week's backup after a brief rally.
The dollar softened, with USD/JPY down 0.21% to 157.81 and EUR/USD off 0.12% at 1.12, while GBP/USD firmed 0.03% to 1.33. Commodities were the weak spot: WTI crude dropped 2.75% to $100.81 and gold fell 0.48% to $4,140.30. No major US data releases were scheduled, leaving positioning and Fed expectations to drive the session.
The Day Ahead
The US calendar remains light, with no top-tier releases scheduled, so attention shifts to Fed communication and the run-up to inflation data later in the week. Markets will watch for any Fed speakers to clarify the reaction function after the recent rate move and last week's equity selloff. Treasury supply and dealer positioning remain a focus after the 10-year yield pushed to 5.15%, with the long end sensitive to auction demand and term-premium chatter.
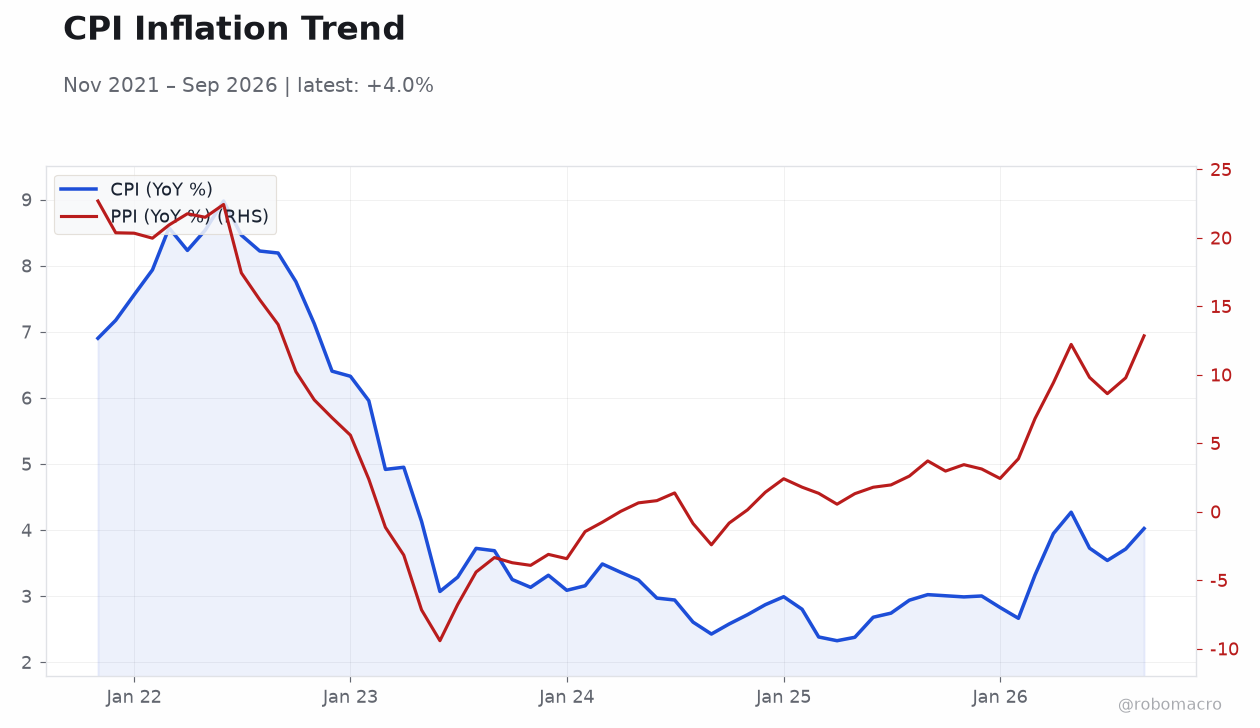
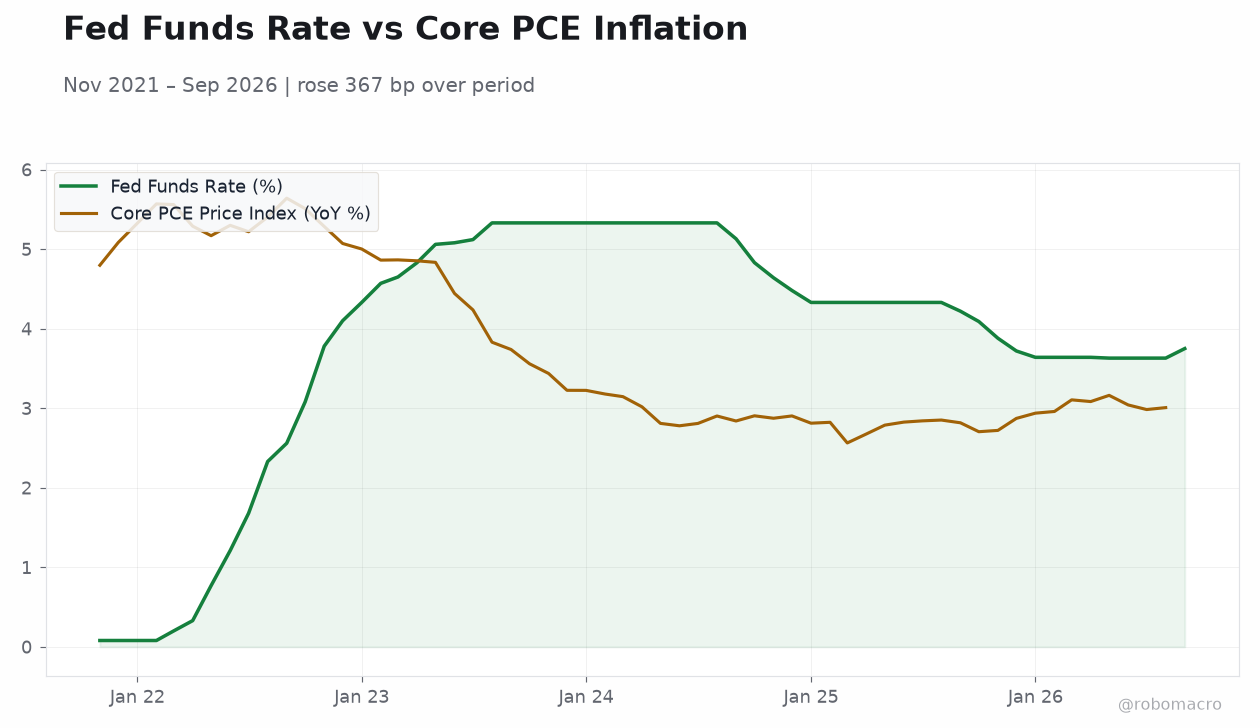
Equity futures will be gauged against the tech-led rebound, with breadth the key tell on whether the recovery is durable. Crude's slide below $101 will be monitored for spillover into breakevens and inflation expectations. With the Fed funds rate at 3.88% and CPI at 3.70% YoY, the real-rate gap keeps policy credibility in focus.
Other Economic Notes
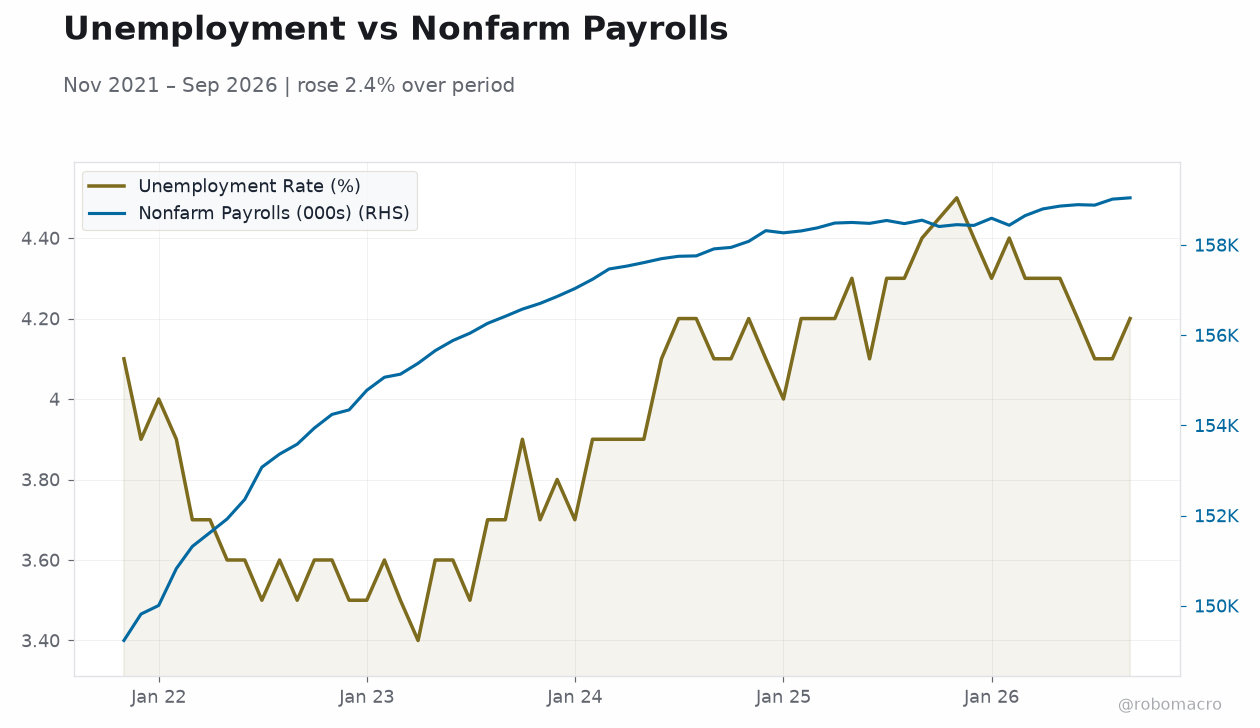
The macro backdrop remains one of resilient activity against sticky inflation: GDP growth was 2.20% QoQ SAAR in Q2, retail sales are running 6.29% YoY, and unemployment sits at 4.20%, a combination that argues against rapid easing. September CPI at 3.70% YoY keeps the inflation fight unfinished, and White House commentary framing the rebound as coexisting with prosperity underscores the political sensitivity. JPMorgan's Jamie Dimon described the economy as "booming" while flagging inflationary risks, a view consistent with the rate backup.
↓ p.2