US Macro Daily(Beta Mode)
Fed Holds as GDP Beat Lifts Yields
Market Snapshot
| Asset | Level | Change |
|---|---|---|
| S&P 500 | 7,720.39 | -0.30% |
| Nasdaq 100 | 29,402.51 | -1.38% |
| Dow Jones | 52,342.56 | -0.25% |
| Russell 2000 | 2,859.22 | +1.01% |
| USD/JPY | 157.12 | -0.45% |
| EUR/USD | 1.12 | +0.36% |
| GBP/USD | 1.34 | +0.73% |
| Gold | 3,981.70 | -1.23% |
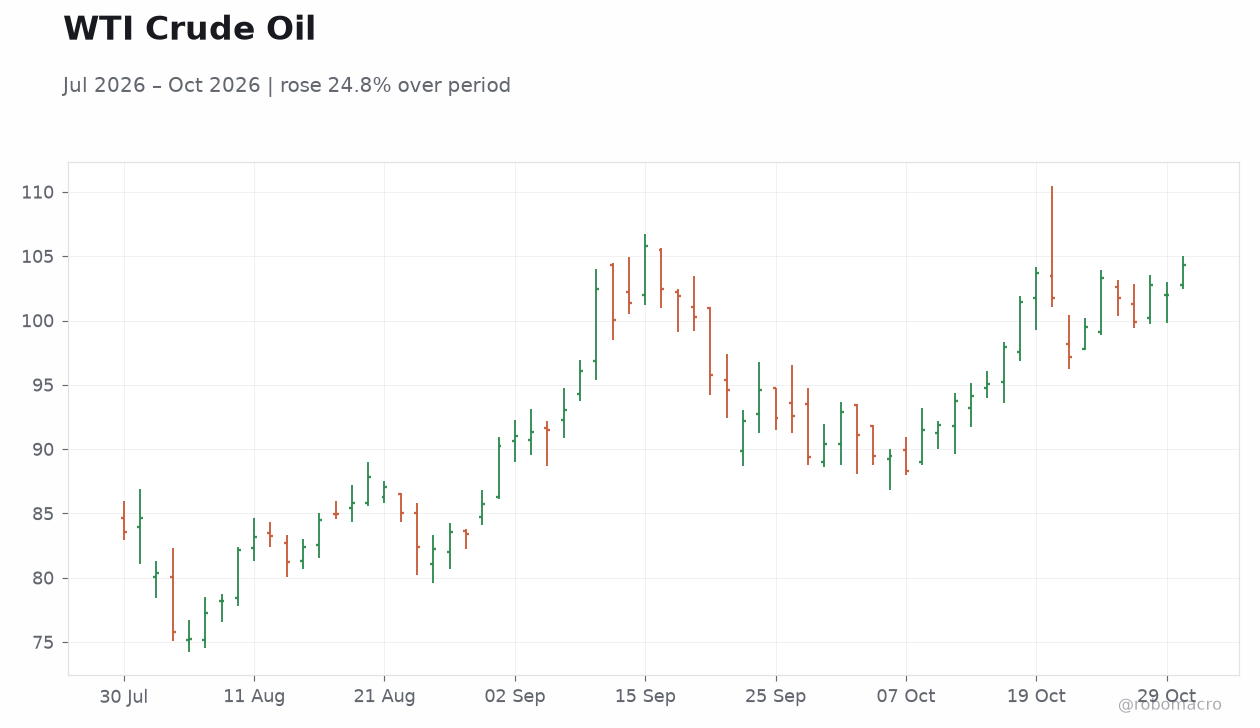
| WTI Crude | 104.29 | +2.25% |
| Bitcoin | 77,622.66 | -0.20% |
| US 2Y Treasury | 4.61% | -6 bp |
| US 10Y Treasury | 4.98% | -7 bp |
Prior Economic Events
| Data | Prior | Cons | Actual |
|---|---|---|---|
| EIA Weekly Gasoline Inventory | -3.0m | -900,000 | 3.9m |
| Atlanta Fed GDPNow | 3.40 | - | 3.30 |
| FOMC Statement | - | - | - |
| Fed Interest Rate Decision | 4 | 4 | 4 |
| Fed Press Conference | - | - | - |
| Core PCE Price Index Month-over-Month | 0.30 | 0.30 | 0.30 |
| GDP Growth Quarter-over-Quarter Advance Estimate | 2.20 | 3.20 | 3.40 |
| Personal Income Month-over-Month | 0.30 | 0.30 | 0.20 |
| Personal Spending Month-over-Month | 0.90 | 0.60 | 0.50 |
| GDP Price Index Quarter-over-Quarter Adv | 6.10 | - | 2.20 |
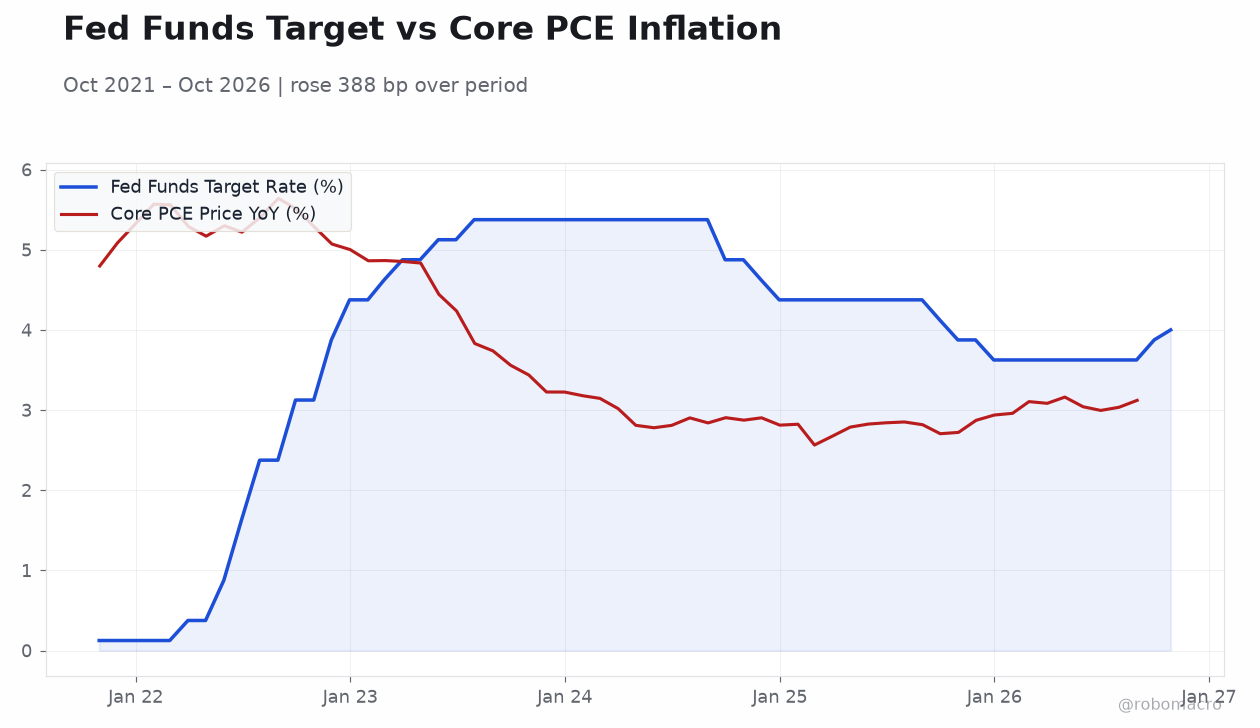
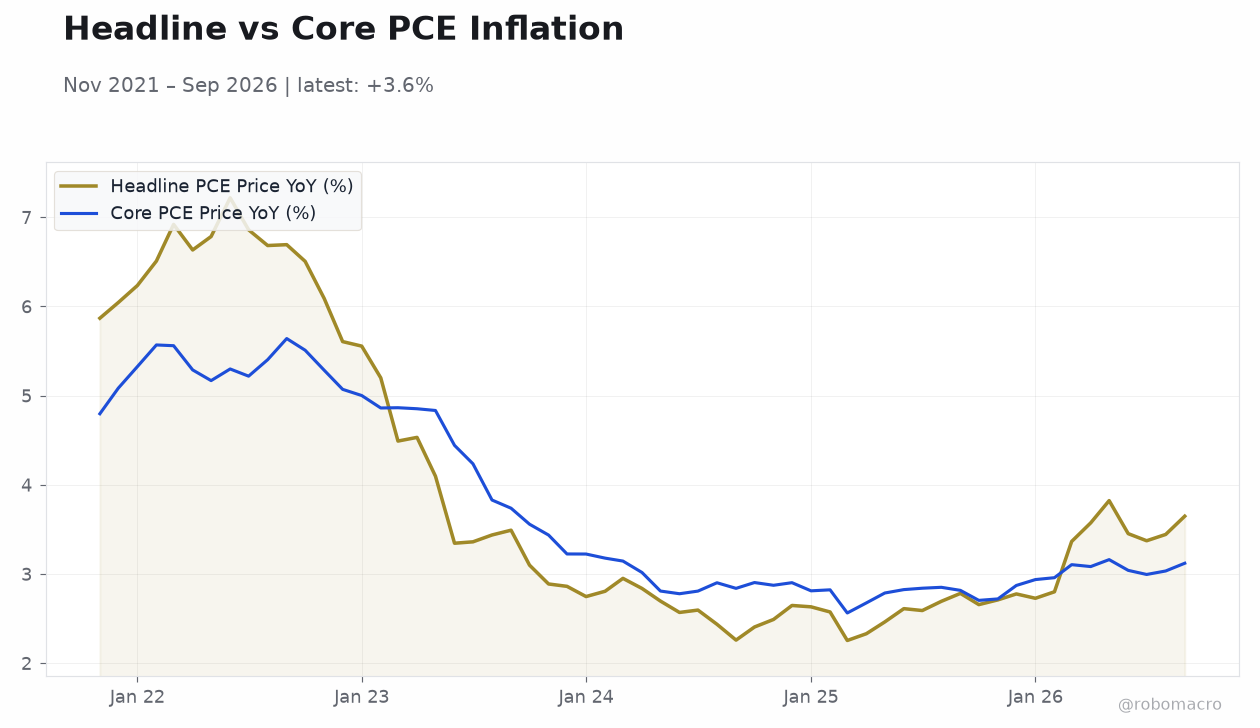 Headline vs Core PCE Inflation | Type: macro_line | Headline PCE Price YoY (%): 3.649 (2026-09-01) | Range: 2.255–7.218 | Trend(6pt): 5.868,5.556,2.952,2.463,3.373,3.649 | Core PCE Price YoY (%): 3.121 (2026-09-01) | Range: 2.564–5.64 | Trend(6pt): 4.797,5.002,3.146,2.787,2.995,3.121
Today's Economic Events
| Data | Prior | Cons | Time |
|---|---|---|---|
| Employment Cost - Benefits Quarter-over-Quarter | 1 | - | 08:30 |
| Employment Cost - Wages Quarter-over-Quarter | 0.90 | - | 08:30 |
| Employment Cost Index Quarter-over-Quarter | 0.90 | 0.80 | 08:30 |
| Chicago PMI | 58.80 | 56.10 | 09:45 |
| Speech by Fed's Musalem | - | - | 12:30 |
- FOMC held the target range at 3.75–4.00% on October 28; Q3 advance GDP printed 3.4% QoQ SAAR, above the 3.2% consensus
- Core PCE rose 0.3% m/m as expected, headline PCE 0.5% m/m and 3.6% y/y; jobless claims fell to 194k
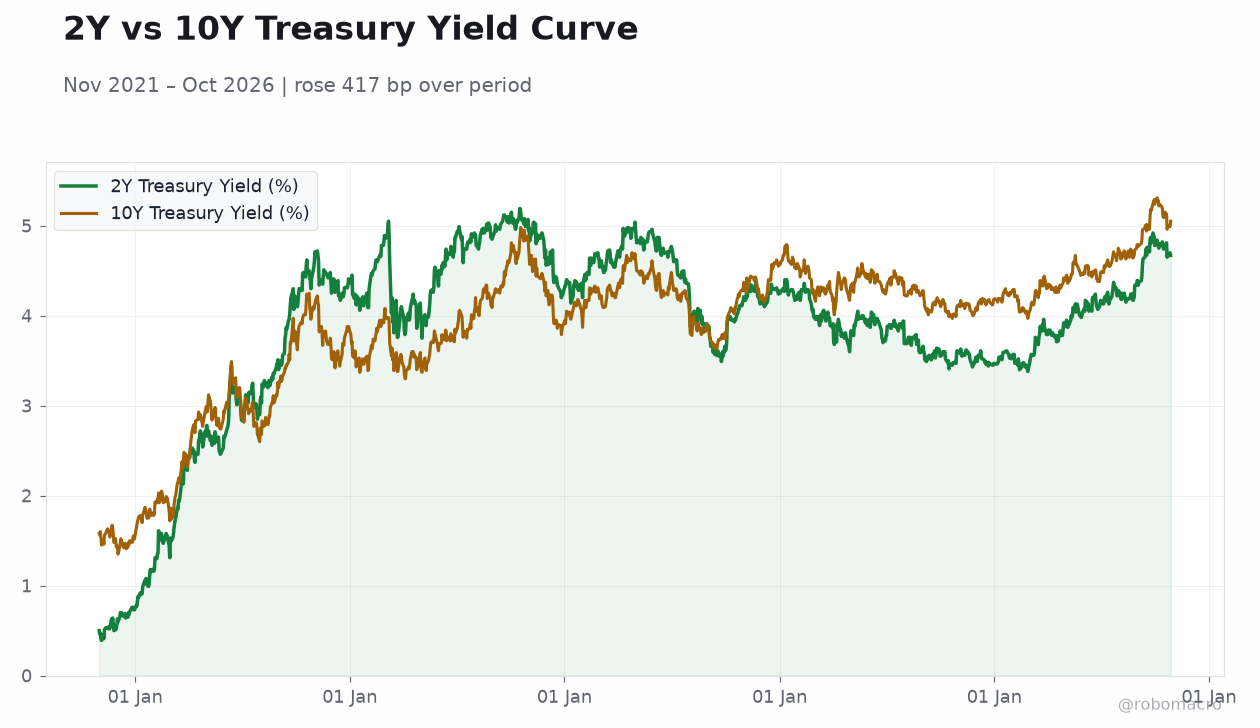
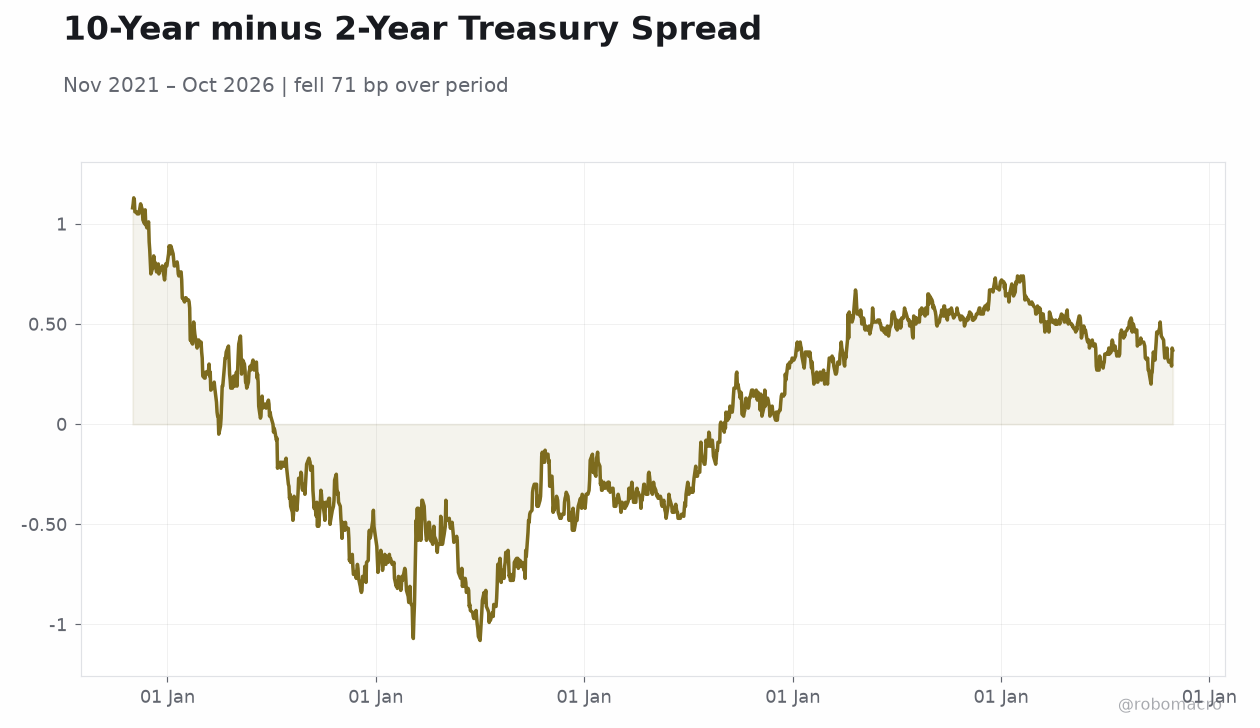
- Curve bull-steepened: 10Y yield eased 7 bp to 4.98%, 2Y down 6 bp to 4.61%; Nasdaq 100 slid 1.38% while Russell 2000 gained 1.01%
Yesterday's Recap
The advance Q3 GDP estimate came in at 3.4% quarter-over-quarter SAAR, beating the 3.2% consensus and accelerating from 2.2% prior, with the GDP price index at 2.2%. September PCE data showed headline inflation at 0.5% m/m and 3.6% y/y, while core PCE matched consensus at 0.3% m/m. Personal spending rose 0.5% m/m versus 0.6% expected, personal income increased 0.2%, and the saving rate slipped to 3.8%.
Weekly jobless claims printed 194,000, below the 199,000 consensus, underscoring labor market resilience. The Atlanta Fed GDPNow estimate was revised down to 3.2% from 3.3%. Markets digested the FOMC hold alongside the data: the S&P 500 fell 0.30% to 7,720.39, the Nasdaq 100 dropped 1.38% on tech weakness, while the Russell 2000 rose 1.01%, signaling rotation.
Treasuries rallied, with the 10-year yield easing 7 bp to 4.98% and the 2-year down 6 bp to 4.61%; WTI crude jumped 2.25% to $104.29 and gold fell 1.23% to $3,981.70.
The Day Ahead
The calendar is light following yesterday's data barrage, with attention turning to month-end positioning and any residual Fed speak. Traders will parse the October 28 FOMC statement and press conference language for signals on the December 9 meeting. Employment cost and regional manufacturing surveys may draw scrutiny as the market recalibrates the growth-inflation mix after the strong GDP print.
Month-end Treasury index rebalancing could add duration supply and modest volatility into the close. Equity markets will watch whether the rotation out of mega-cap tech into small caps persists. With no high-impact releases scheduled, flows and Fed commentary will likely dominate.
Other Economic Notes
The GDP composition points to robust consumer spending and AI-related investment as core growth engines, per Reuters reporting, though the saving rate at 3.8% suggests households are drawing down buffers. Headline PCE at 3.6% y/y remains well above target, complicating the Fed's easing path. Claims at 194,000 signal a still-tight labor market with unemployment at 4.20%.
The GDP price index decelerating to 2.2% from 6.1% prior offers some disinflationary comfort at the aggregate level. Retail sales growth of 6.29% y/y indicates demand momentum carrying into Q4.