US Macro Daily(Beta Mode)
Housing Cracks as Fed Flags AI Risk
Market Snapshot
| Asset | Level | Change |
|---|---|---|
| S&P 500 | 7,323.63 | -0.23% |
| Nasdaq 100 | 27,116.26 | +0.42% |
| Dow Jones | 50,198.17 | -1.11% |
| Russell 2000 | 2,714.31 | +0.46% |
| USD/JPY | 159.91 | +0.25% |
| EUR/USD | 1.10 | +0.07% |
| GBP/USD | 1.32 | -0.33% |
| Gold | 3,730.10 | -0.32% |
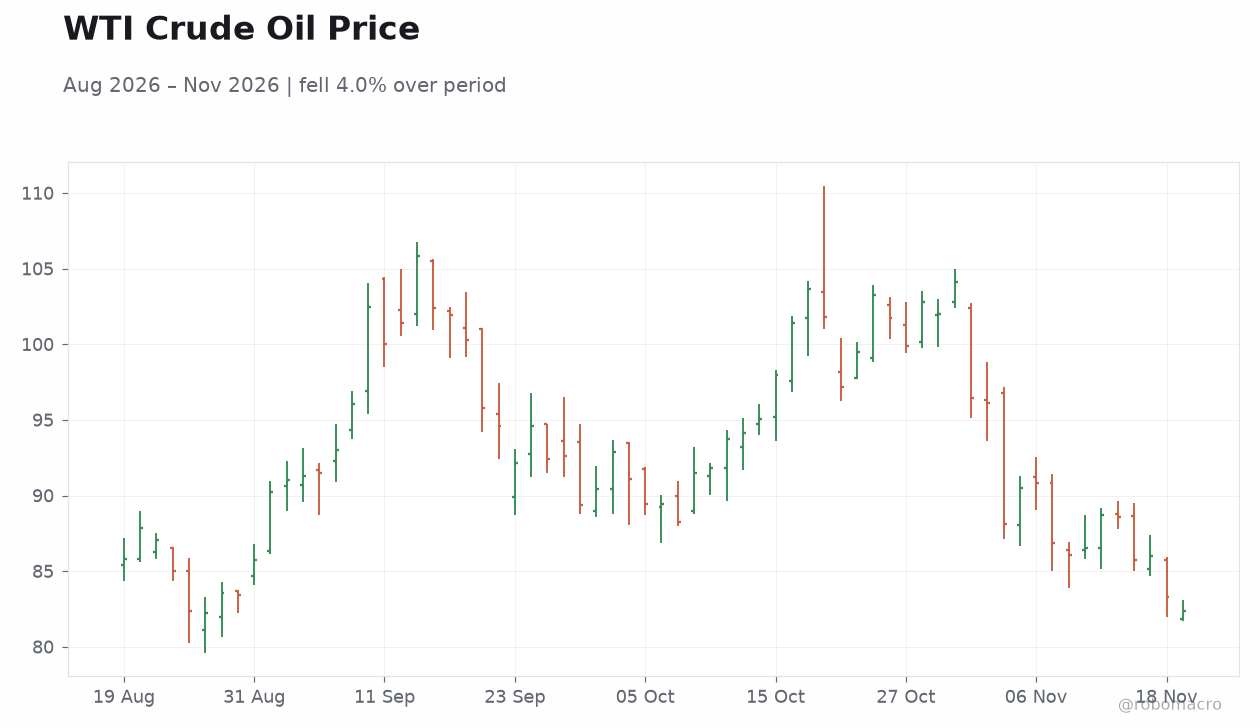
| WTI Crude | 82.33 | -1.12% |
| Bitcoin | 63,735.20 | +1.19% |
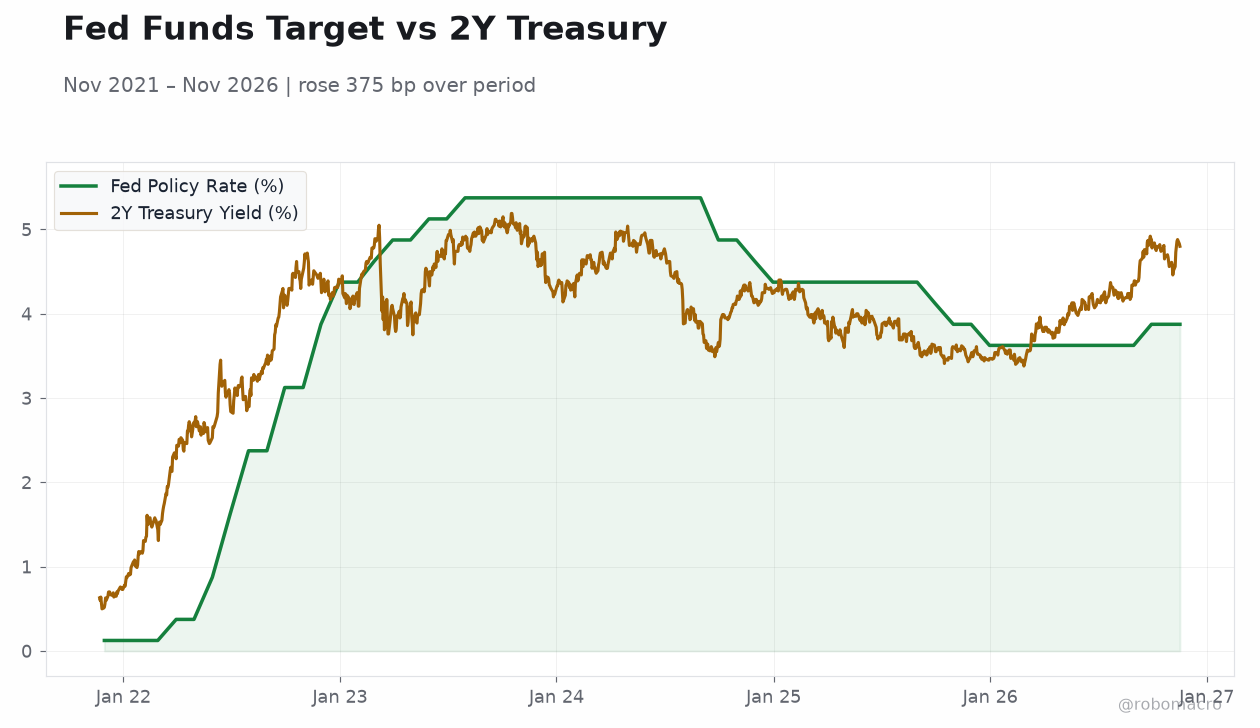
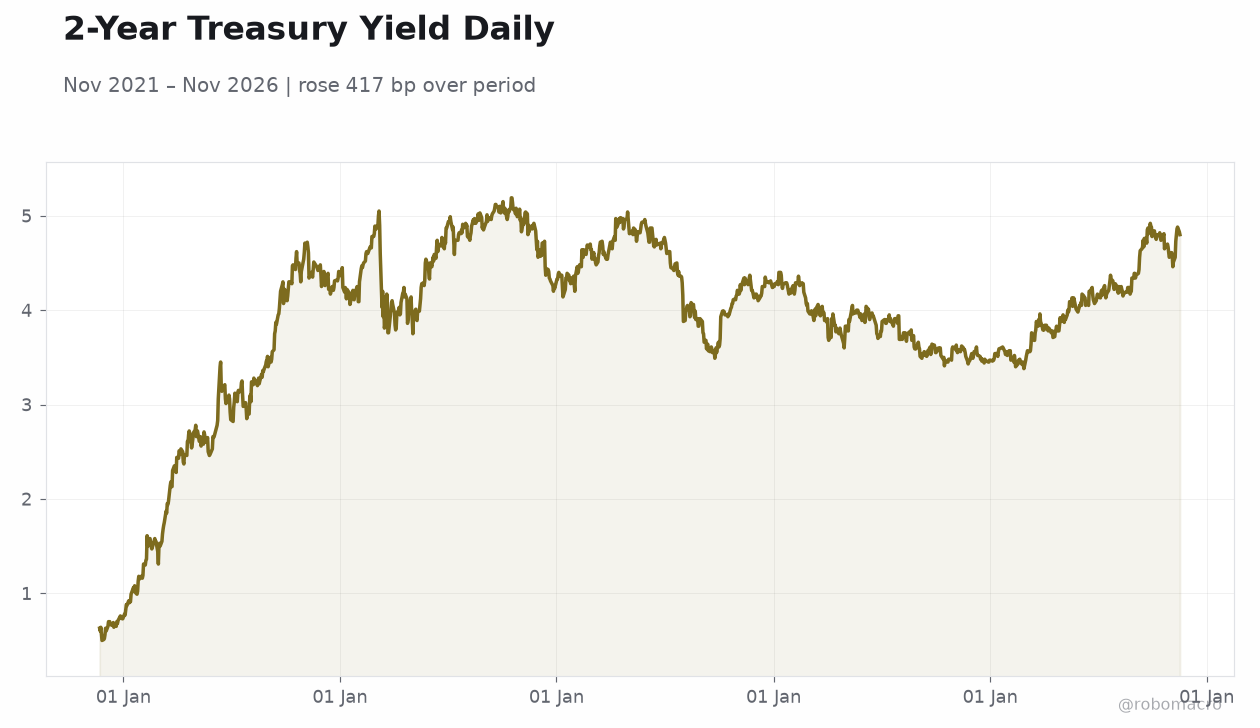
| US 2Y Treasury | 4.80% | 0 bp |
| US 10Y Treasury | 5.07% | -3 bp |
Prior Economic Events
| Data | Prior | Cons | Actual |
|---|---|---|---|
| NAHB Housing Market Index | 29 | 29 | 25 |
| Atlanta Fed GDPNow | 3.50 | 3.50 | 3.40 |
| Speech by Fed's Williams | - | - | - |
| MBA 30-Year Mortgage Rate | 7.21 | - | 7.35 |
| Building Permits Prel | 1.4m | 1.4m | 1.3m |
| Housing Starts Level | 1.2m | 1.3m | 1.3m |
| Pending Home Sales Month-over-Month | -7.30 | -2.10 | -4.70 |
| Pending Home Sales Year-over-Year | -11.30 | - | -16.70 |
| EIA Weekly Crude Oil Inventory | 4.7m | - | 3.4m |
| EIA Weekly Gasoline Inventory | 1.8m | - | 5.2m |
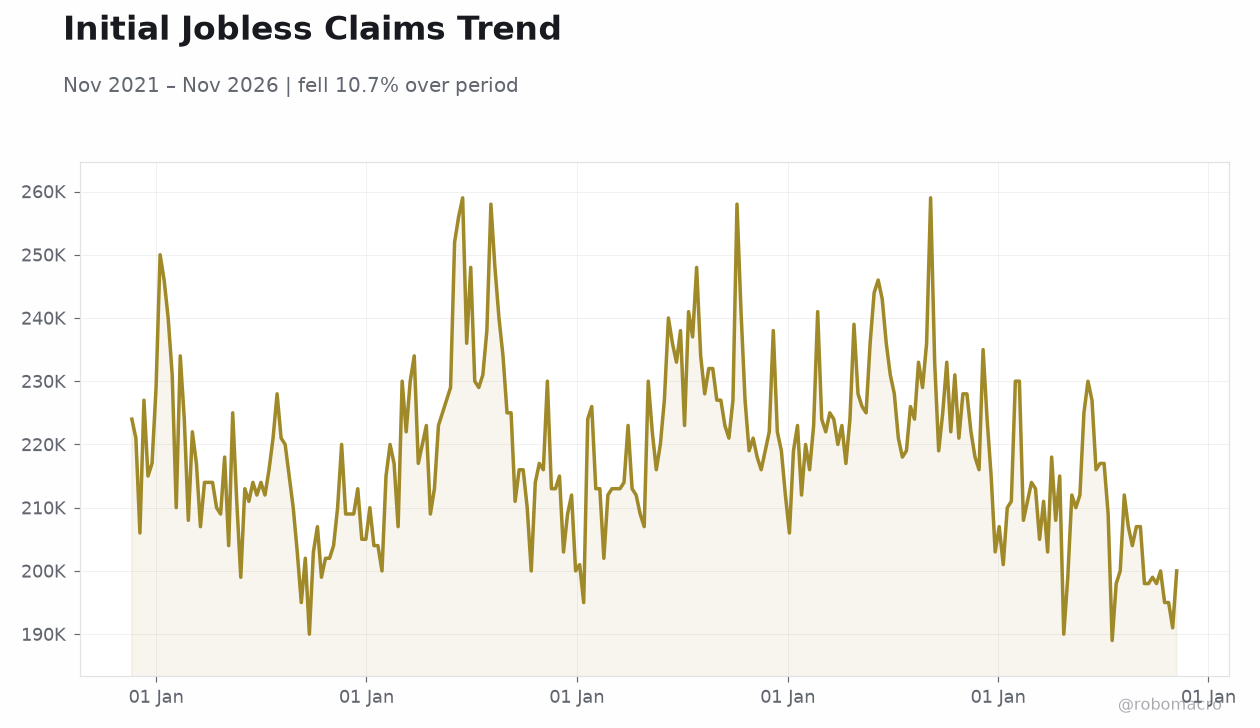 Initial Jobless Claims Trend | Type: macro_line | Initial Claims (thousands): 2e+05 (2026-11-07) | Range: 1.89e+05–2.59e+05 | Trend(5pt): 2.24e+05,2.17e+05,2.16e+05,2.33e+05,2e+05
Today's Economic Events
| Data | Prior | Cons | Time |
|---|---|---|---|
| Philadelphia Fed Manufacturing Index | 20.90 | 20 | 08:30 |
| Weekly Jobless Claims | 200,000 | 197,000 | 08:30 |
| Fed Hammack Speech | - | - | 08:50 |
| Fed Goolsbee Speech | - | - | 12:30 |
| Speech by Fed's Barr | - | - | 14:15 |
| Speech by Fed's Barkin | - | - | 16:00 |
| Speech by Fed's Paulson | - | - | 18:30 |
- Housing data disappointed across the board, with pending home sales falling 4.7% MoM and 16.7% YoY as mortgage rates climbed to 7.35%.
- FOMC October minutes revealed broad concern over financial system risks tied to the AI boom, weighing on sentiment.
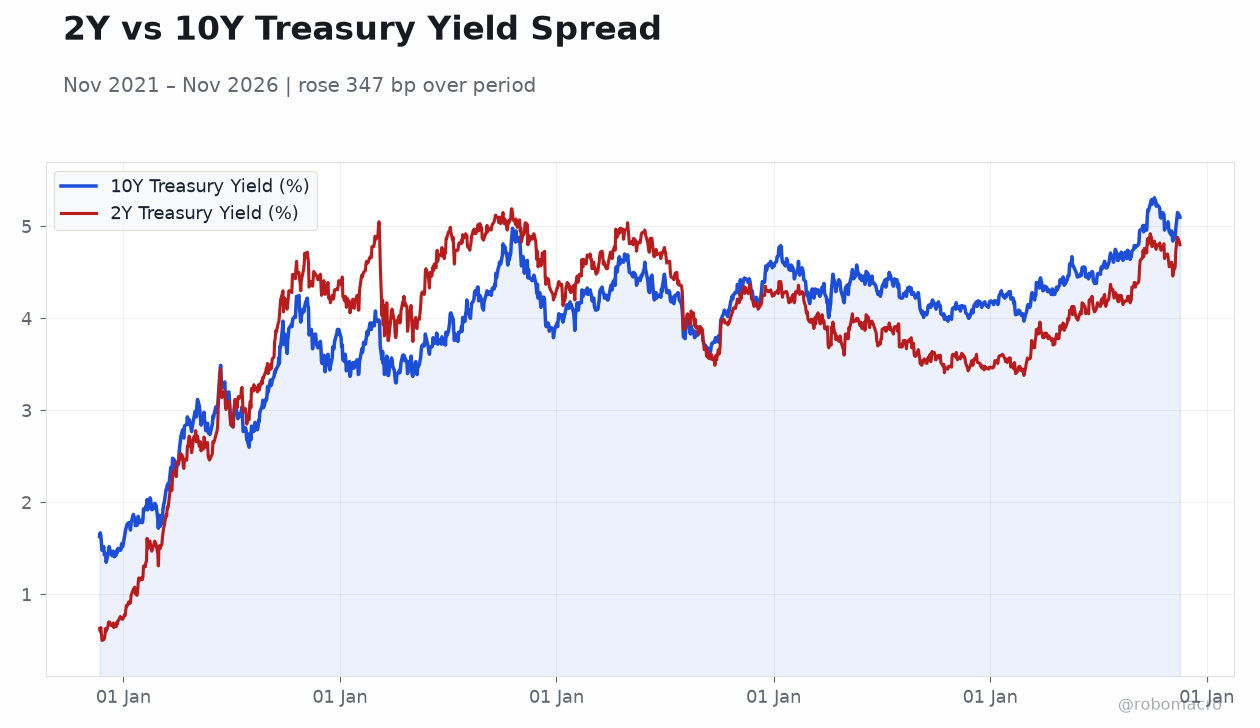
- The 10-year Treasury yield eased 3 bp to 5.07% while the 2-year held at 4.80%, keeping the curve historically flat.
Yesterday's Recap
US housing indicators painted a deteriorating picture Wednesday. The NAHB Housing Market Index fell to 25 from 29, signaling deepening builder pessimism, while building permits dropped to 1.295 million against a 1.38 million consensus. Housing starts rose to 1.309 million, beating expectations, but pending home sales declined 4.7% MoM and 16.7% YoY, far worse than the 2.1% monthly decline forecast.
The MBA 30-year mortgage rate climbed to 7.35% from 7.21%, compounding affordability pressure. Atlanta Fed GDPNow was revised down to 3.2% from 3.4%. Net long-term TIC flows came in at $155.3 billion, below the $160.7 billion consensus.
Equity markets diverged sharply: the Dow fell 1.11% while the Nasdaq 100 gained 0.42%, and the S&P 500 slipped 0.23% for a fifth straight decline.
The Day Ahead
Thursday's calendar centers on labor market and inflation data. Initial jobless claims and the Philadelphia Fed manufacturing index are due at 8:30 ET, offering a read on both employment conditions and regional factory activity. Existing home sales follow at 10:00 ET, a timely complement to Wednesday's weak pending sales print.
The Conference Board leading indicators index is also scheduled. Fed speakers remain active, with additional remarks expected following Wednesday's Williams and Barr appearances. Markets will parse these releases for confirmation that the labor market remains resilient despite housing weakness.
Other Economic Notes
The housing sector is emerging as the clearest soft spot in an otherwise resilient economy, with mortgage rates at 7.35% squeezing affordability and builder confidence at multi-year lows. Consumer spending remains firm, with retail sales up 6.82% YoY, and unemployment at 4.10% shows no sign of rapid deterioration. GDP growth of 3.40% annualized in Q2 and a GDPNow tracking estimate of 3.2% suggest momentum persists into year-end.
The tension between solid activity data and housing weakness complicates the policy outlook. Separately, the Bipartisan Policy Center estimates the US could hit its debt limit by February, reintroducing fiscal brinkmanship as a 2027 risk.