Opening Theme: Navigating Geopolitical Turbulence in a Fragile Global Cycle
As we survey the global macro landscape for the week ending March 27, 2026, the dominant narrative revolves around heightened geopolitical risks stemming from the ongoing Iran war and broader Middle East tensions, which have injected volatility into commodity markets and spilled over into financial assets worldwide. We note that this week's developments underscore a global economy still grappling with the late stages of a post-pandemic recovery, where uneven growth signals are compounded by external shocks. Brent crude prices, for instance, declined 5.2% to 106.36 in the Eurozone context, reflecting hopes for de-escalation, yet WTI crude rose 2.57% to 100.85 in the US, highlighting persistent supply concerns that could sustain inflationary pressures. This divergence in oil benchmarks illustrates the precarious balance: while some regions benefit from easing energy costs, others face amplified import risks, as seen in the UK's Brent crude drop of 5.01% to 106.57, which contributed to sterling's 1.15% weekly depreciation against the dollar.
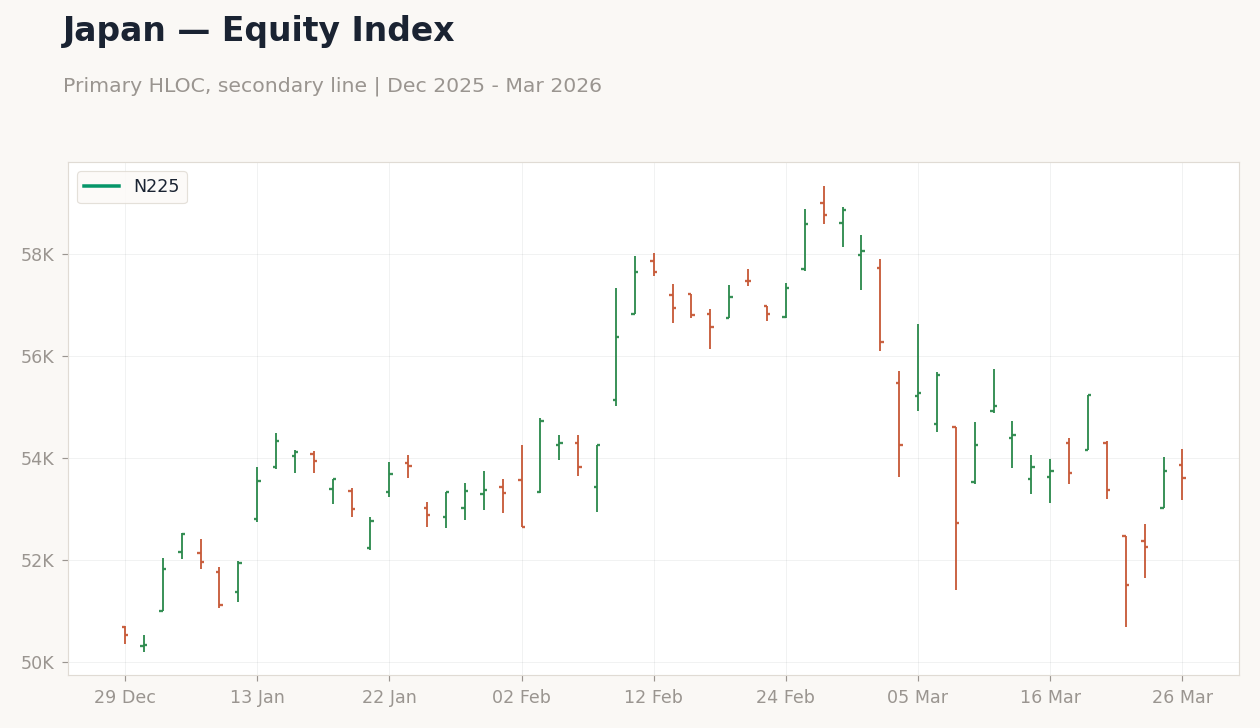
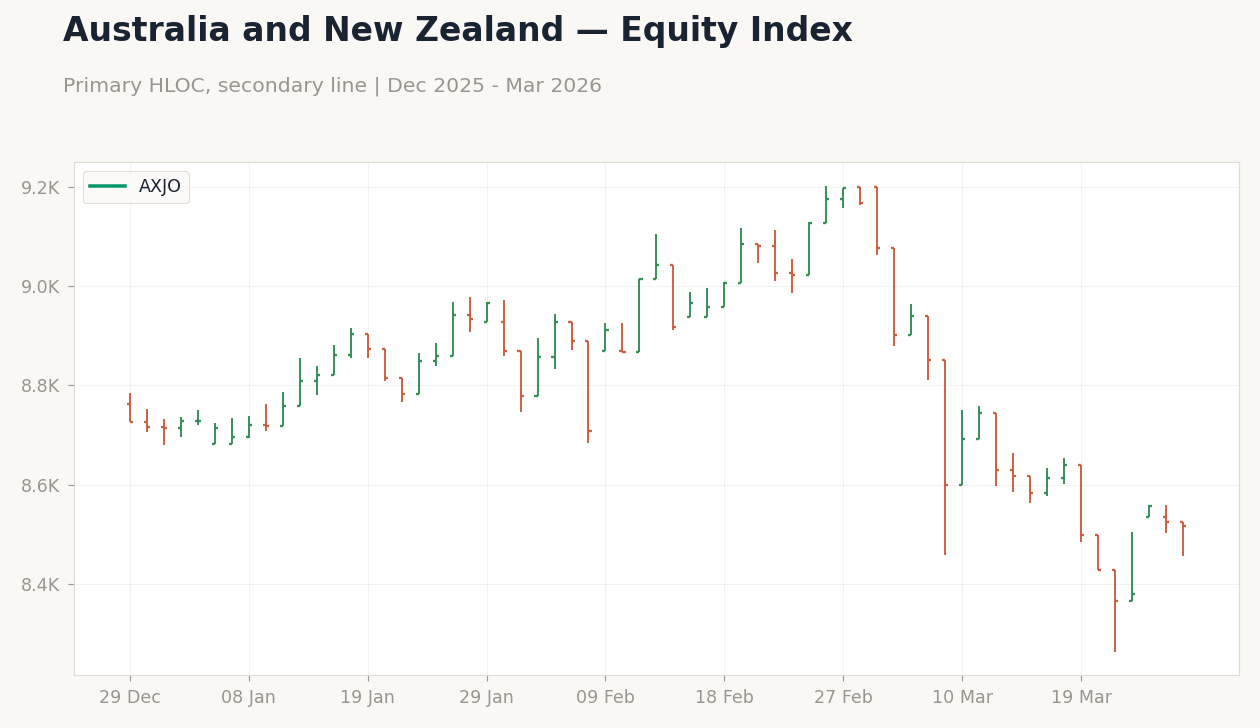
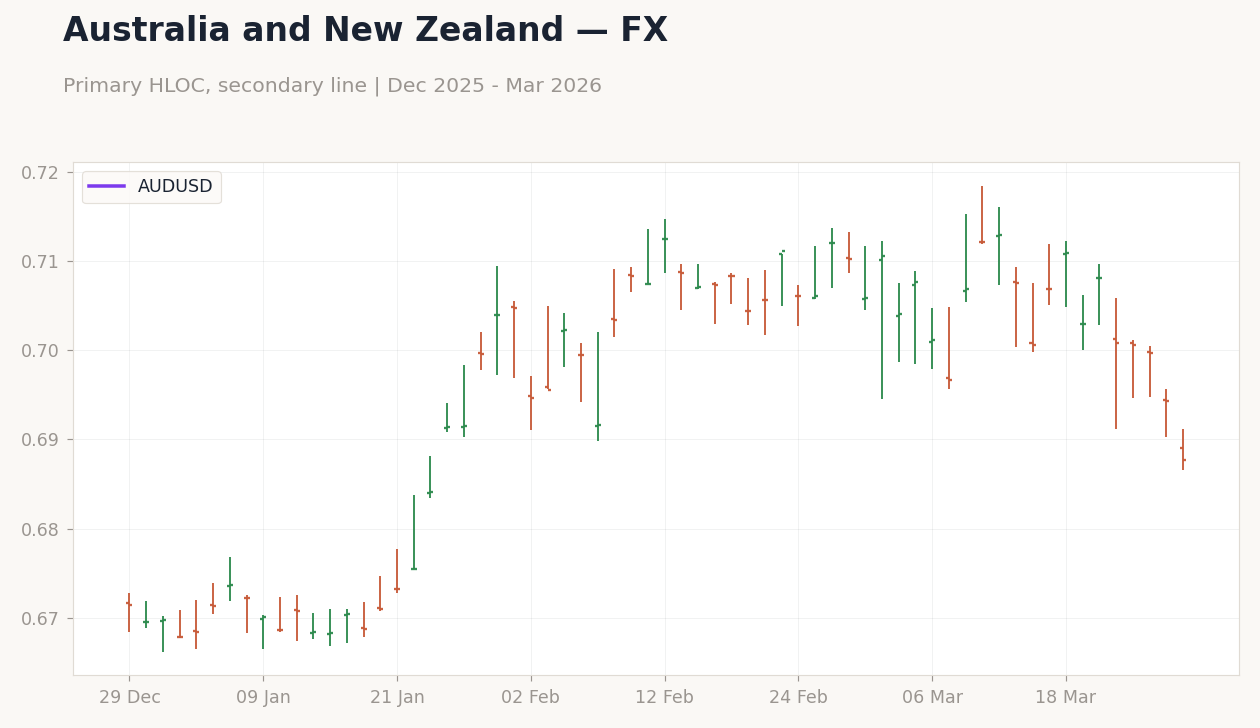
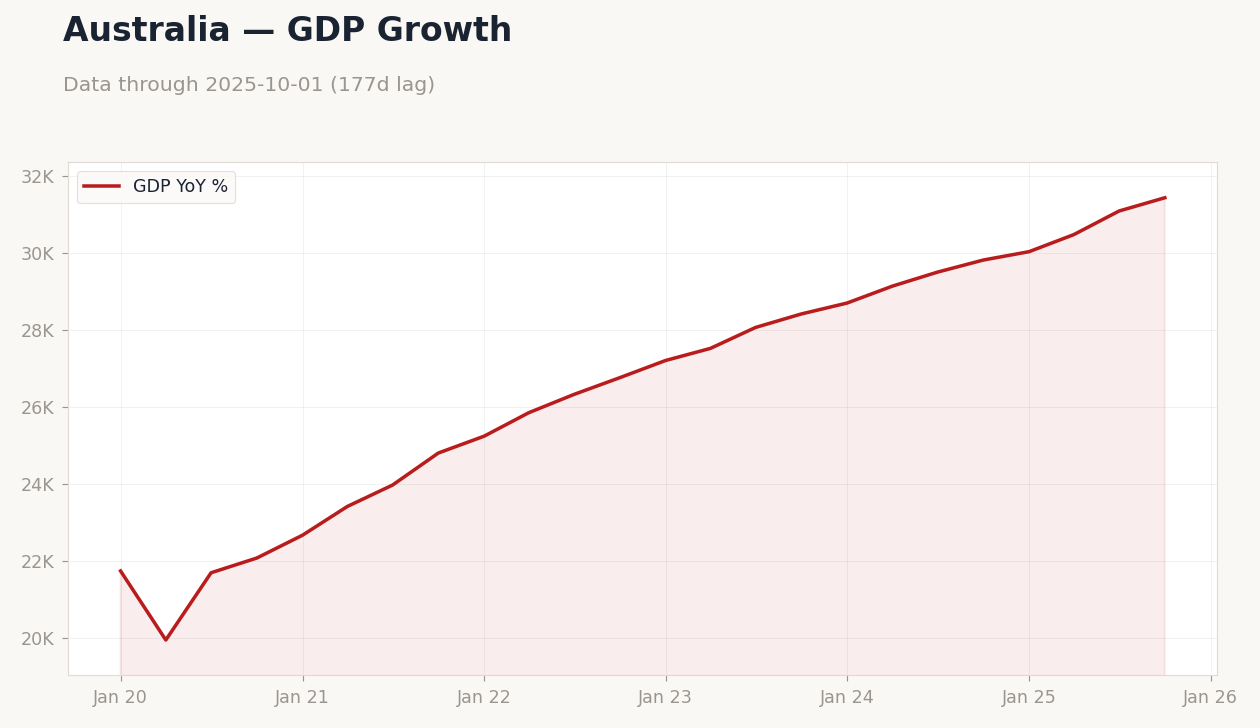
The data suggests we are in a transitional phase of the global cycle, characterized by moderating inflation in key economies but persistent sticky price dynamics elsewhere. In Japan, headline inflation eased below prior readings, with core inflation slowing versus consensus, signaling a potential pivot toward normalization as the Nikkei 225 rallied 4.05% to 53,603.65 early in the week before closing down 3.0% overall. Similarly, Australia's inflation cooled more than expected, yet flash PMIs disappointed with services dropping into contraction, underscoring softening demand that tempered the RBA's hawkish tone. Across emerging markets, commodity strength provided a buffer; for example, copper rose 2.31% to $5.47 per pound, supporting Andean equities like MSCI Peru's 3.24% gain to 76.68. However, this was offset by broader risk-off flows, evident in Bitcoin's 6.53% decline to 65,918.22 amid geopolitical jitters.
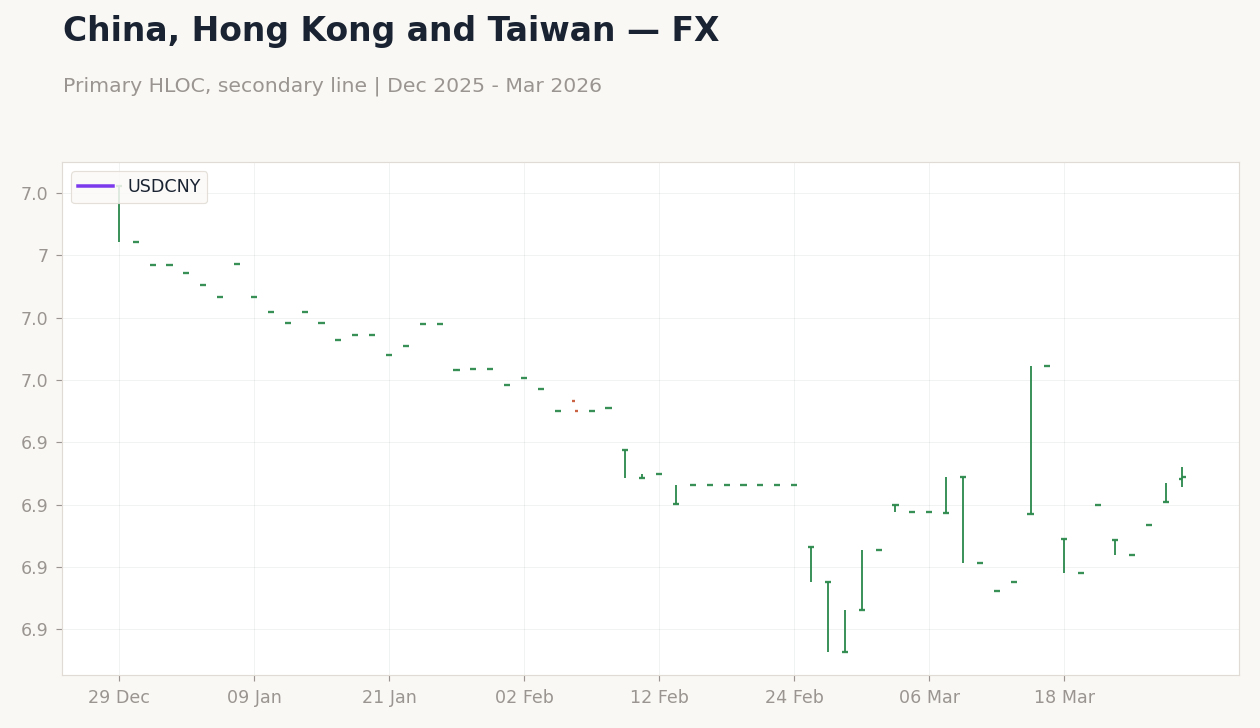
We observe that these tensions are exacerbating divergences in the global recovery trajectory. Developed markets showed mixed PMI signals, with Germany's manufacturing PMI beating consensus, yet the UK's services PMI disappointed below expectations, highlighting uneven momentum amid cost pressures. In emerging Asia, the PBoC allowed USD/CNY to rise 0.16% to 6.91, tolerating mild yuan depreciation to stabilize credit amid Brent's 5.35% drop to 106.19. This week's narrative thus points to a world where geopolitical risks are not only driving asset volatility but also complicating policy responses, as central banks weigh easing inflation against potential energy-driven reacceleration. Gold's 0.84% decline to 4532.1 in the US, despite haven demand, further reflects investor caution, suggesting a cycle where growth fears are tempered but not eclipsed by tail risks. Looking ahead, if Middle East de-escalation materializes, it could alleviate some pressures, but persistent volatility—as seen in oil's weekly swings—may prolong the global economy's fragile balancing act through Q2 2026.
DM Theme: Uneven Recovery Signals Amid Rising Yields and Policy Caution
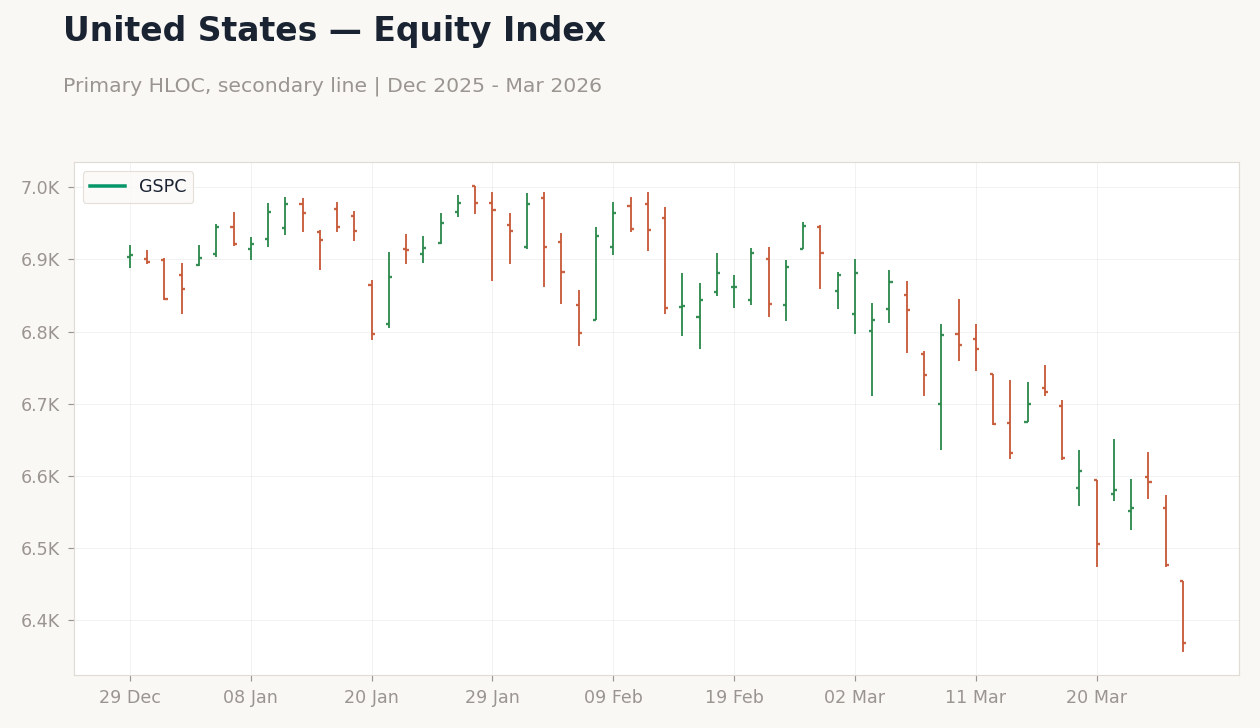
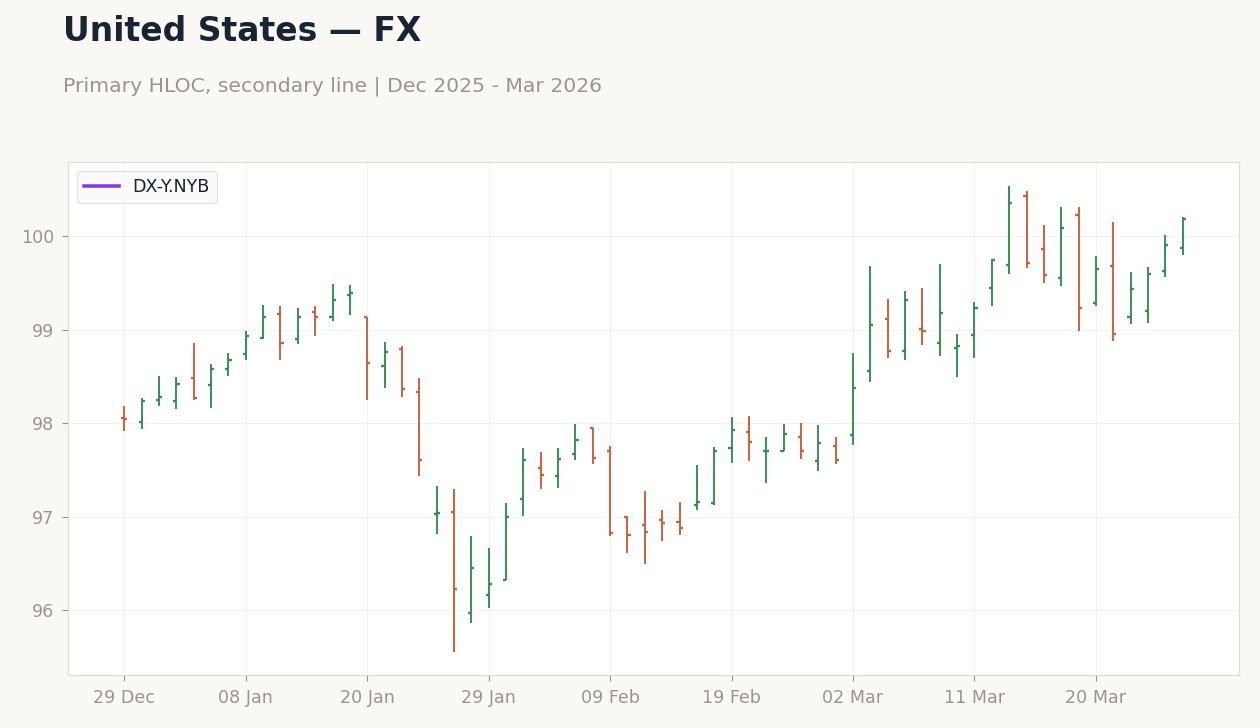
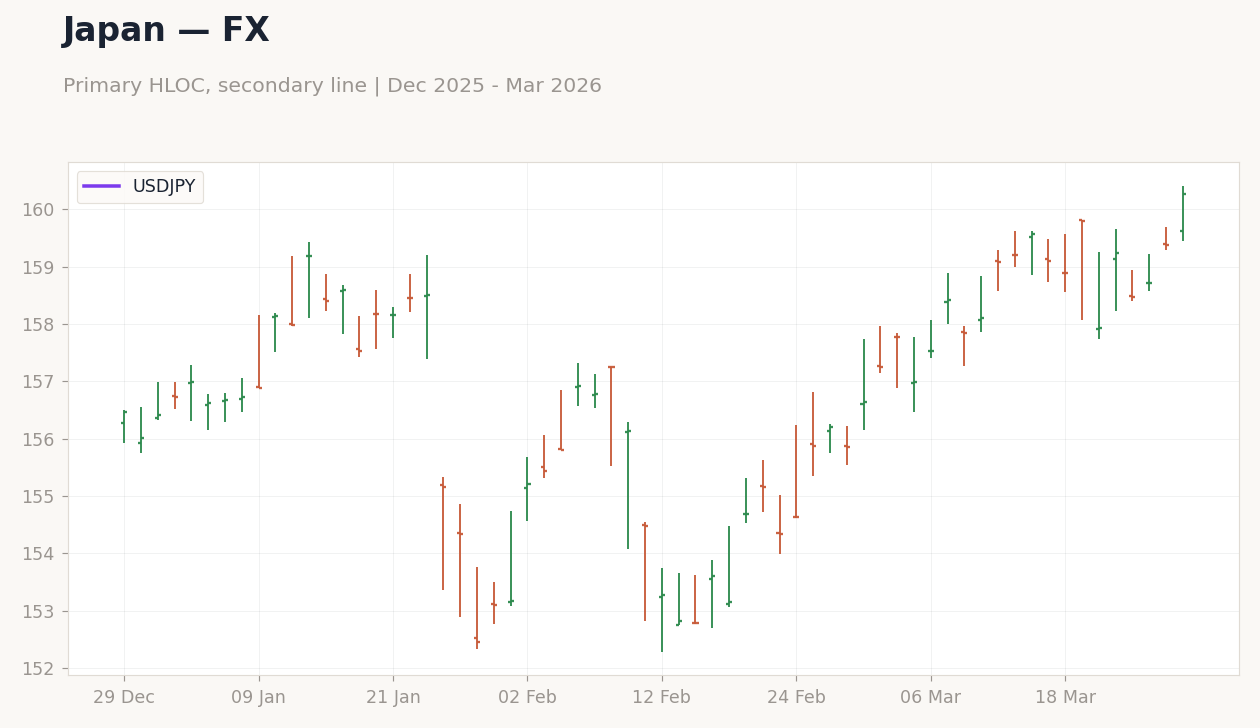
In developed markets, the week's data revealed a patchwork of economic resilience overshadowed by geopolitical spillovers, with implications for monetary policy diverging across the US, Eurozone, Japan, and UK. We note that US equity markets exhibited volatility, with the S&P 500 falling 2.1% to 6,369, while the dollar strengthened, pushing USD/JPY up 1.5% to 160.25. This dollar rally, coupled with a 5bp rise in 10Y Treasury yields to 4.44%, suggests markets are pricing in sustained Fed caution amid mixed signals; for instance, WTI's 2.57% gain to 100.85 underscores supply risks that could delay rate cuts beyond the current OIS-implied path.
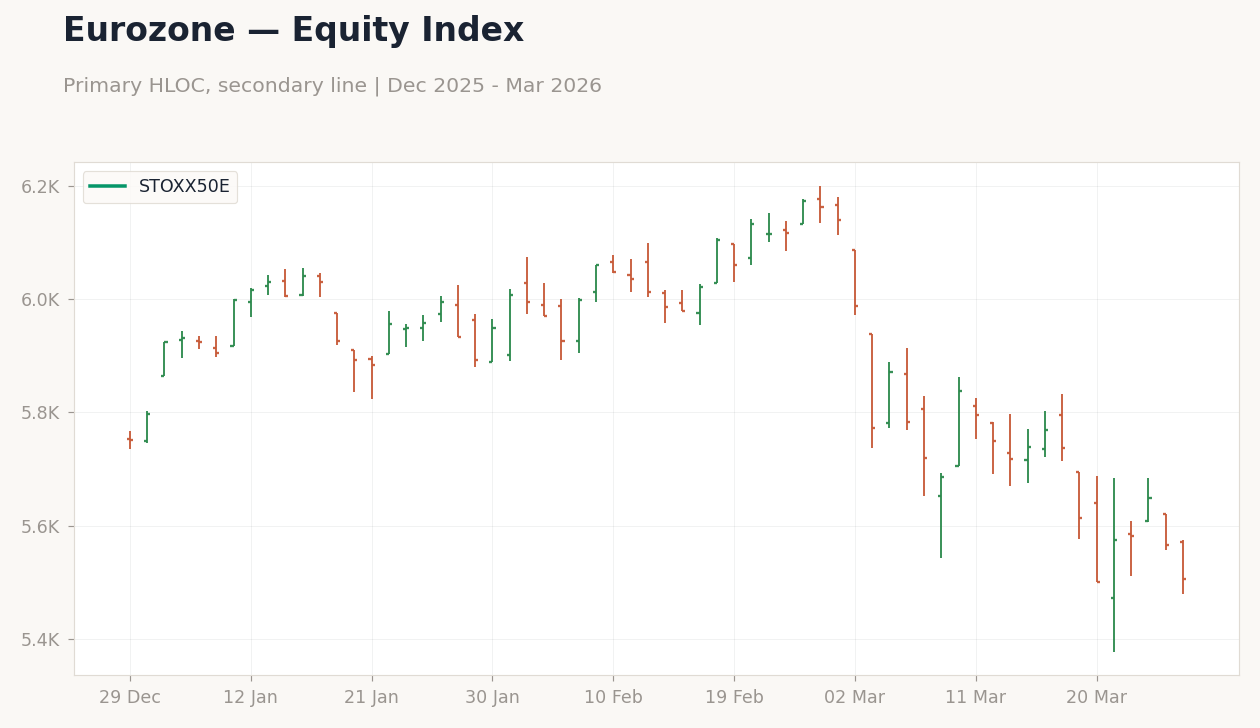
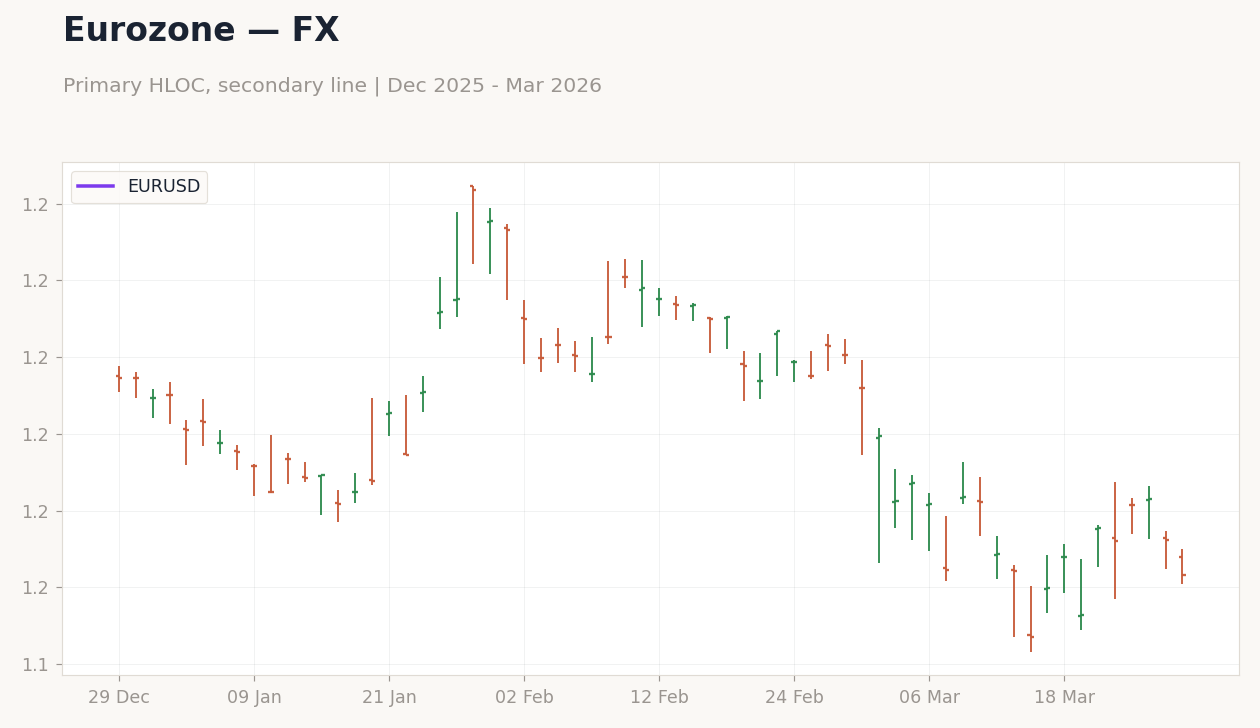
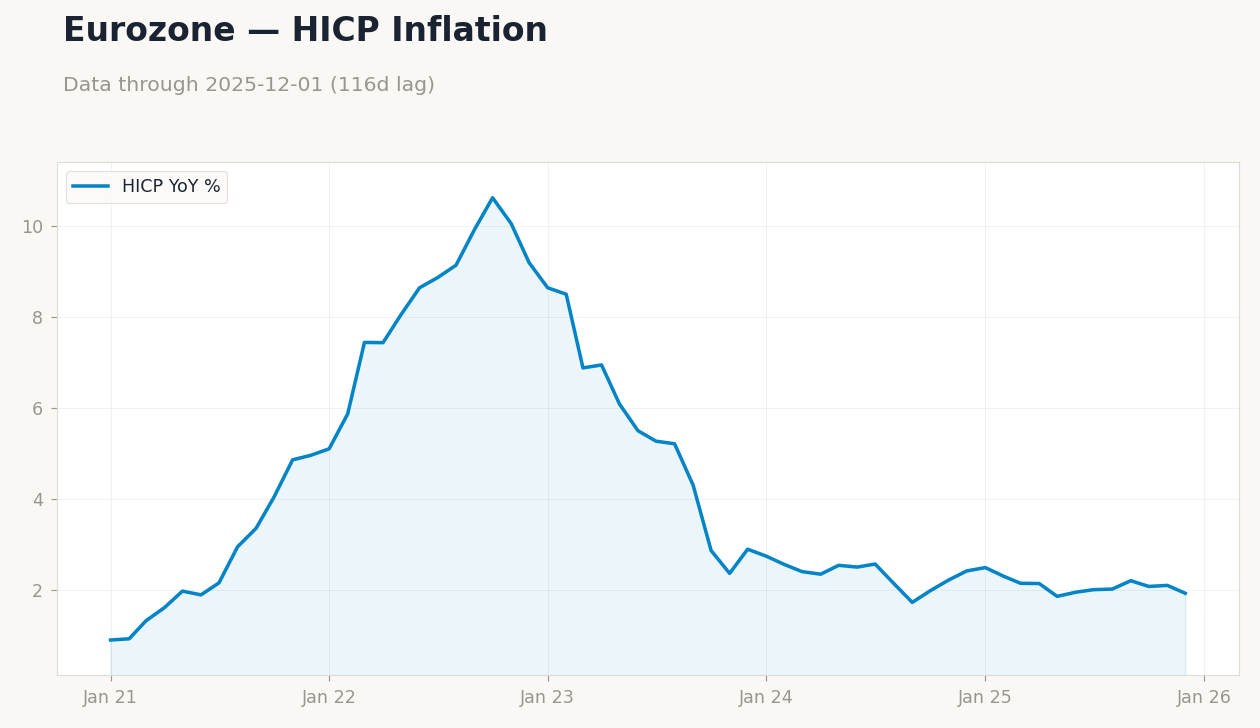
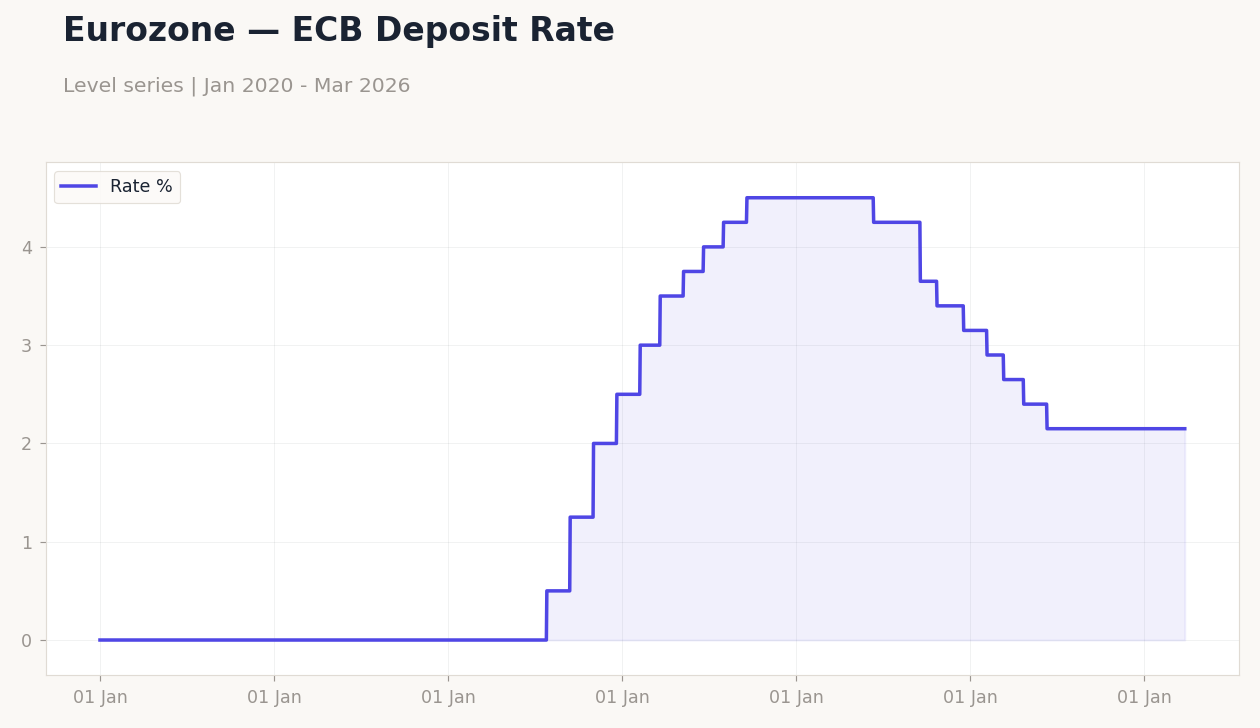
In the Eurozone, PMIs delivered mixed messages, as German manufacturing beat consensus, yet overall consumer confidence fell, intensifying dovish ECB expectations that drove German 10Y Bund yields down, though globally yields rose with France's 10Y up 15bp to 3.80%. Equities edged higher modestly, with the Euro Stoxx 50 up 0.1% to 5,506, but EUR/USD declined 0.6% to 1.1511, pressured by Brent's 5.2% drop to 106.36. This points to an uneven recovery, where energy concerns from the Iran war could prolong ECB easing bets into mid-2026, potentially widening spreads with the Fed.
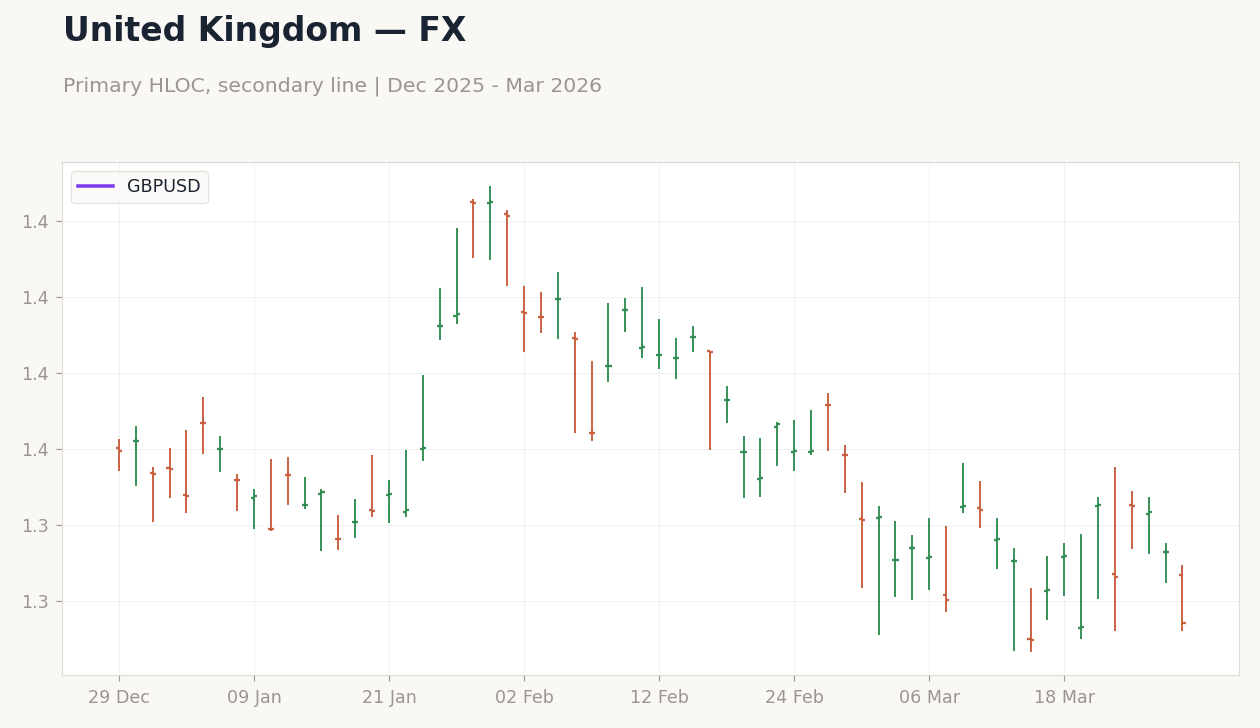
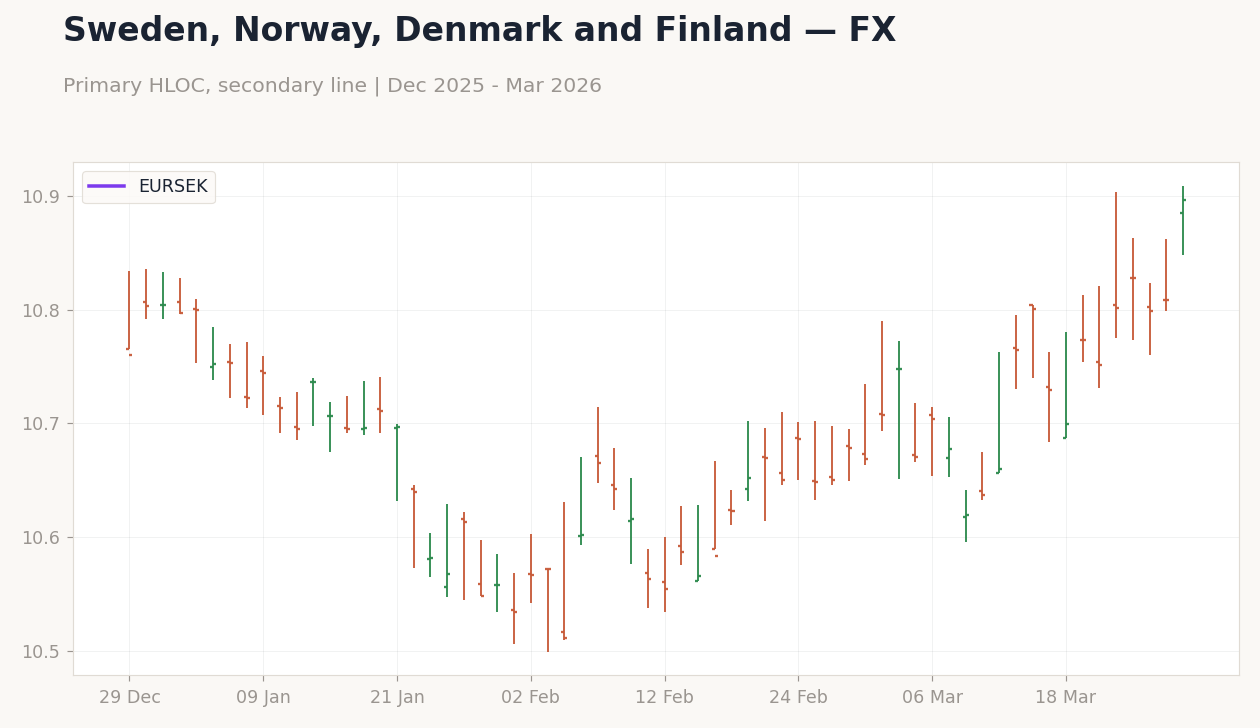
Japan's narrative centered on moderating inflation, with core measures slowing, as Bank of Japan minutes indicated no immediate hikes, tempering OIS pricing despite the Nikkei 225's initial 4.05% rally to 53,603.65 before a 3.0% weekly close. In the UK, core inflation edged higher than expected, prompting BoE Chief Economist Pill's emphasis on inflation risks, which aligned with a 13bp rise in 10Y Gilt yields to 4.92% and GBP/USD's 1.2% drop to 1.3261. Nordic markets echoed this caution, with USD/NOK up 2.64% to 9.74 amid Brent's 4.95% decline to 106.64, pressuring energy exporters like Norway, where the Oslo Bors gained 0.77% to 1,981.56.
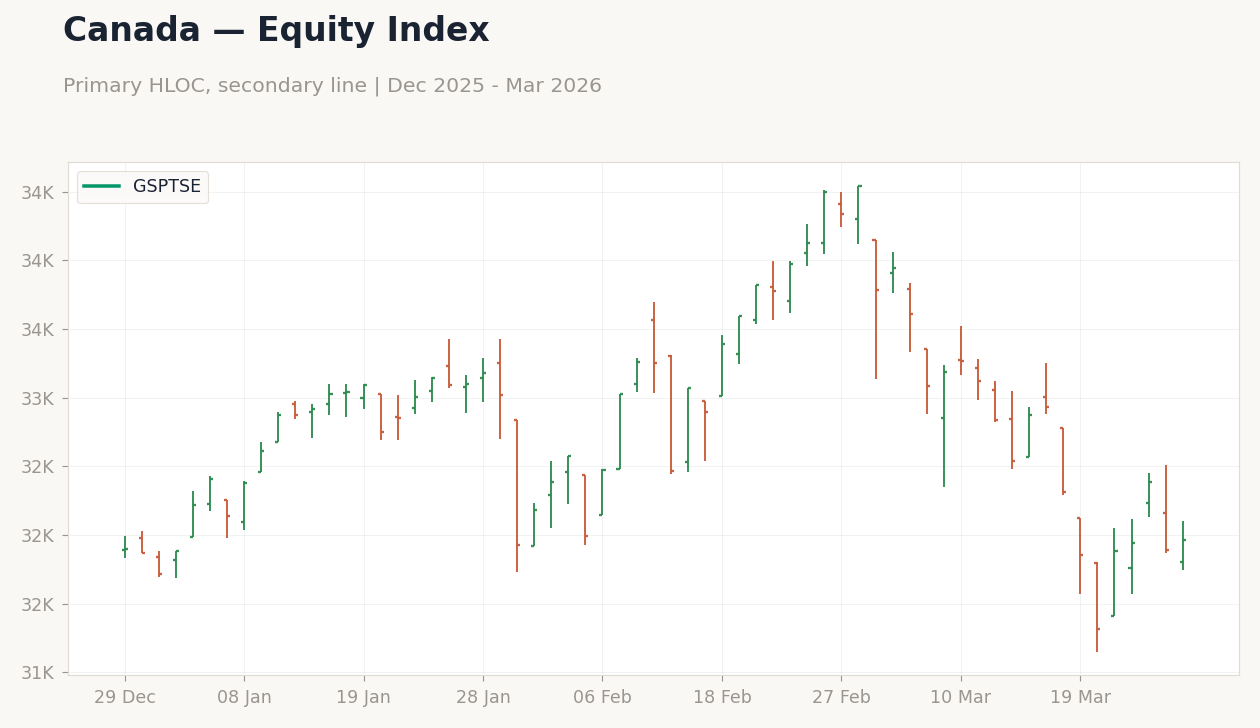
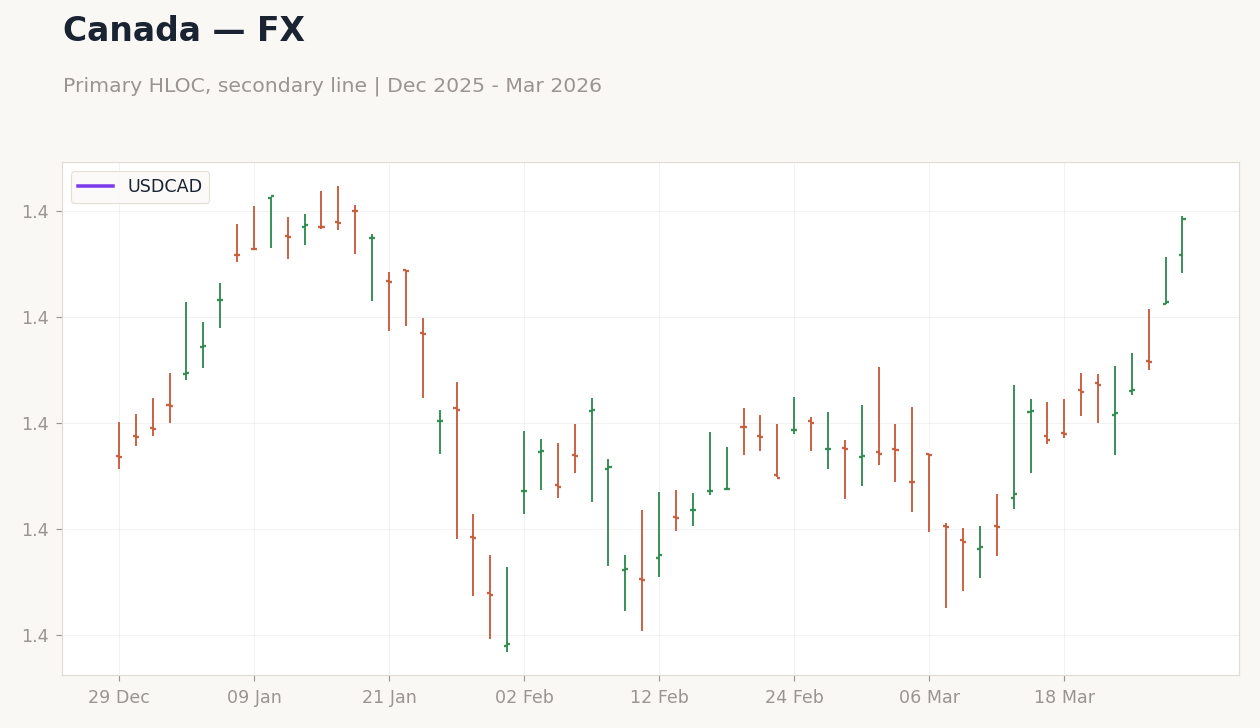
Overall, DM policy implications hinge on these divergences: while the ECB and BoJ lean dovish, the Fed and BoE's hawkish tilts—evident in rising yields like Canada's 10Y up 12bp to 3.56%—suggest a read-across of prolonged higher-for-longer rates, potentially constraining growth if geopolitical risks persist through April 2026.
EM Theme: Commodity Resilience Offsets Currency Pressures
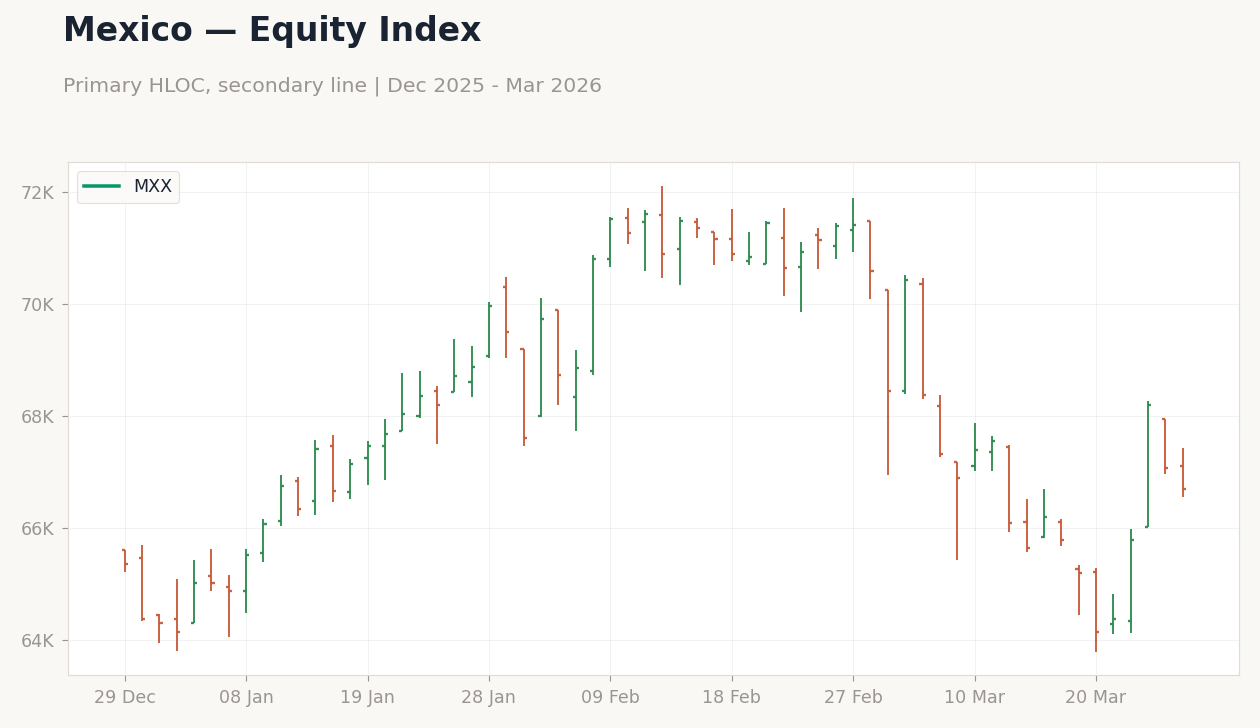
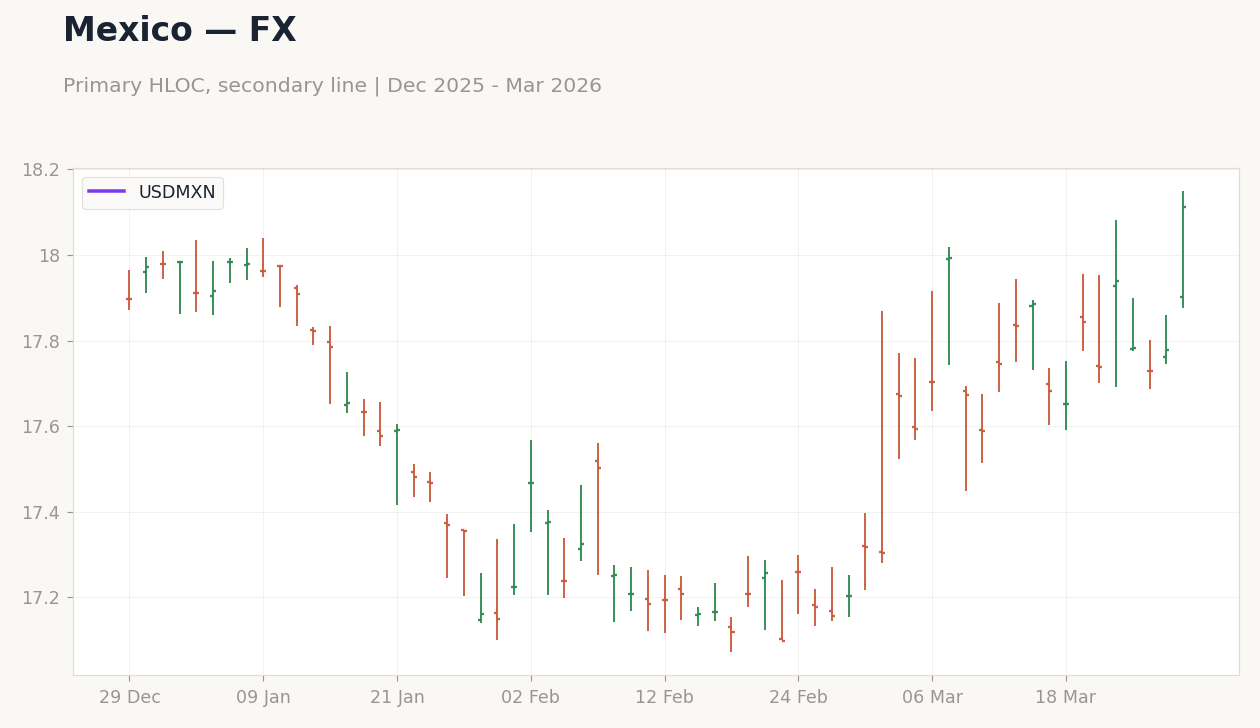
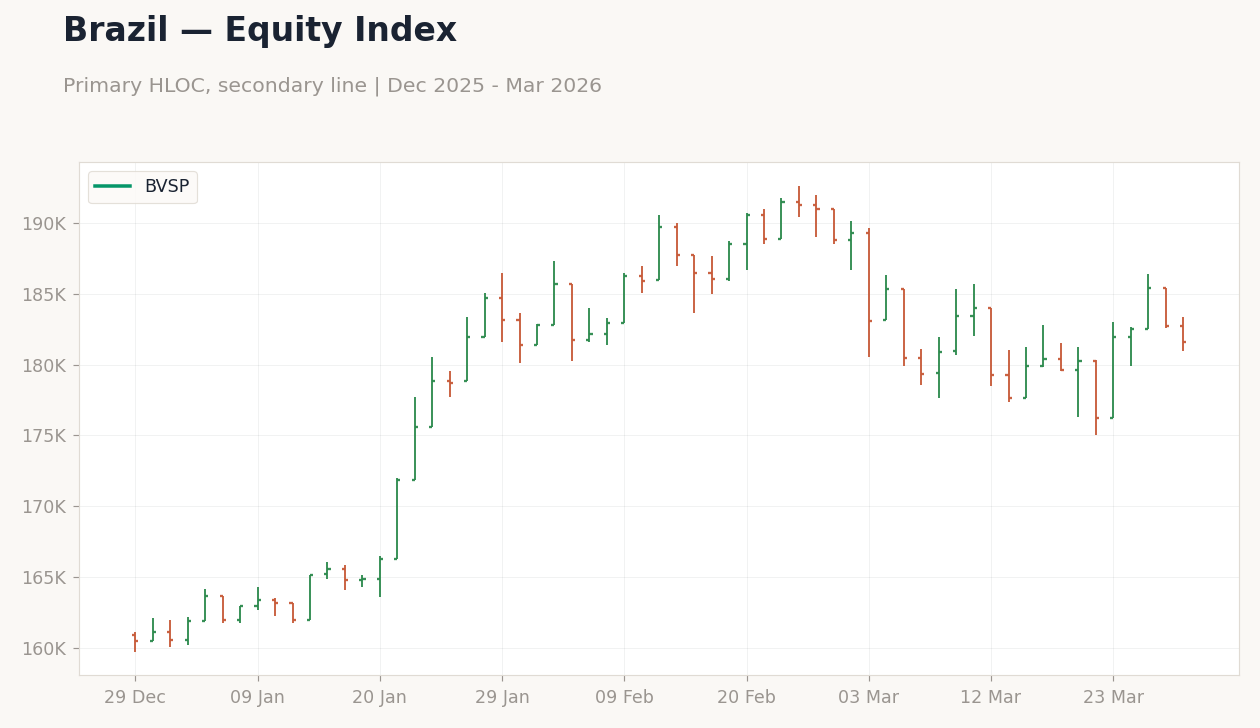
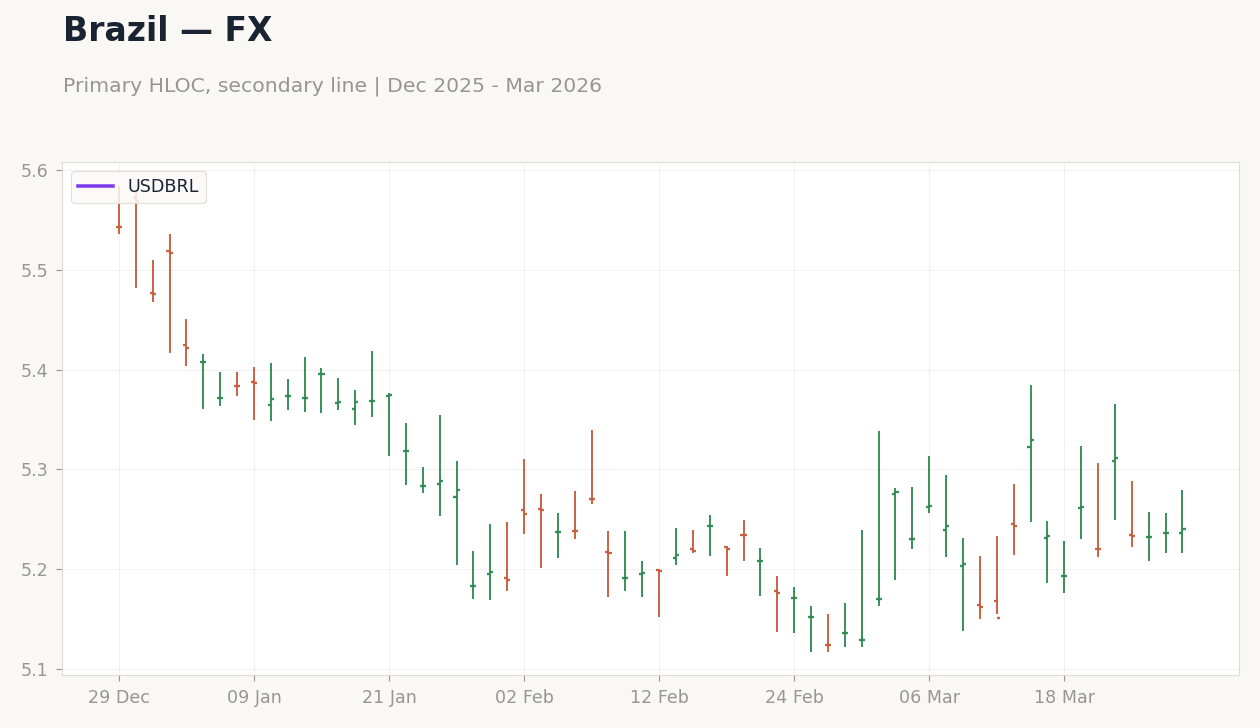
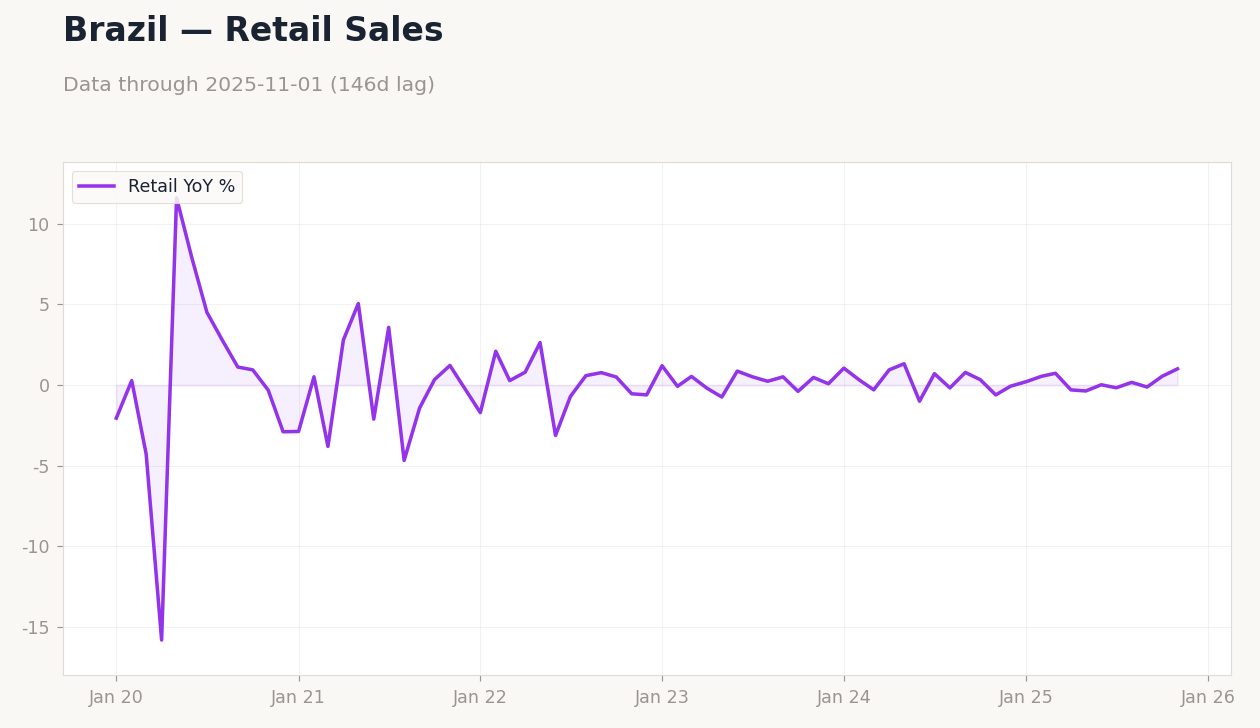
Emerging markets displayed notable resilience in commodity-linked sectors this week, though currency depreciations amplified by dollar strength posed challenges, with policy responses focusing on stability amid geopolitical volatility. In Latin America, equities surged on energy and metals strength; Mexico's IPC Bolsa rose 4.0% to 66,686, supported by WTI's 2.84% gain to 101.11, while USD/MXN declined 6.6% to 65,868.7, reflecting broad dollar dynamics. Brazil's Bovespa advanced 3.0% to 181,557, driven by Vale's 6.98% climb to 15.03 amid iron ore demand, and Petrobras's 2.12% rise to 18.11.
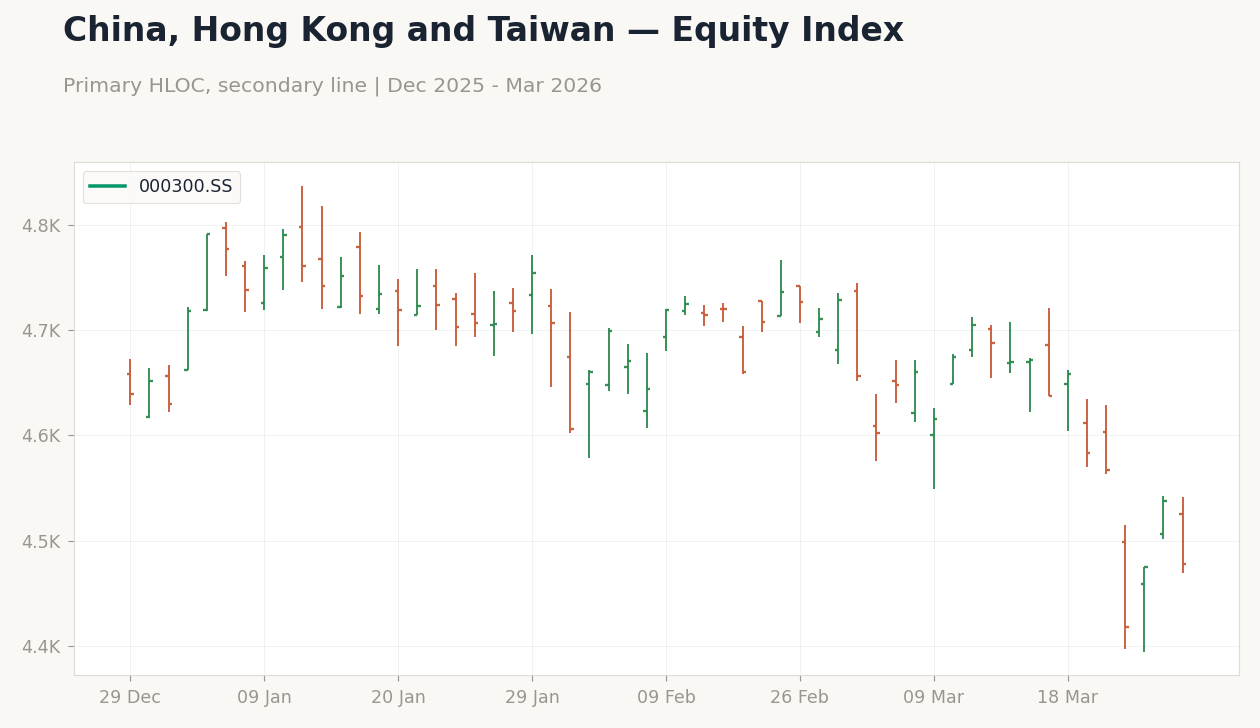
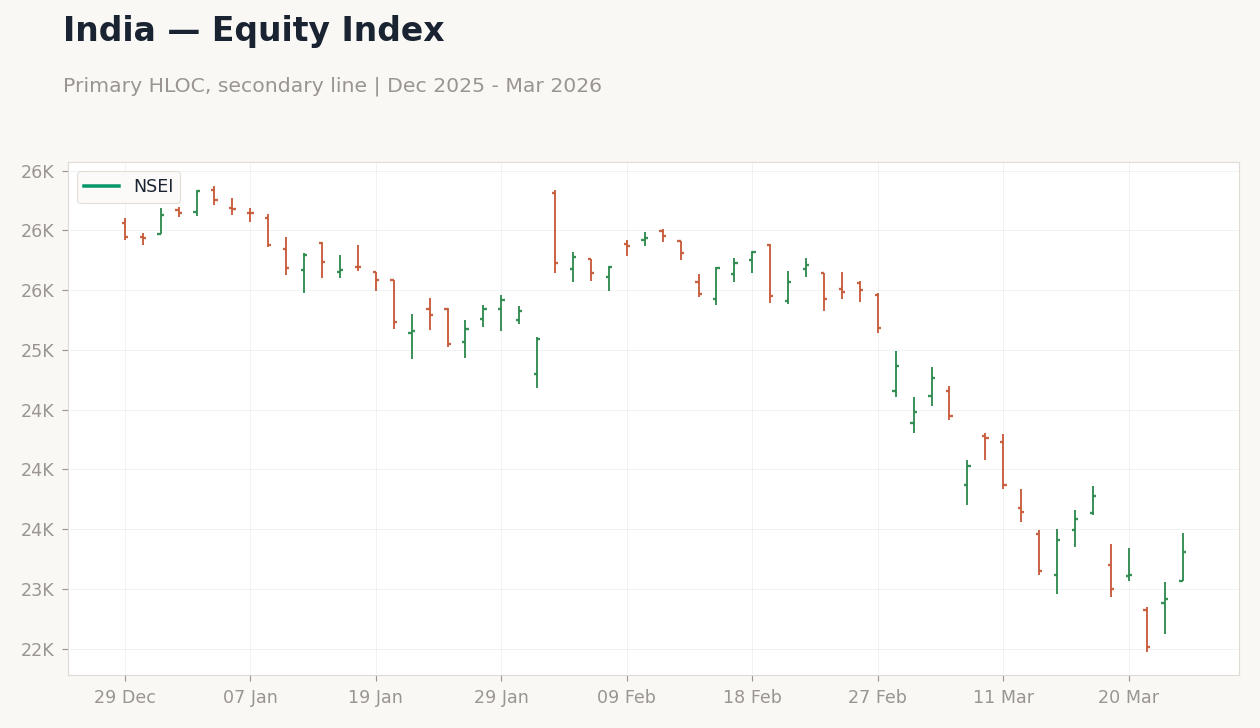
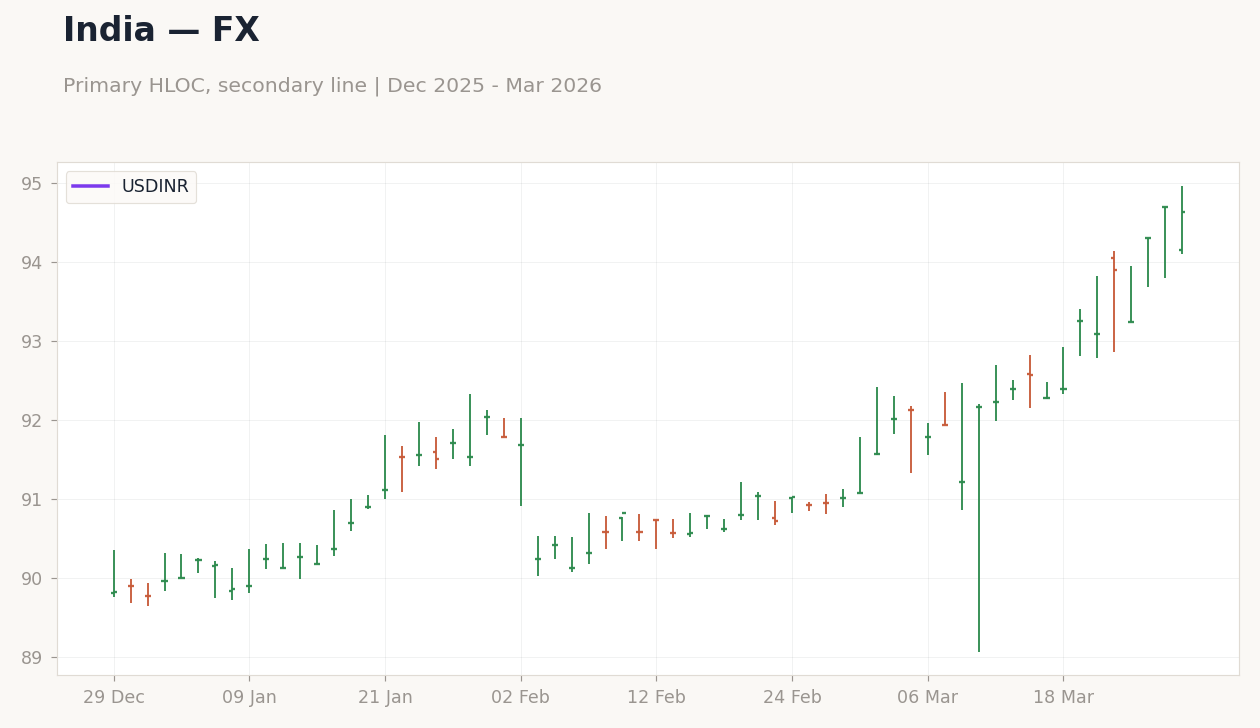
Andean markets benefited from copper's 2.31% increase to $5.47 per pound, lifting MSCI Peru 3.24% to 76.68, though currencies diverged with USD/CLP up 1.12% to 922.71. In Asia, India's Nifty 50 fell 2.0% to 23,306 despite Brent's 5.34% decline to 106.2 easing import pressures, while USD/INR rose 1.66% to 94.63. Greater China's Shanghai Composite dropped 1.72% to 3,889.08, with PBoC allowing USD/CNY to edge up 0.16% to 6.91 for liquidity support.
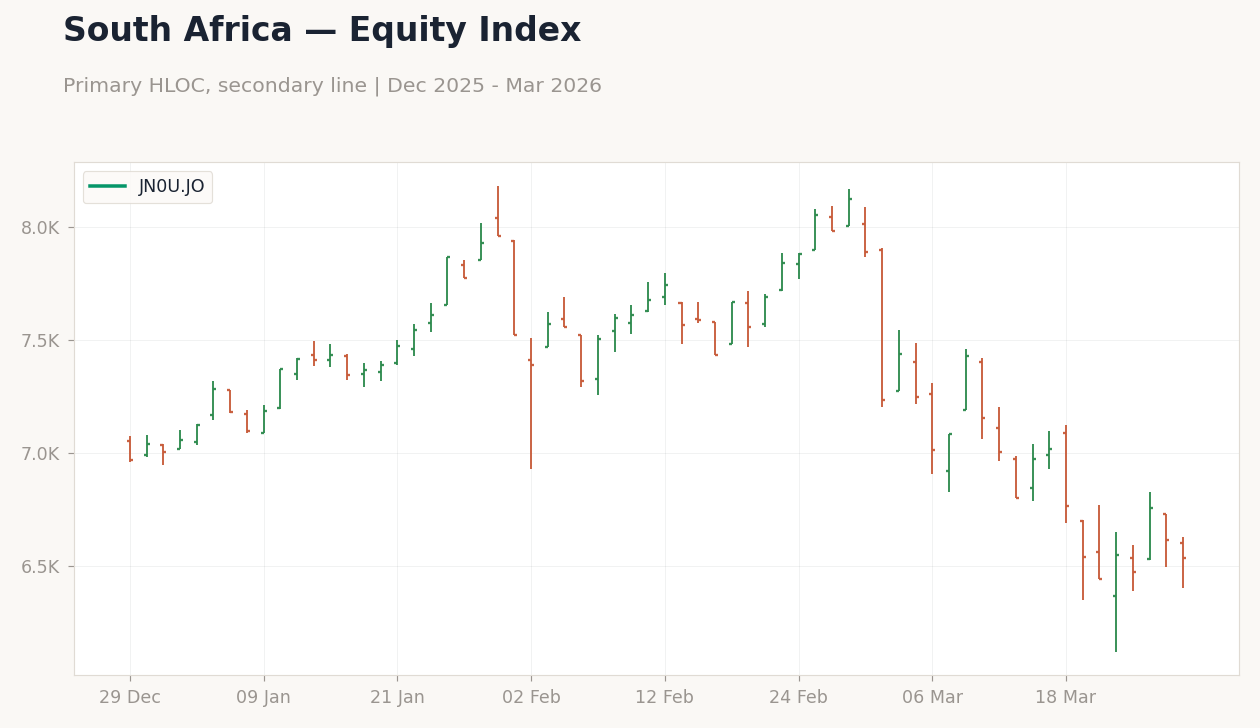
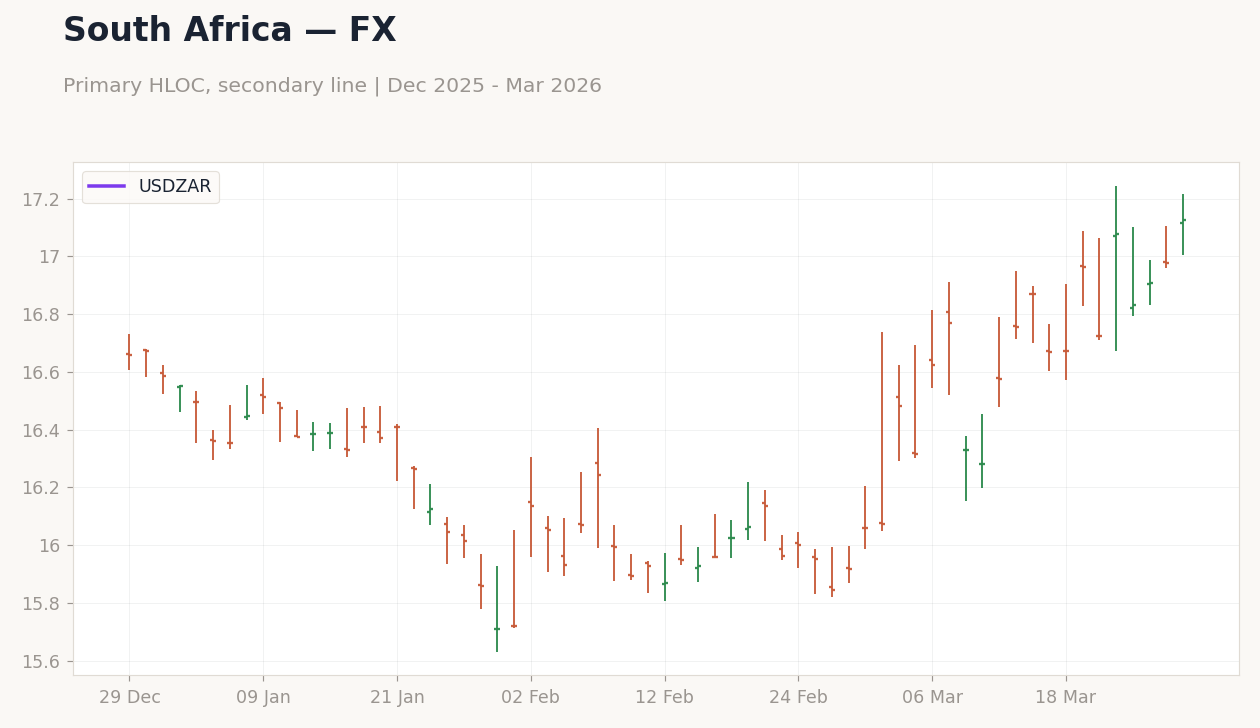
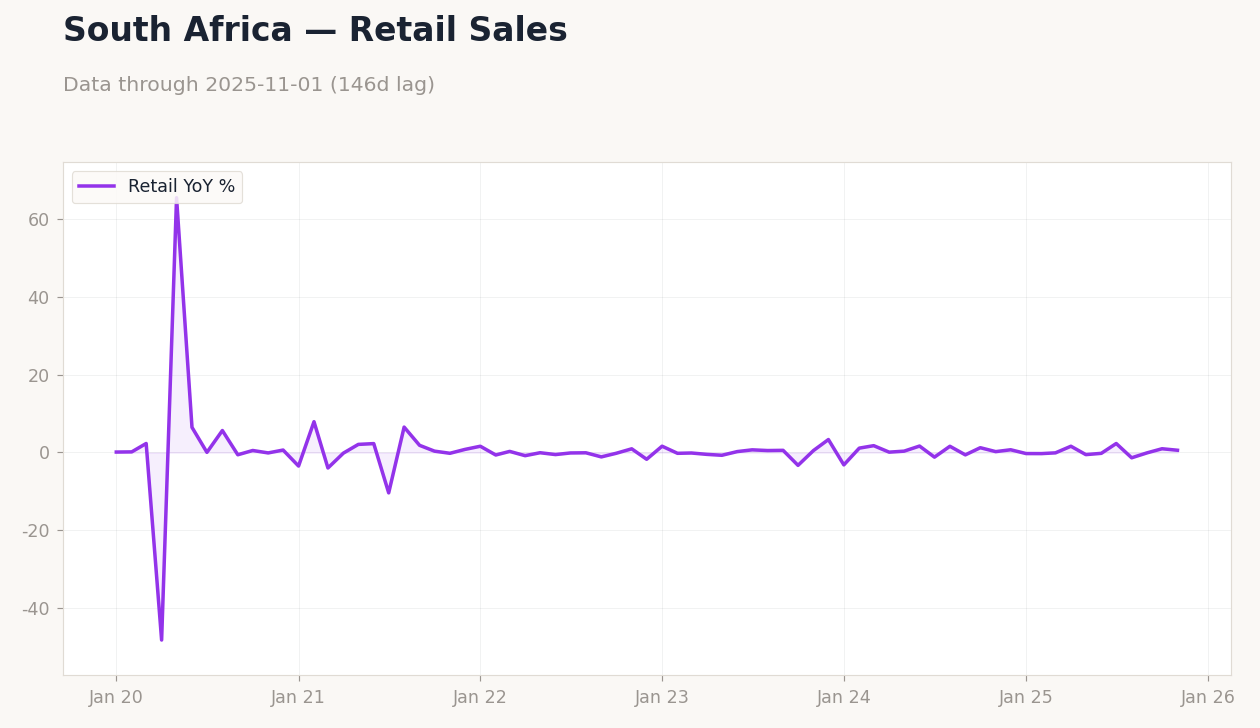
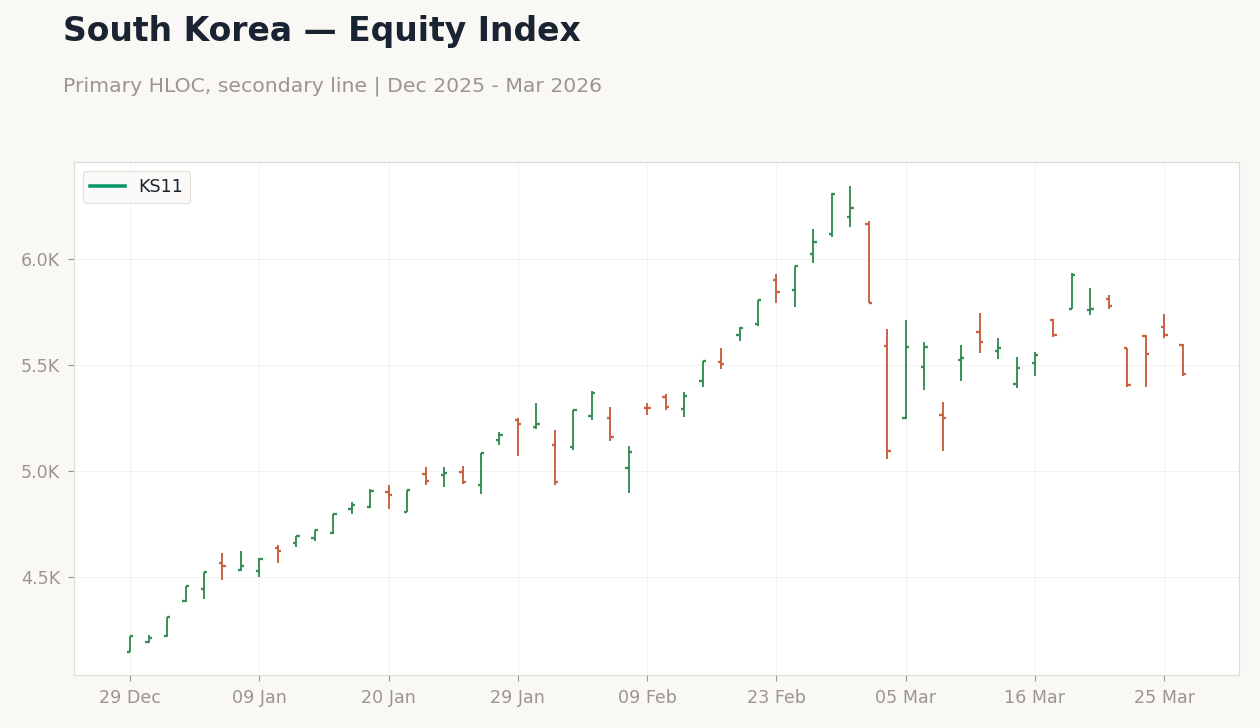
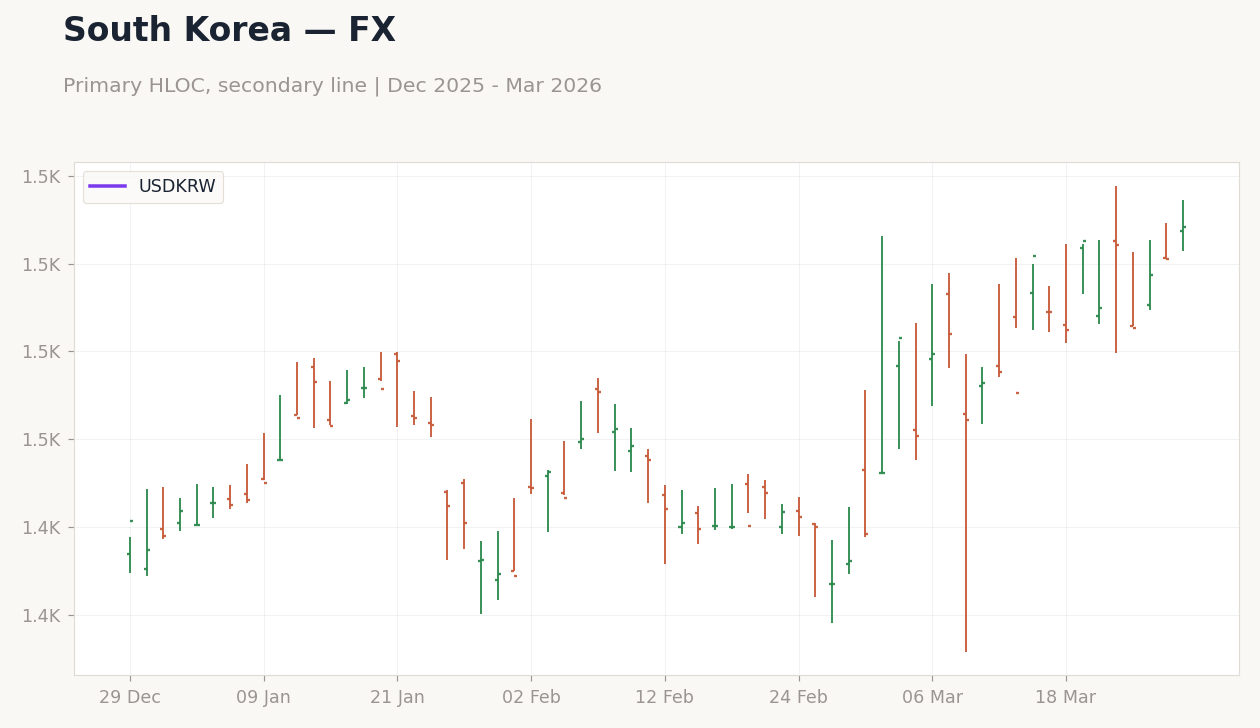
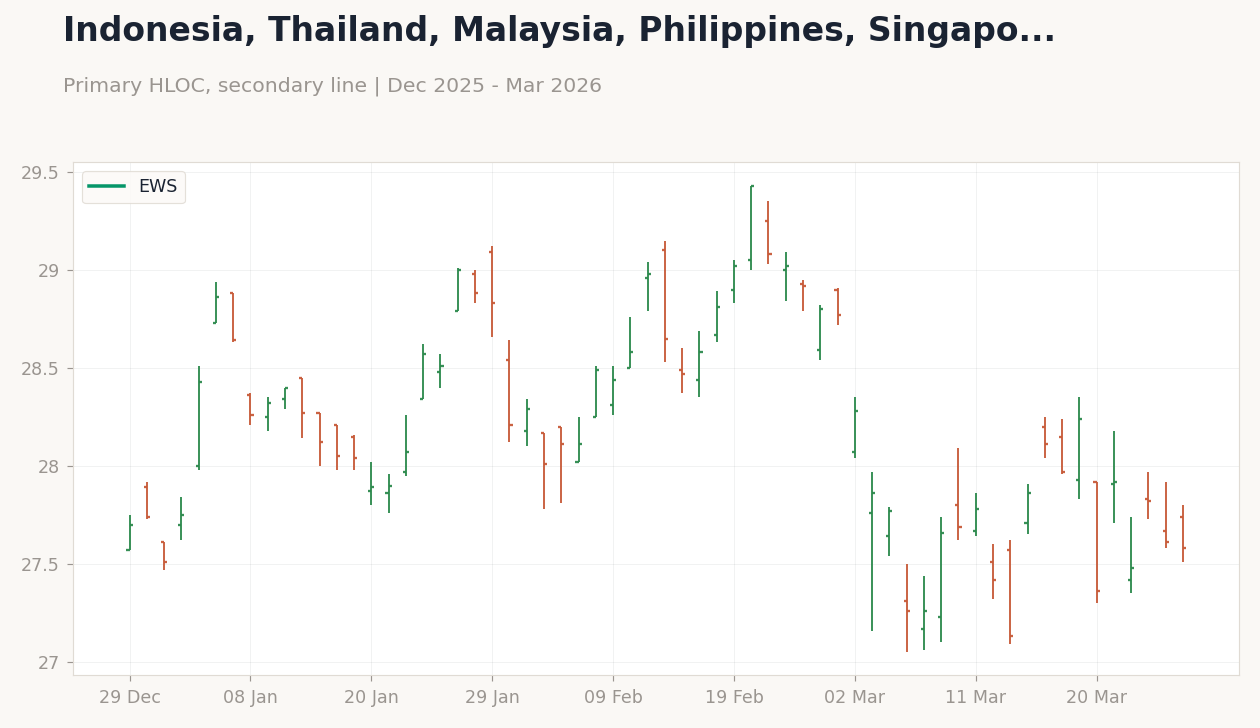
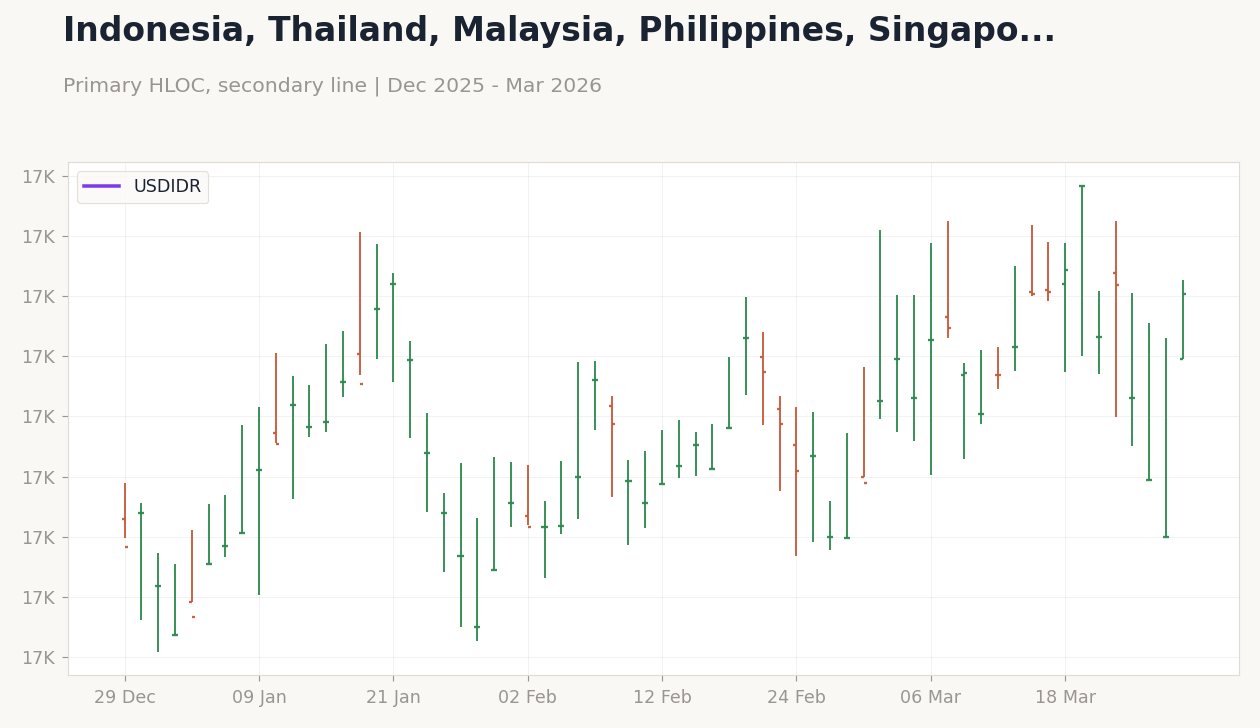
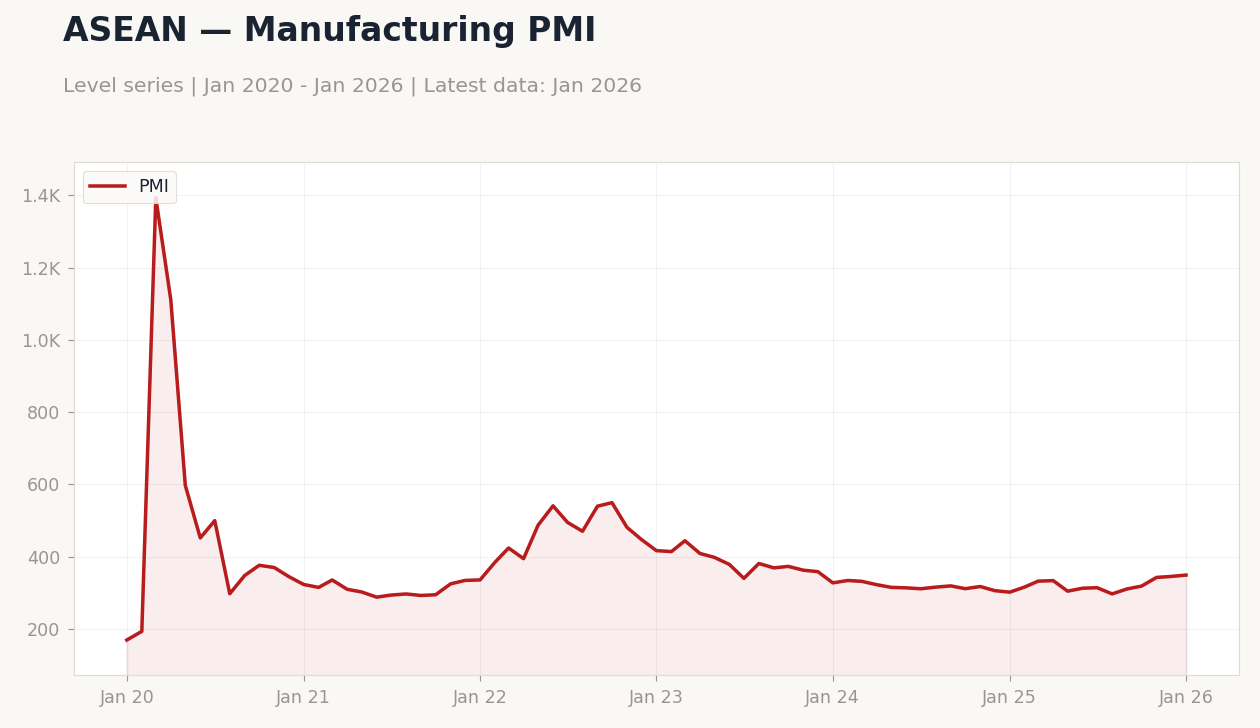
South Korea's KOSPI plunged 5.2% to 5,460 amid foreign outflows, with USD/KRW surging 1.24% to 1,508.26, hitting 17-year lows and prompting Bank of Korea warnings on inflation from oil dependency. ASEAN held steady, with Bank Indonesia maintaining rates as Brent fell 5.23% to 106.32, supporting gains like PSEi's 1.44% to 5,984.20. In Africa, South Africa's rand depreciated 2.36% to 17.12 against USD, yet JSE Top 40 rose 1.5% to 6,538 on mining resilience.