Global Cycle Positioning: Oil Relief Amid Resilient Growth
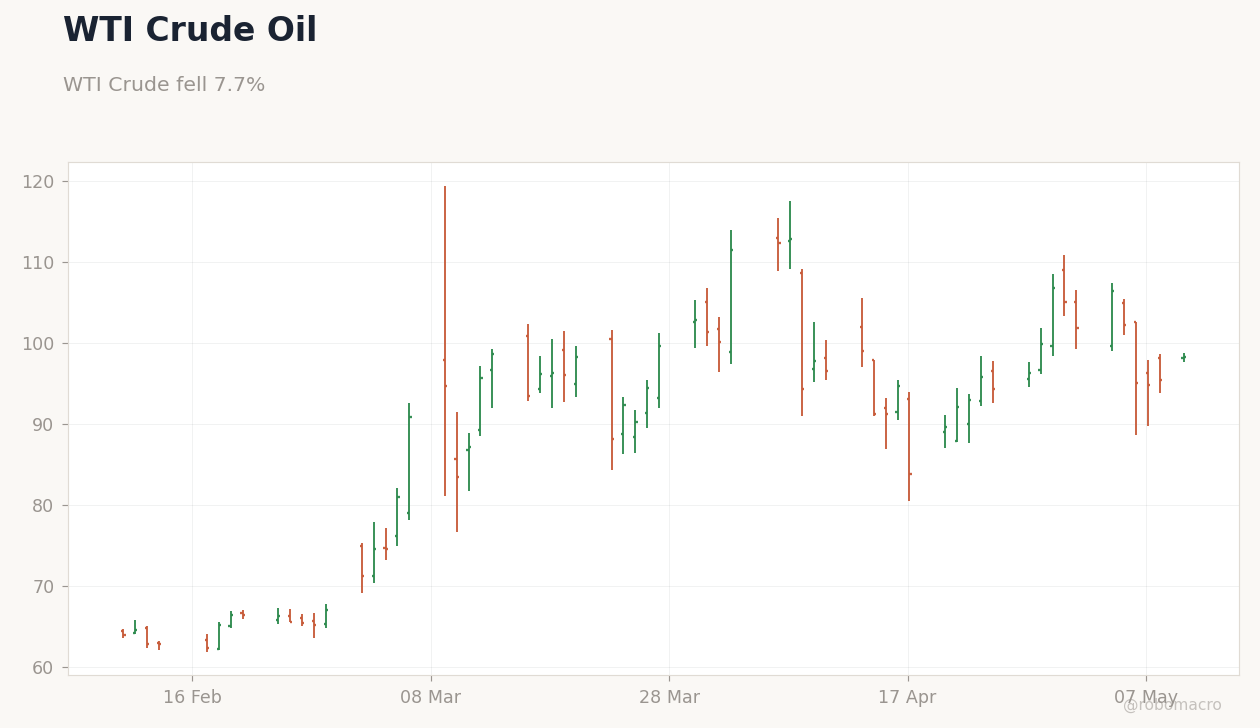
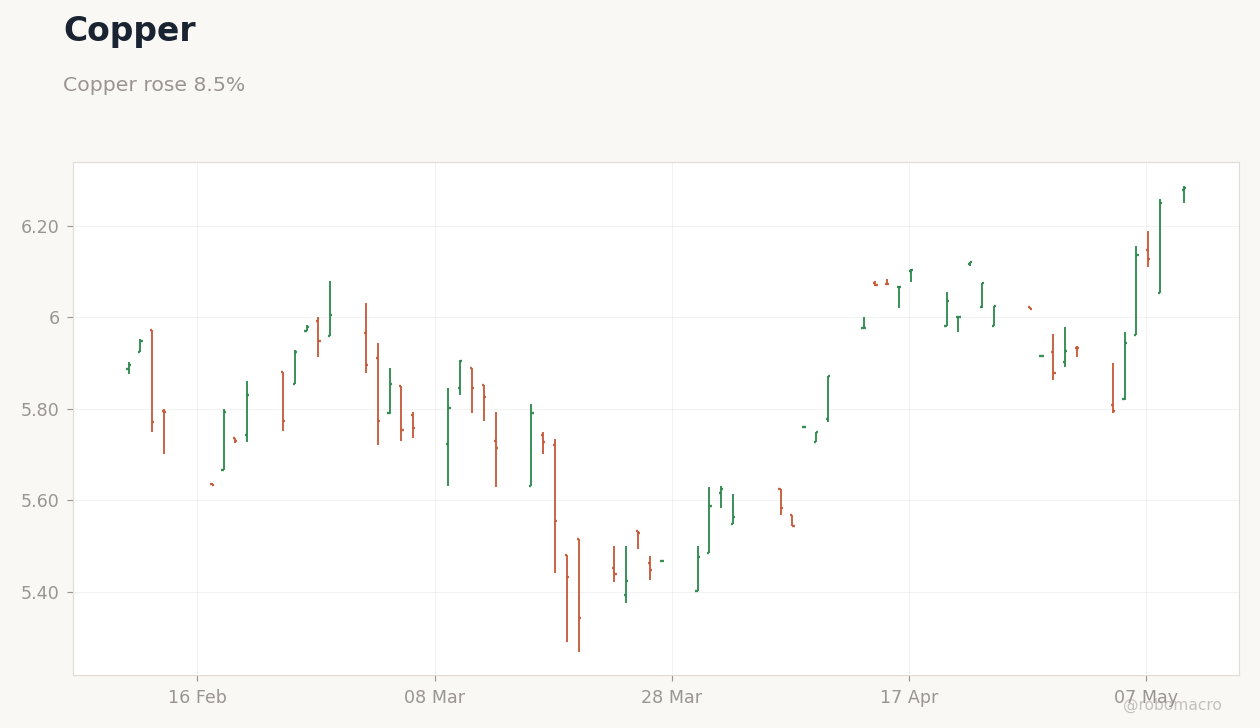
We note that the global economic cycle as of May 10, 2026, appears firmly in an expansionary phase, characterized by robust equity performance and easing inflationary pressures from commodities. The week's dominant narrative centered on a sharp decline in oil prices, which contrasted with strength in industrial metals and safe-haven assets, collectively signaling a pivot toward risk-on sentiment while tempering near-term inflation risks. Brent crude tumbled 9.03% week-over-week to 104.11, driven by global supply dynamics and inventory draws, providing broad relief to energy importers and bolstering consumer spending power. This oil slump, juxtaposed against copper's 8.41% surge to 6.28, underscores a bifurcated commodity landscape where industrial demand remains vigorous, supporting manufacturing recoveries seen in beats like Spain's manufacturing PMI exceeding forecasts.
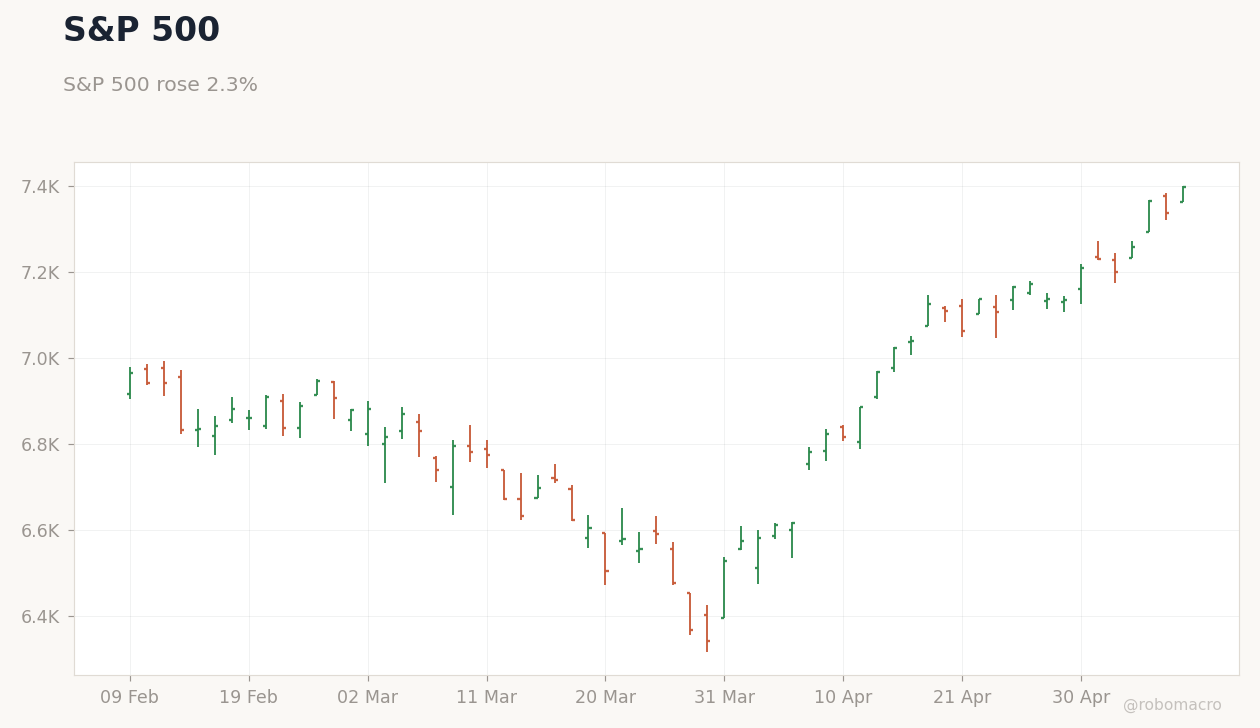
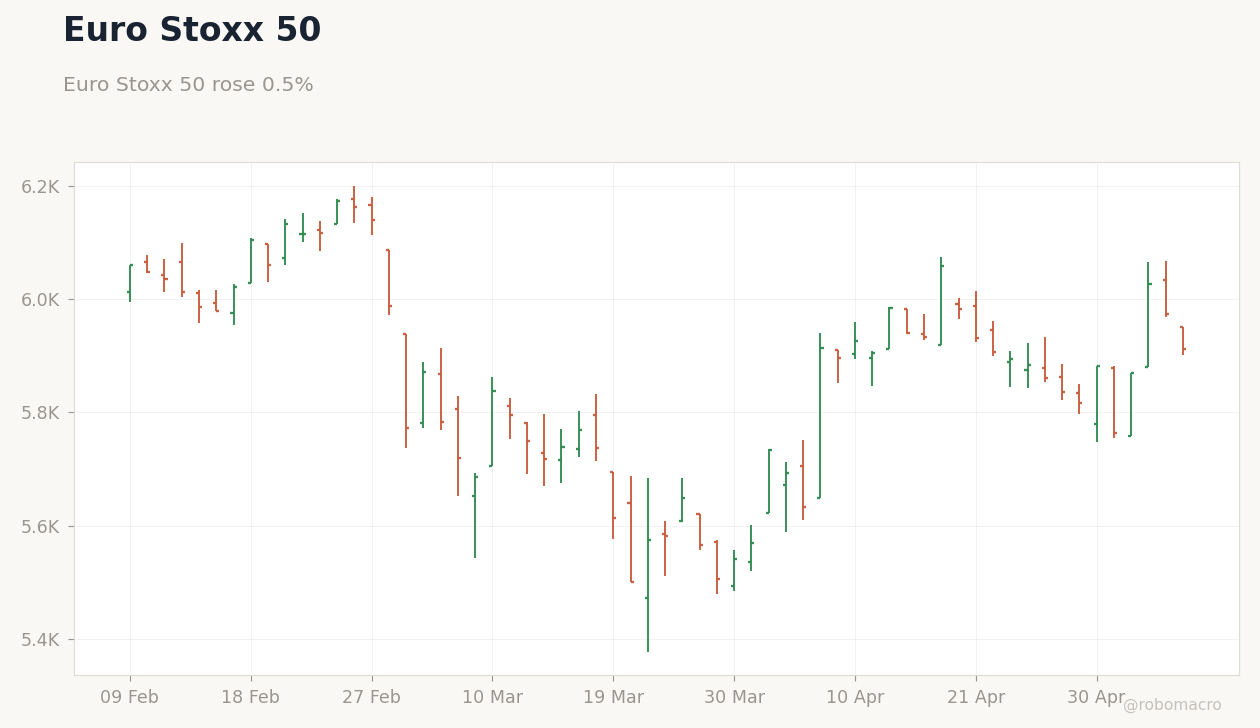
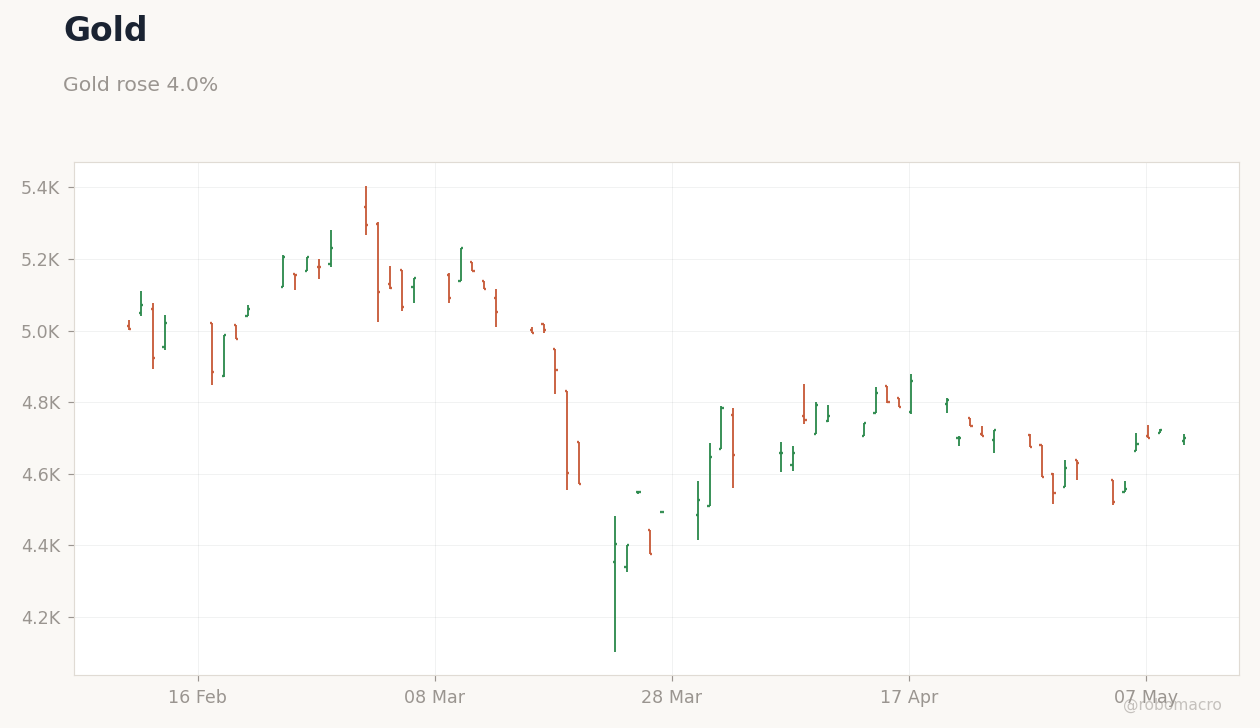
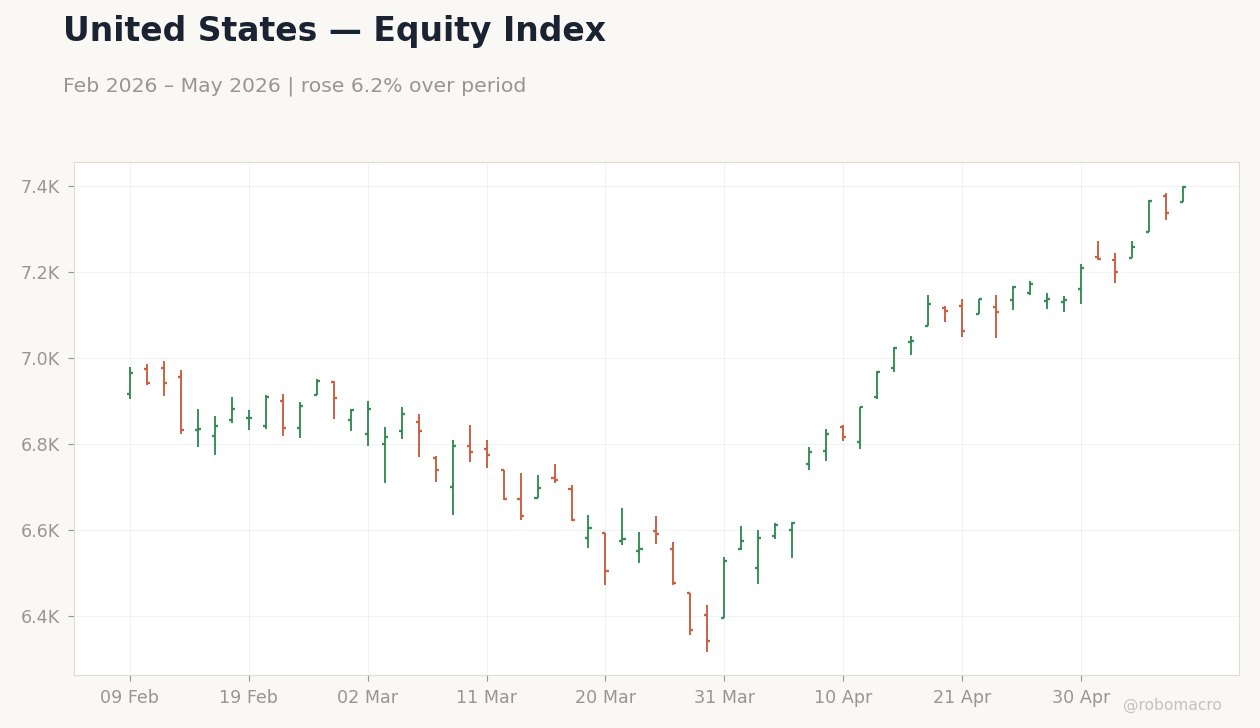
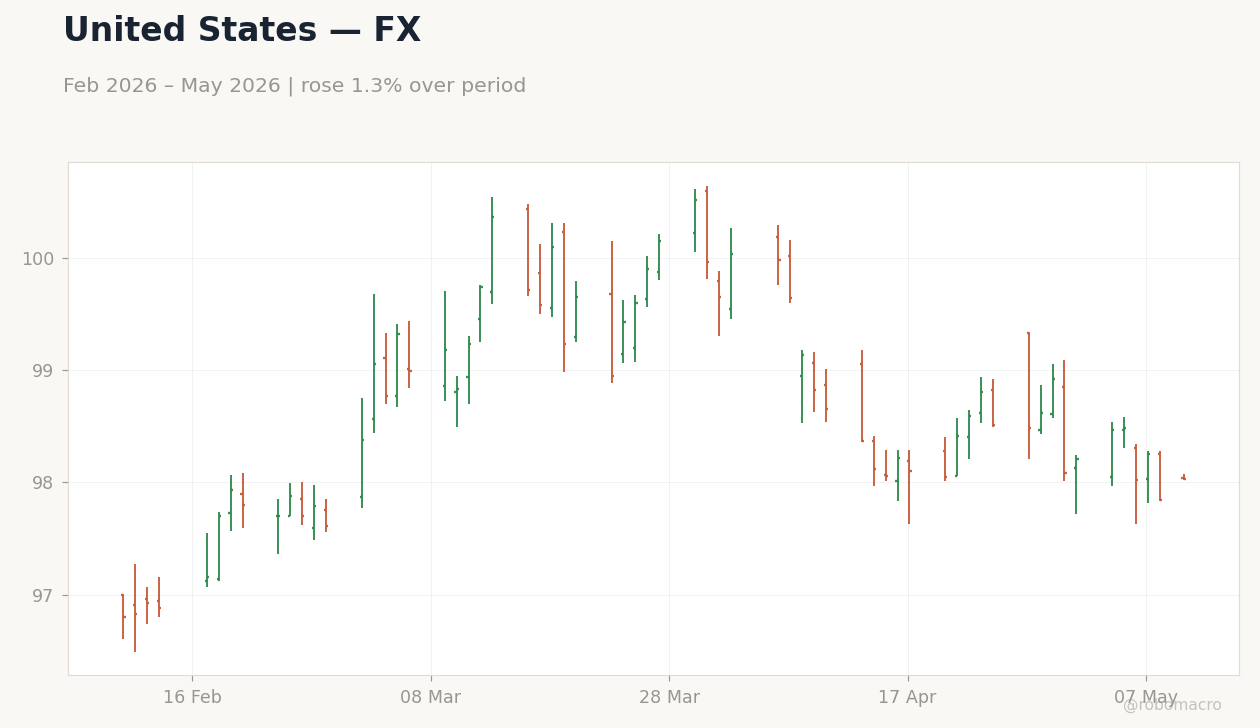
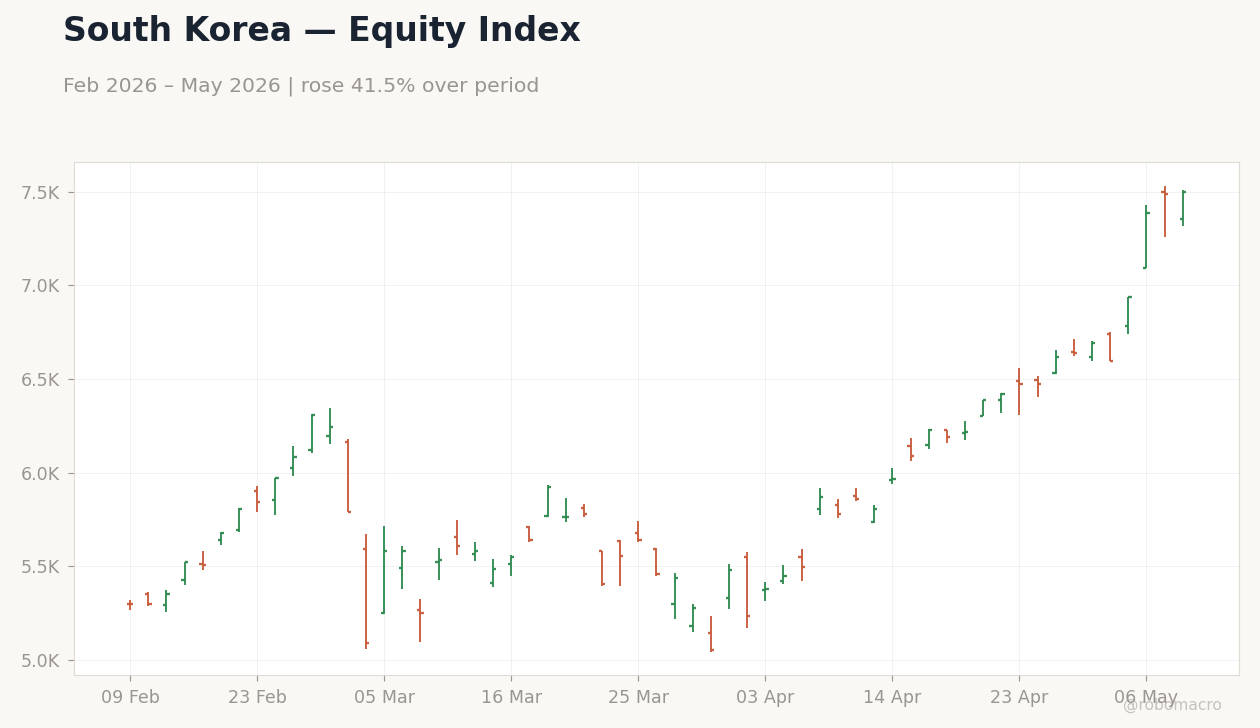
The data suggests we are midway through a post-pandemic recovery cycle, with equity indices reflecting optimism: the Nasdaq 100 surged 5.73% to 29,234.99, propelled by resilient US economic indicators such as factory orders rising above consensus. Similarly, the KOSPI rallied 8.09% to 7,498.00, fueled by AI-driven semiconductor gains, including Samsung Electronics up 15.48% to 268,500.00 won. This global equity momentum, with the Euro Stoxx 50 up 2.57% to 5,911.53, points to a narrative of sustained growth despite geopolitical tensions in the Middle East influencing gold's 4.0% gain to 4,700.50. We observe that falling energy costs, like WTI crude's 7.9% drop to 98.01, are easing fiscal pressures in oil-dependent economies, potentially extending the cycle by reducing input costs for businesses.
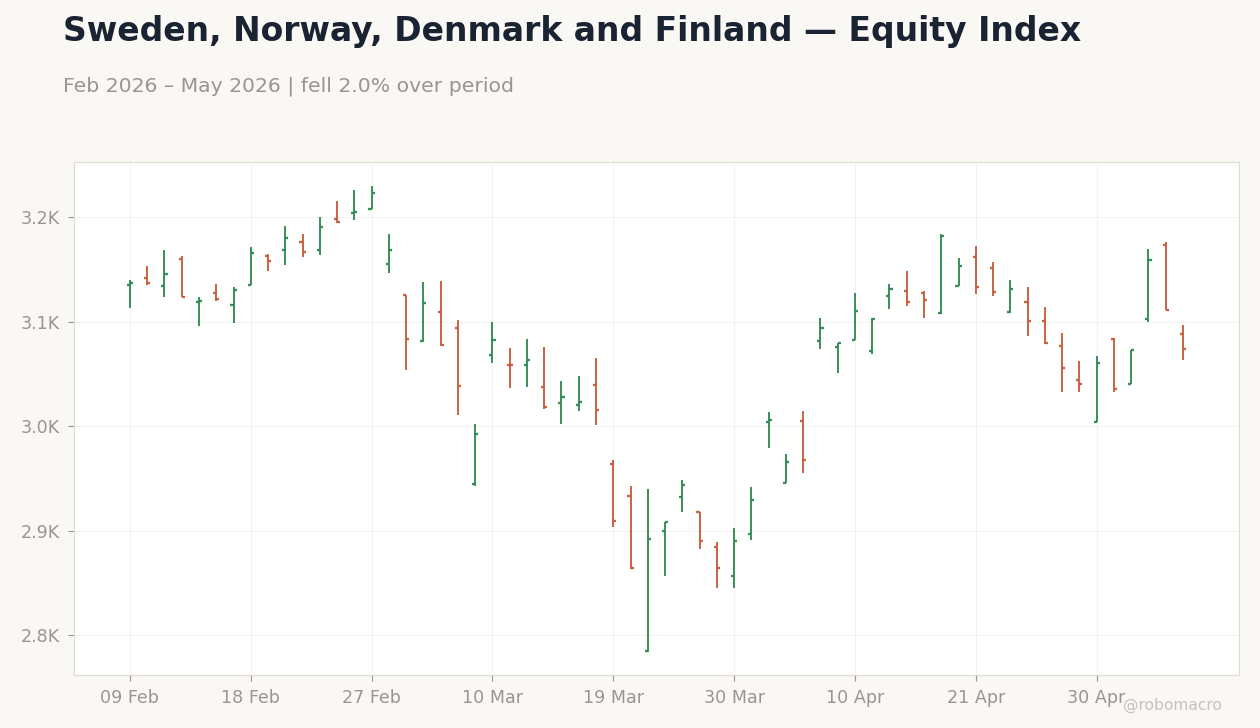
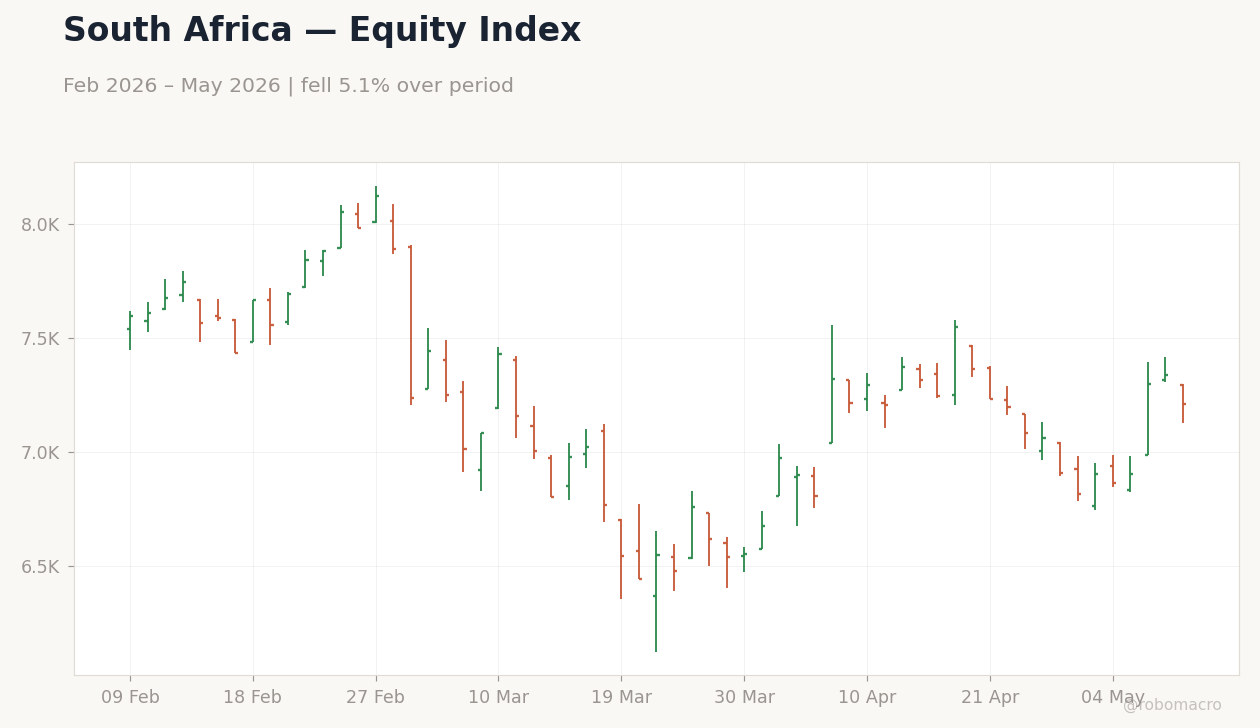
From a policy implication standpoint, this week's developments imply a reduced urgency for aggressive monetary tightening, as oil's decline mitigates imported inflation. In the US, Federal Reserve speakers, including Williams on May 10, 2026, maintained a data-dependent stance, emphasizing vigilance on inflation metrics amid robust manufacturing demand. Across regions, the narrative connects to a broader theme of cycle resilience: Spanish unemployment fell sharply, beating expectations, while Nordic equities diverged with Sweden's OMX Stockholm 30 rising 1.26% to 3,073.69. These indicators suggest the global cycle is gaining traction, with oil relief acting as a catalyst for reflationary trades. However, the split in commodities—platinum up 5.14% to 2046.9 in South Africa—highlights vulnerabilities, as energy exporters face headwinds that could fragment the recovery if oil remains below 100 for WTI.
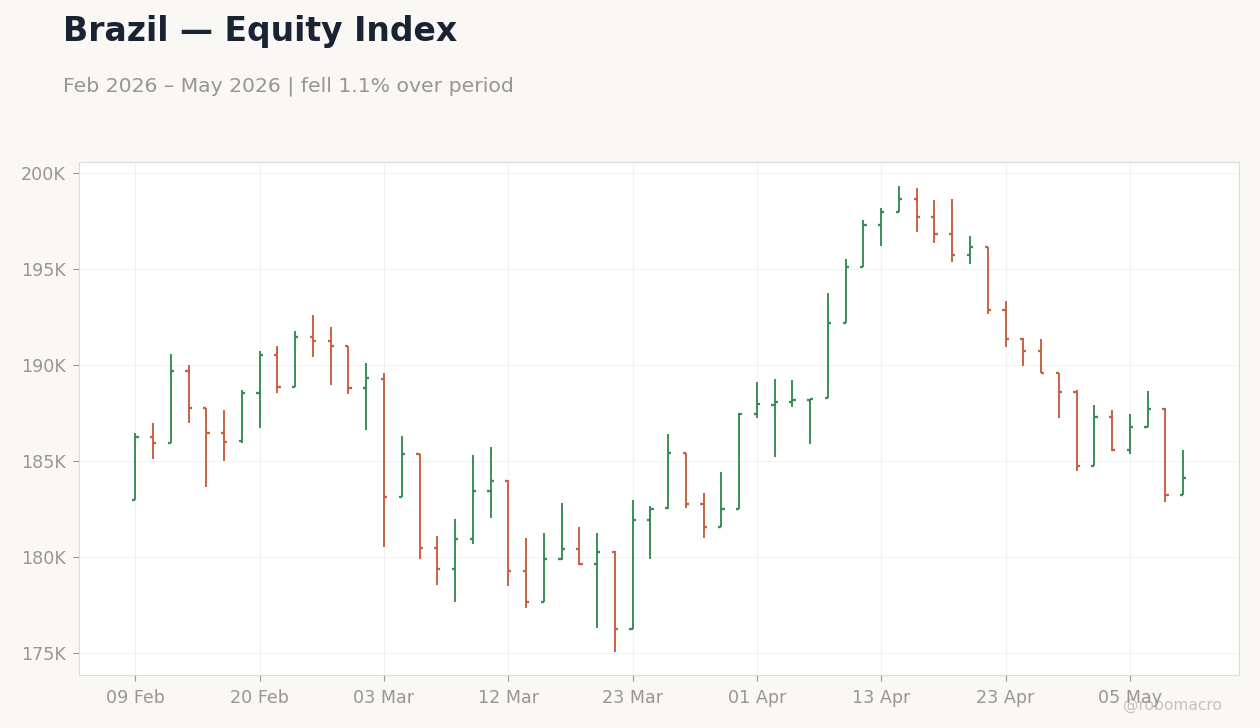
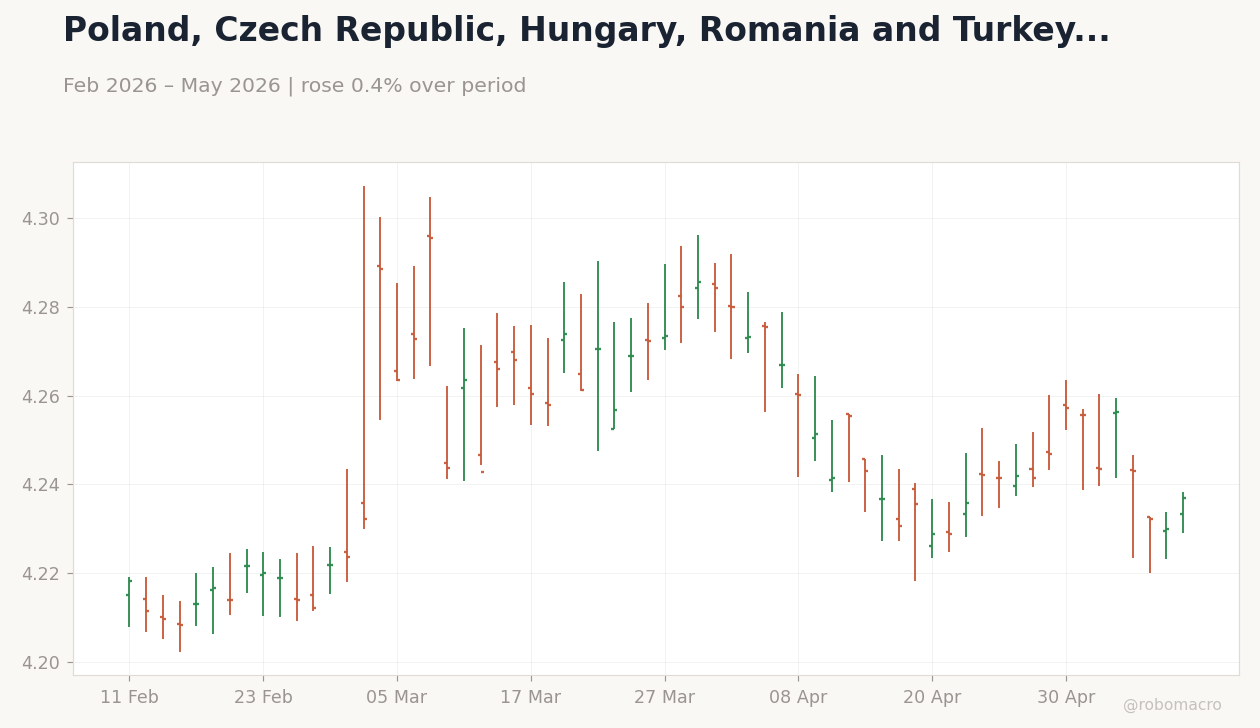
Overall, the week's macro story positions the global economy in a sweet spot of moderating inflation and accelerating growth, with equity gains like the Bovespa's 10.1% climb to 80.46 reflecting broad optimism. This sets the stage for policy makers to navigate divergences, as seen in CEE currencies strengthening, with EUR/HUF down 1.84% to 354.3. As we assess the cycle's maturity, the data from May 10, 2026, implies an extension into late-2026, contingent on sustained commodity stability and no escalation in Middle East tensions driving gold beyond 4,700.50.
Developed Market Dynamics: Equity Resilience Meets Yield Compression
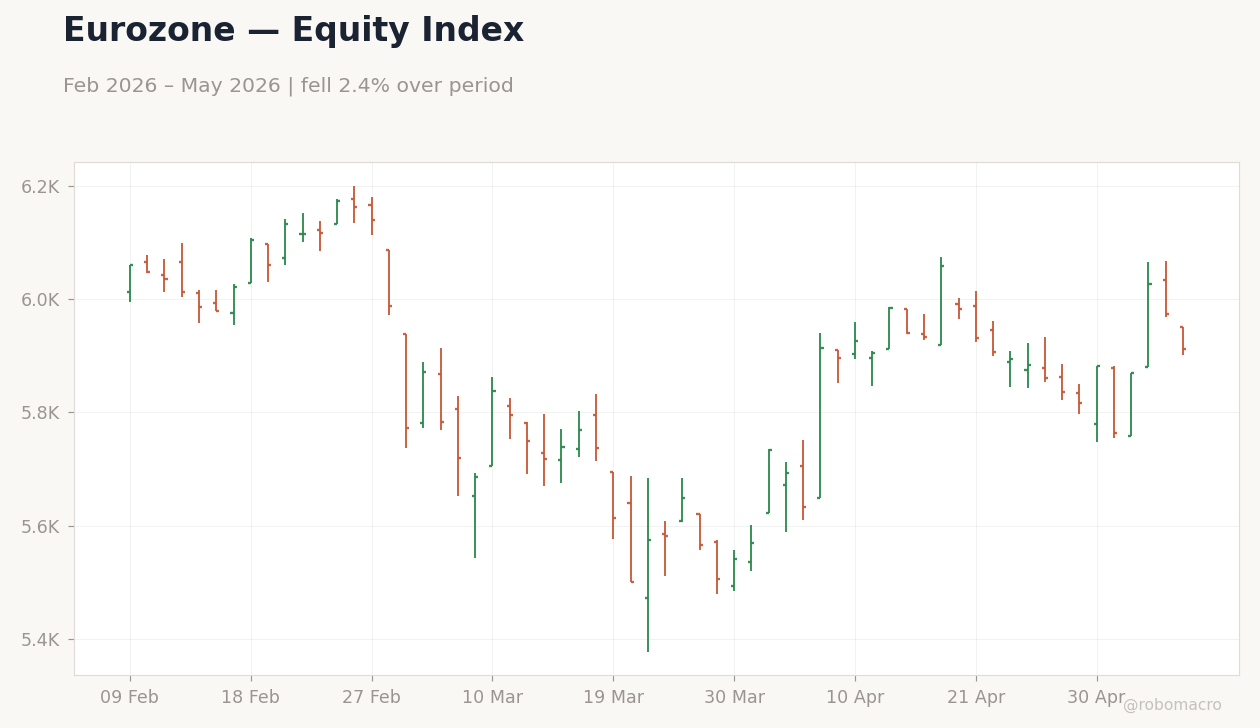
In developed markets, we observe a cohesive theme of economic resilience translating into equity gains and modest yield declines, with cross-regional read-across pointing to synchronized recoveries tempered by energy dynamics as of May 10, 2026. The US led with the Nasdaq 100's 5.73% surge to 29,234.99, underpinned by factory orders beating consensus and oil's 7.9% fall to 98.01 boosting risk appetite. This resilience echoes in the Eurozone, where manufacturing PMIs in Spain and Italy exceeded forecasts, driving the Euro Stoxx 50 up 2.57% to 5,911.53, while Spanish unemployment's sharp drop signals labor market strength.
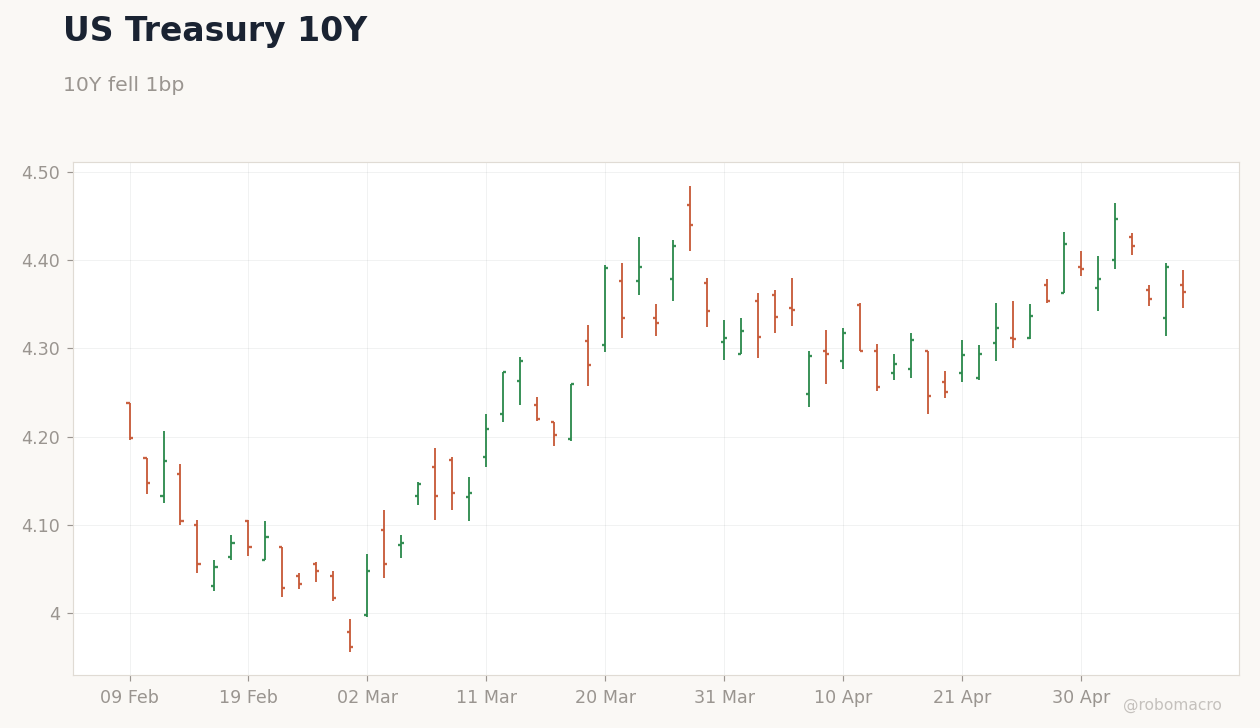
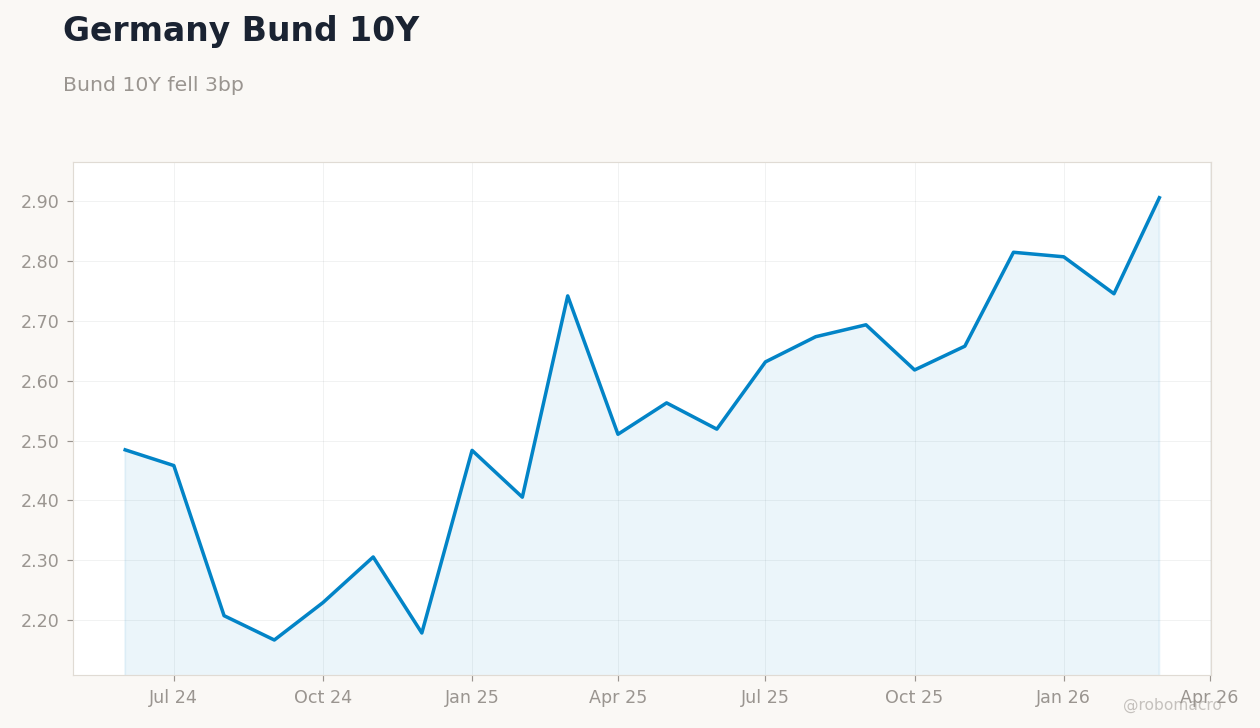
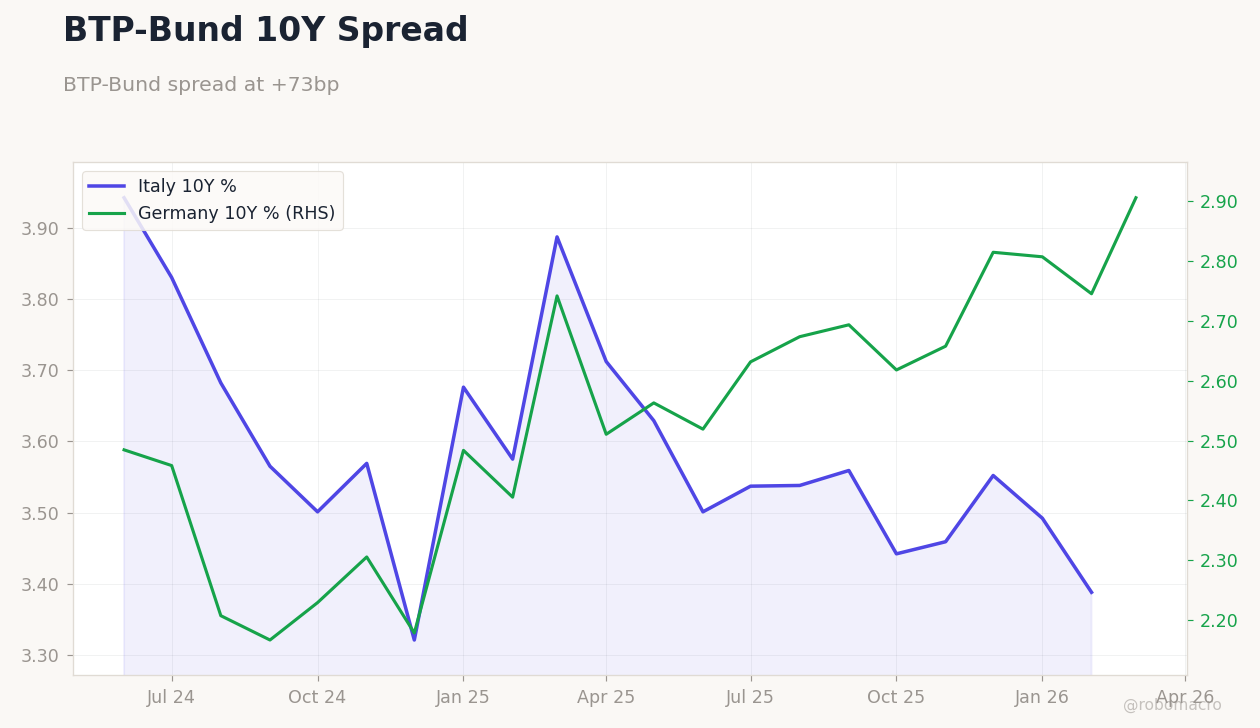
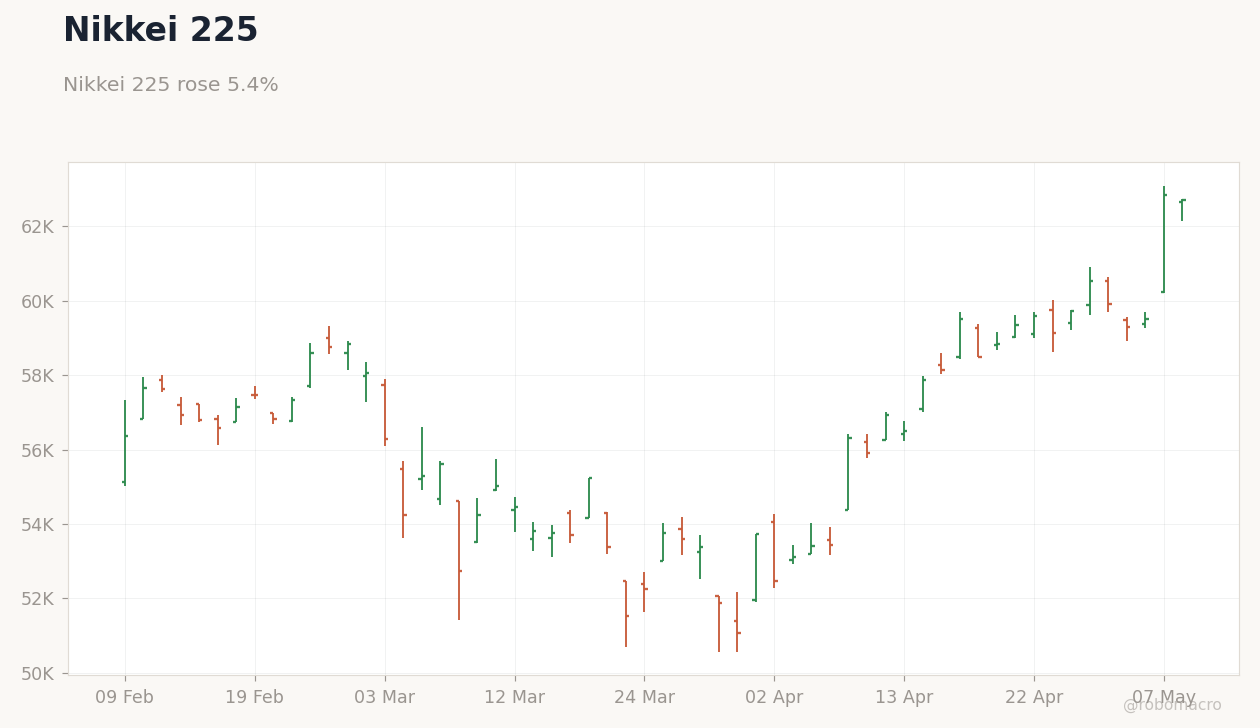
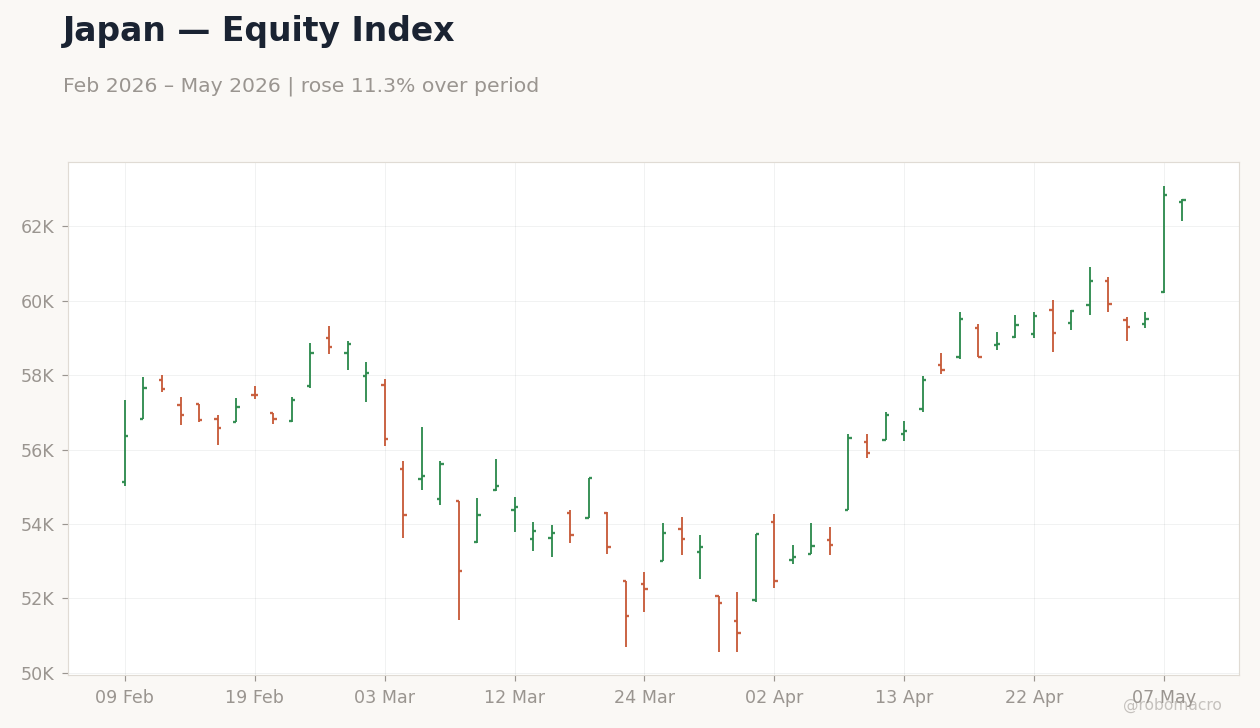
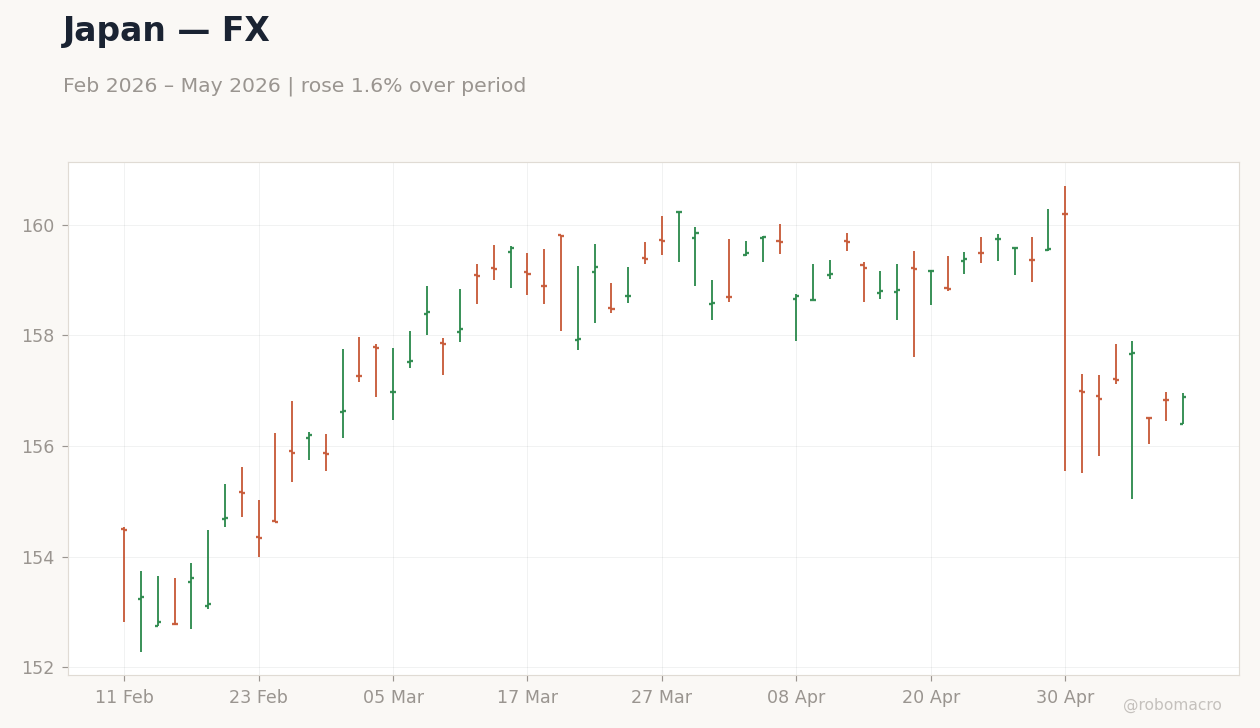
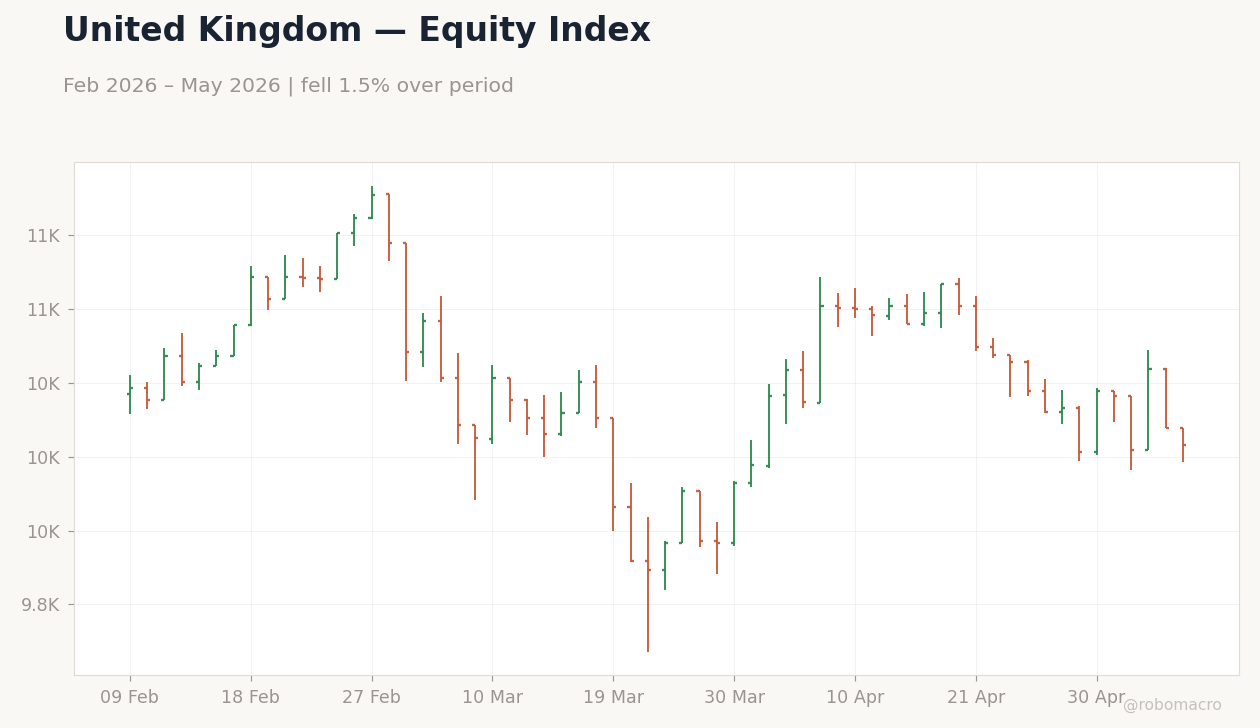
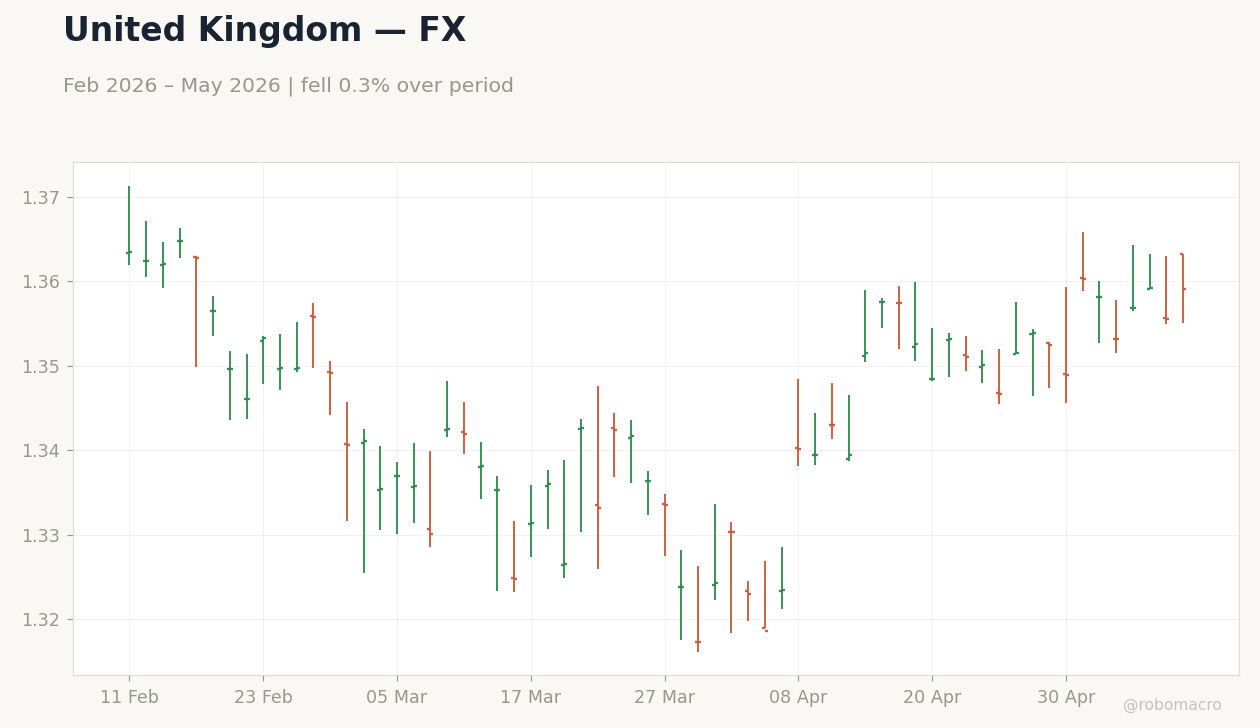
Japan's markets showed mixed signals, with the Nikkei 225 declining 0.19% to 62,713.65 amid exporter pressures from global risk-off undertones, yet USD/JPY's modest 0.03% gain to 156.89 reflects currency stability. In the UK, the FTSE 250 advanced 1.81% to 22,849.4, buoyed by mid-cap resilience despite Brent crude's 8.81% drop to 104.36 pressuring energy sectors. Yield curves across DMs compressed slightly, with the US 10Y yield down 1bp to 4.36% and Germany's 10Y easing 3bp to 3.00%, suggesting markets are pricing in less hawkish policy paths amid falling energy costs.
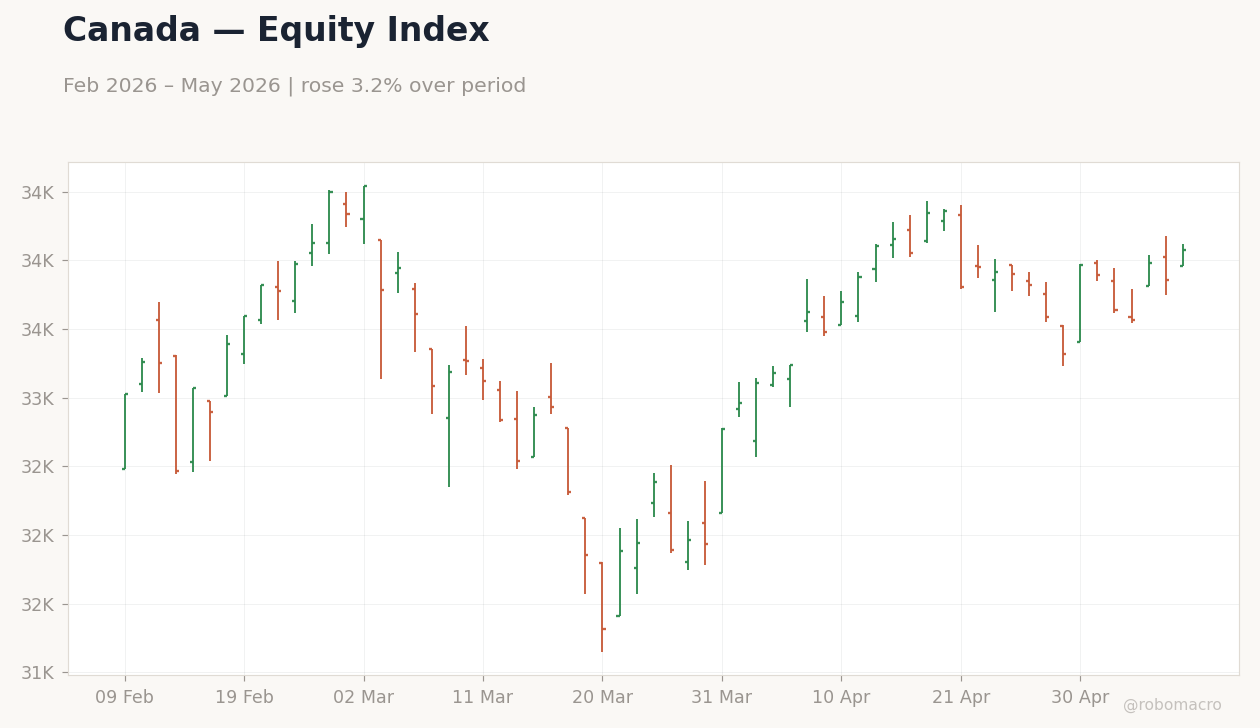
Policy implications here center on central bank caution: ECB speakers were silent this week, but stronger data supports a potential rate cut pause, aligning with the Fed's data-dependent emphasis from Williams on May 10, 2026. In Japan, gold's 4.0% advance to 4,700.50 as a safe-haven underscores inflation outlook pressures from Brent's tumble. The read-across to the UK and Eurozone implies a converging DM narrative of growth support, with Canada's S&P/TSX up 1.3% to 34,077.8 driven by metals strength despite oil declines. We note that this week's DM data, including Italy's 10Y yield down 13bp to 3.73%, reinforces a theme of fiscal breathing room, potentially delaying tightening cycles if oil remains subdued below 104.11 for Brent.
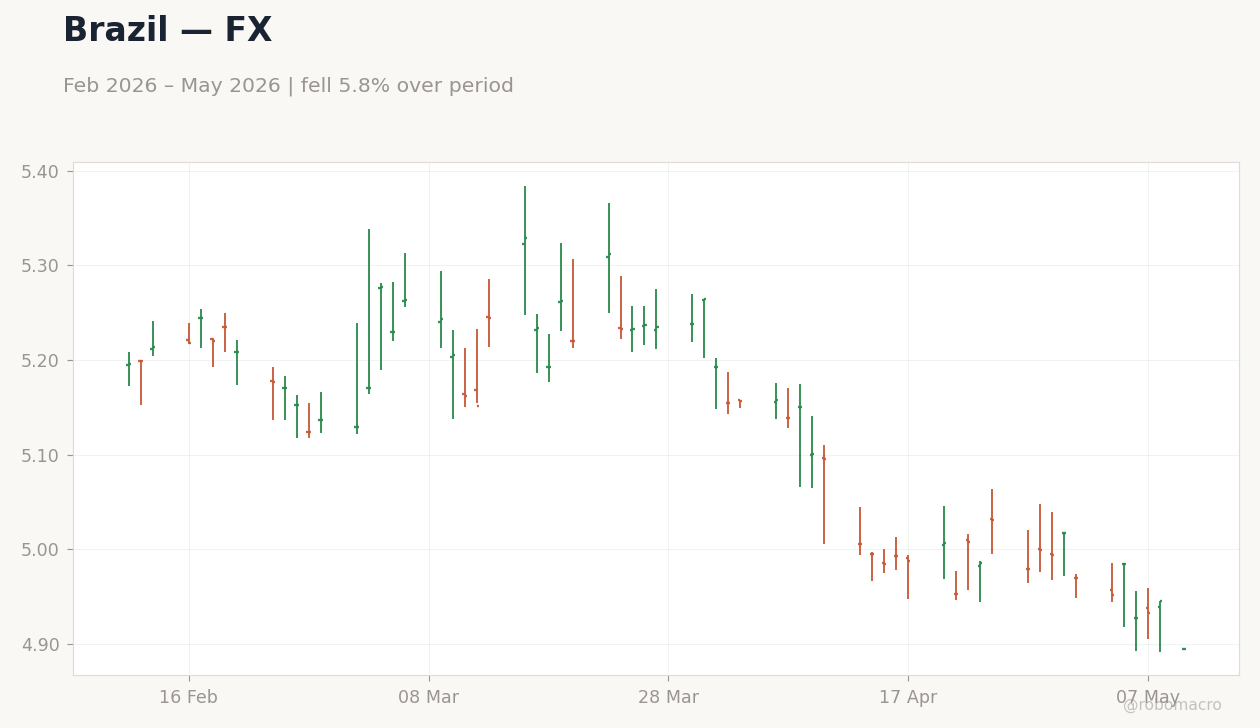
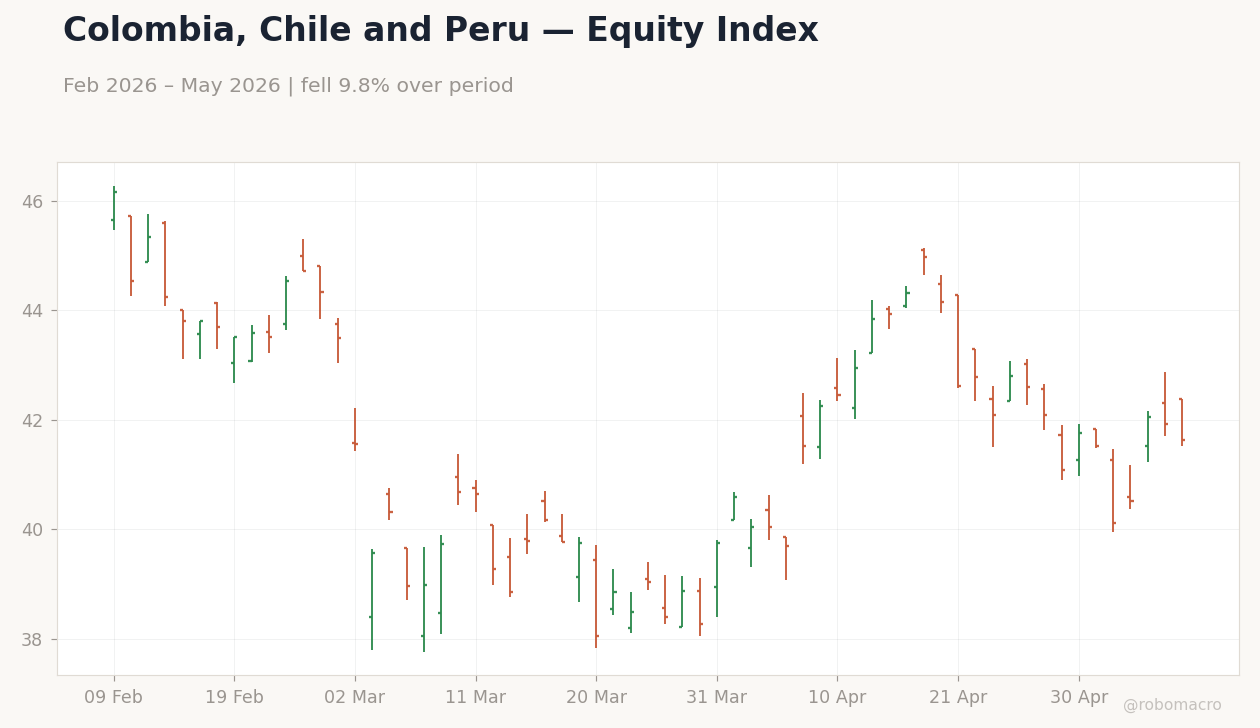
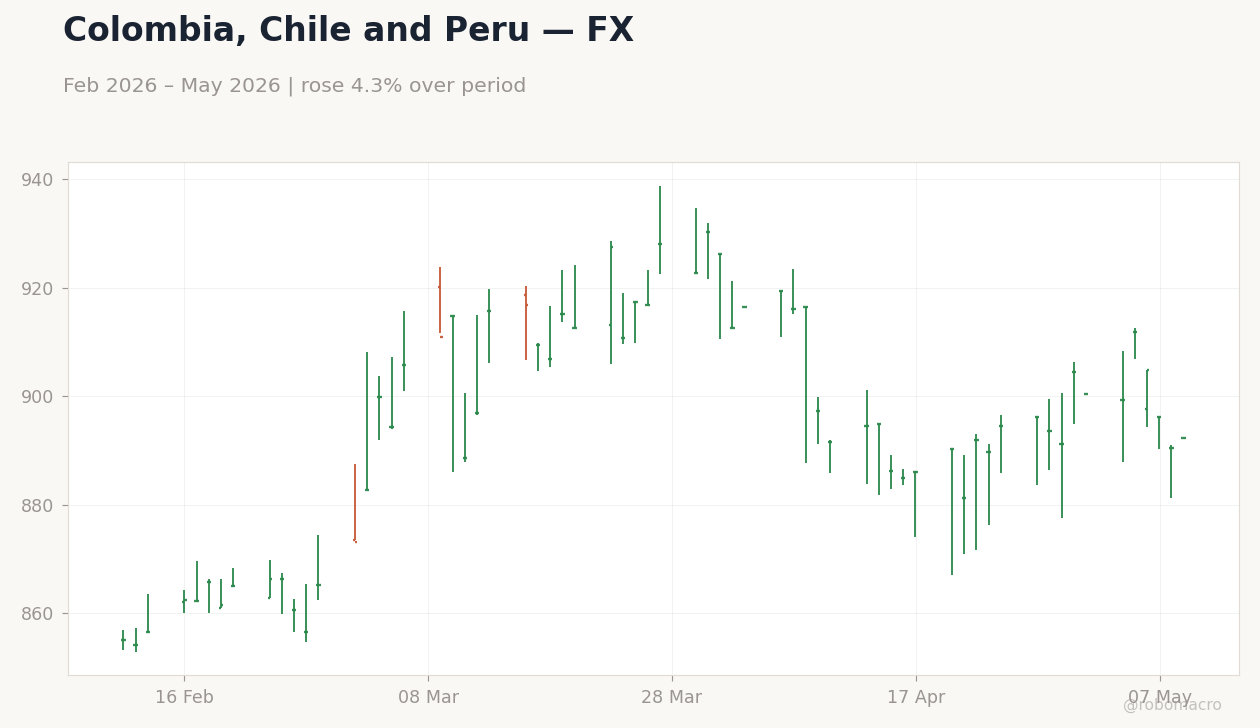
Emerging Market Themes: Currency Strength and Commodity Tailwinds
Emerging markets exhibited a pattern of currency appreciation and equity rallies fueled by commodity divergences, with data flows indicating reduced inflation risks as of May 10, 2026. In Latin America, Brazil's Bovespa climbed 10.1% to 80.46, supported by USD/BRL weakening 4.03% to 4,701.6, while copper's 8.41% surge to 6.28 drove MSCI Peru up 7.03% to 83.33. This strength contrasts with oil pressures in Colombia, where USD/COP rose 2.12% to 3,732.90 amid Brent's 8.81% fall to 104.36.