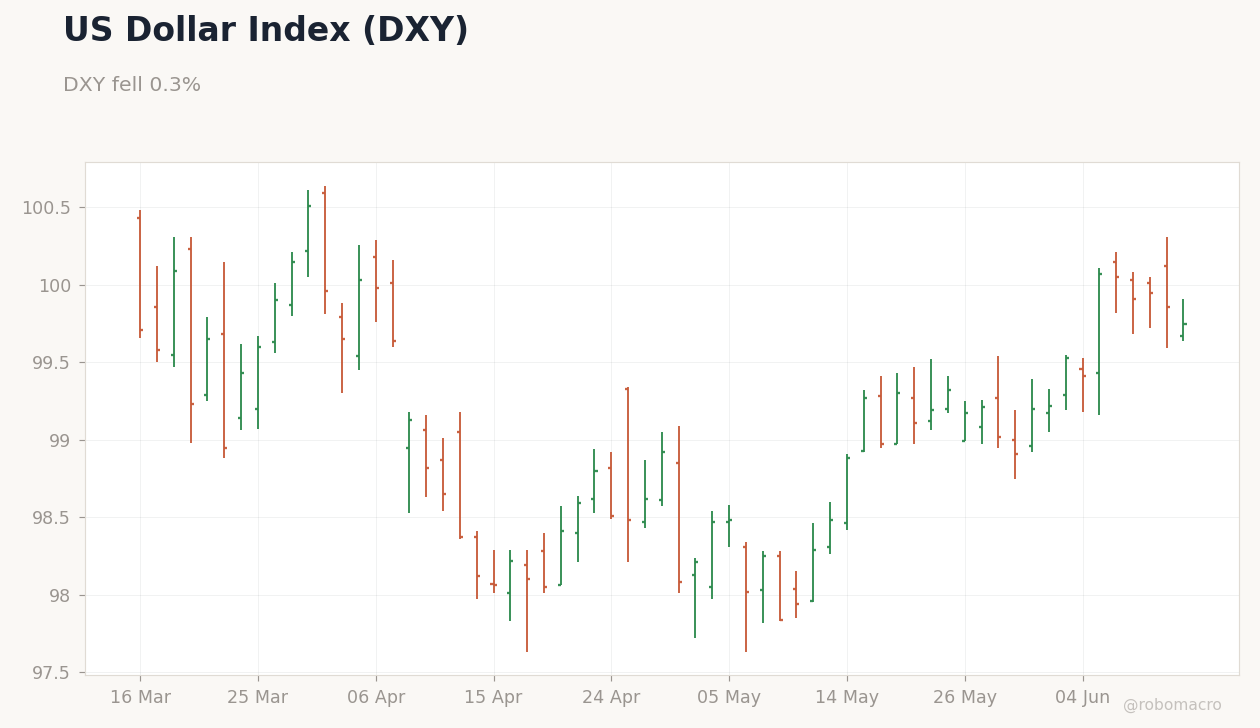
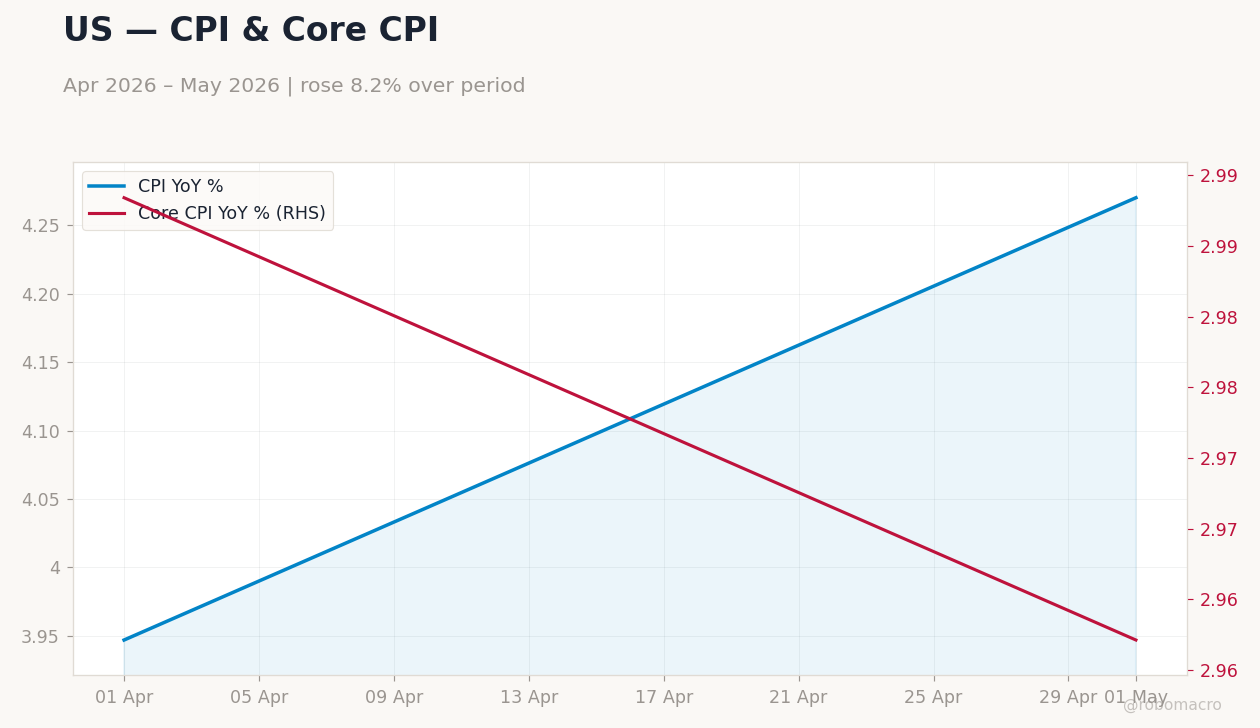
The global economic cycle remains in mid-expansion as of the week ending June 14, 2026. US inflation resilience has emerged as the dominant narrative, overriding the disinflationary impulse from lower energy prices and re-anchoring rate expectations higher across developed markets. We note that US CPI rose while core held steady, with the month-over-month core print beating consensus lower and shifting Fed OIS curves to price the first cut no earlier than mid-2027. This repricing lifted the USD Index even as DXY closed at 99.75 after a 0.3 percent weekly decline. Existing home sales increased and the trade deficit narrowed, confirming that domestic demand continues to absorb higher borrowing costs without immediate contraction. The data therefore suggest that US outperformance is tightening global financial conditions through the dollar channel rather than through outright growth signals.
Prior weeks had featured oil-price relief that supported disinflation hopes without altering the expansion trajectory. The current week’s US prints have reversed part of that narrative, leaving markets to price terminal rates higher while activity data elsewhere remain resilient. Equity markets responded with selective rotation, as the S&P 500 closed the week up 0.35 percent while the Nasdaq 100 gained 2.3 percent to 29,636. This configuration points to a reflationary tilt layered on persistent US demand strength rather than a synchronized slowdown.
Published every Sunday afternoon 100% AI-generated — not financial advice
US Data Outperformance Anchors Global Cycle in Mid-Expansion
The global economic cycle remains in mid-expansion as of the week ending June 14, 2026. US inflation resilience has emerged as the dominant narrative, overriding the disinflationary impulse from lower energy prices and re-anchoring rate expectations higher across developed markets. We note that US CPI rose while core held steady, with the month-over-month core print beating consensus lower and shifting Fed OIS curves to price the first cut no earlier than mid-2027. This repricing lifted the USD Index even as DXY closed at 99.75 after a 0.3 percent weekly decline. Existing home sales increased and the trade deficit narrowed, confirming that domestic demand continues to absorb higher borrowing costs without immediate contraction. The data therefore suggest that US outperformance is tightening global financial conditions through the dollar channel rather than through outright growth signals.
Prior weeks had featured oil-price relief that supported disinflation hopes without altering the expansion trajectory. The current week’s US prints have reversed part of that narrative, leaving markets to price terminal rates higher while activity data elsewhere remain resilient. Equity markets responded with selective rotation, as the S&P 500 closed the week up 0.35 percent while the Nasdaq 100 gained 2.3 percent to 29,636. This configuration points to a reflationary tilt layered on persistent US demand strength rather than a synchronized slowdown.
DM Economies Show Data Dependence Without Synchronized Easing
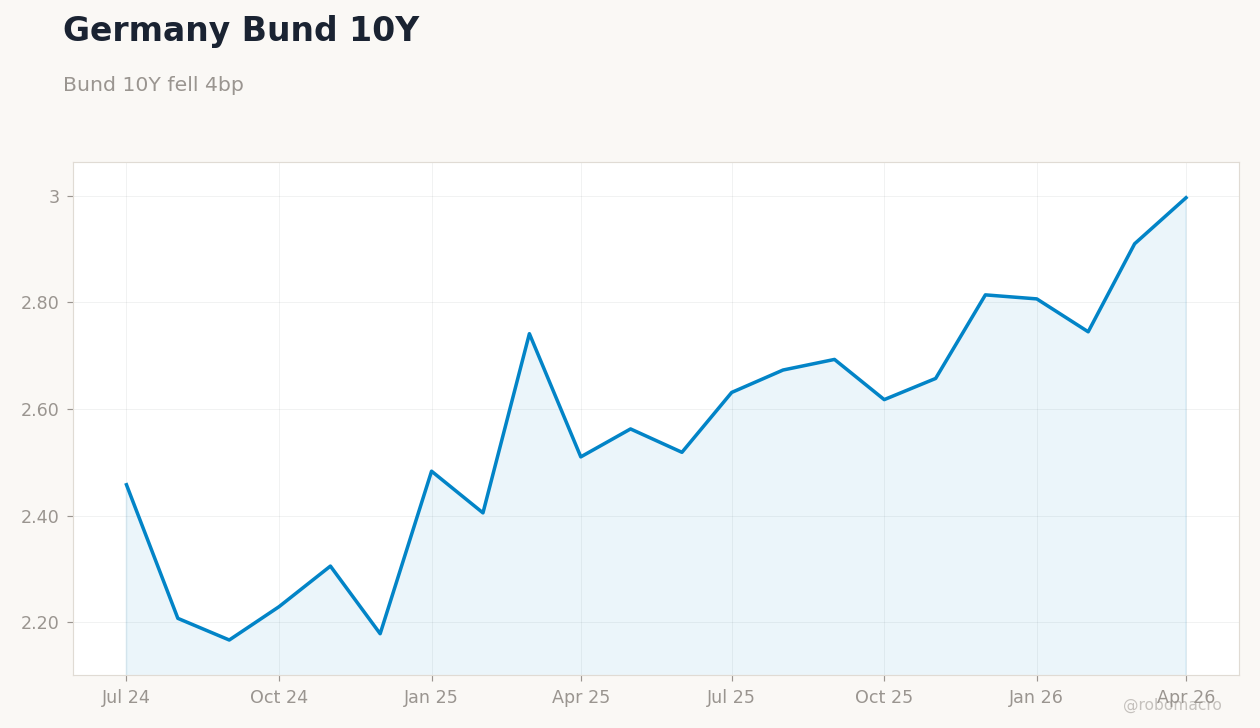
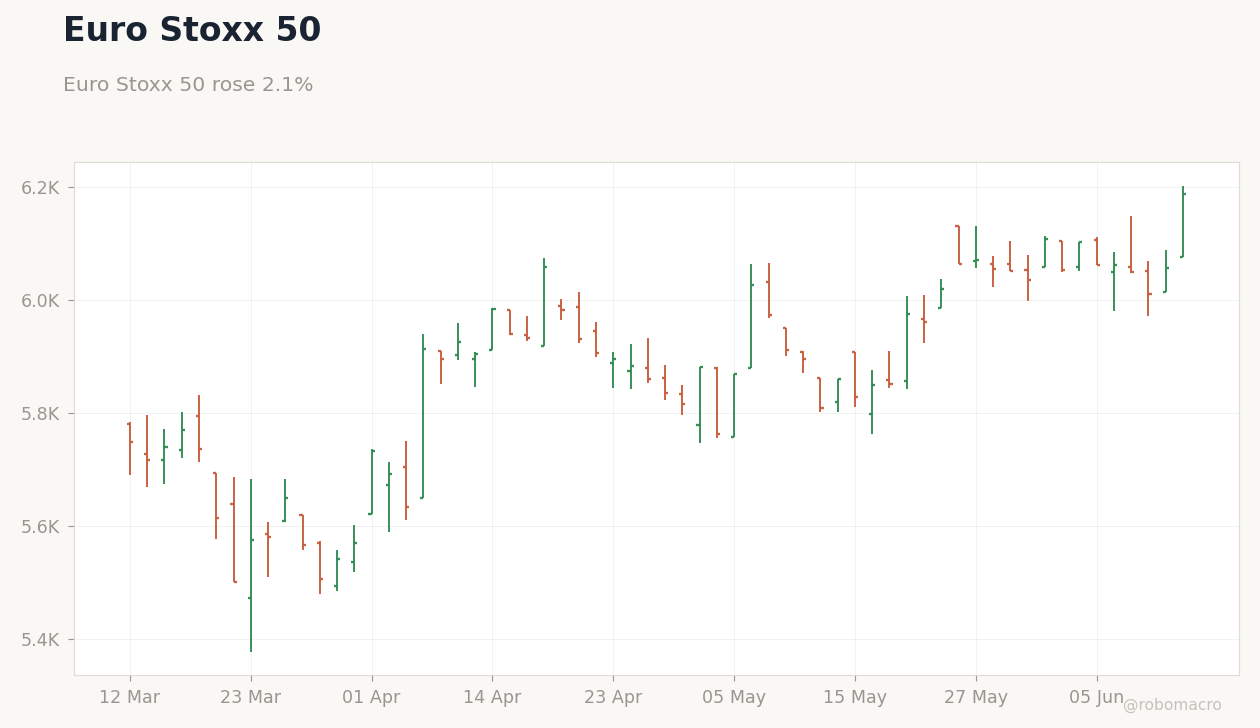
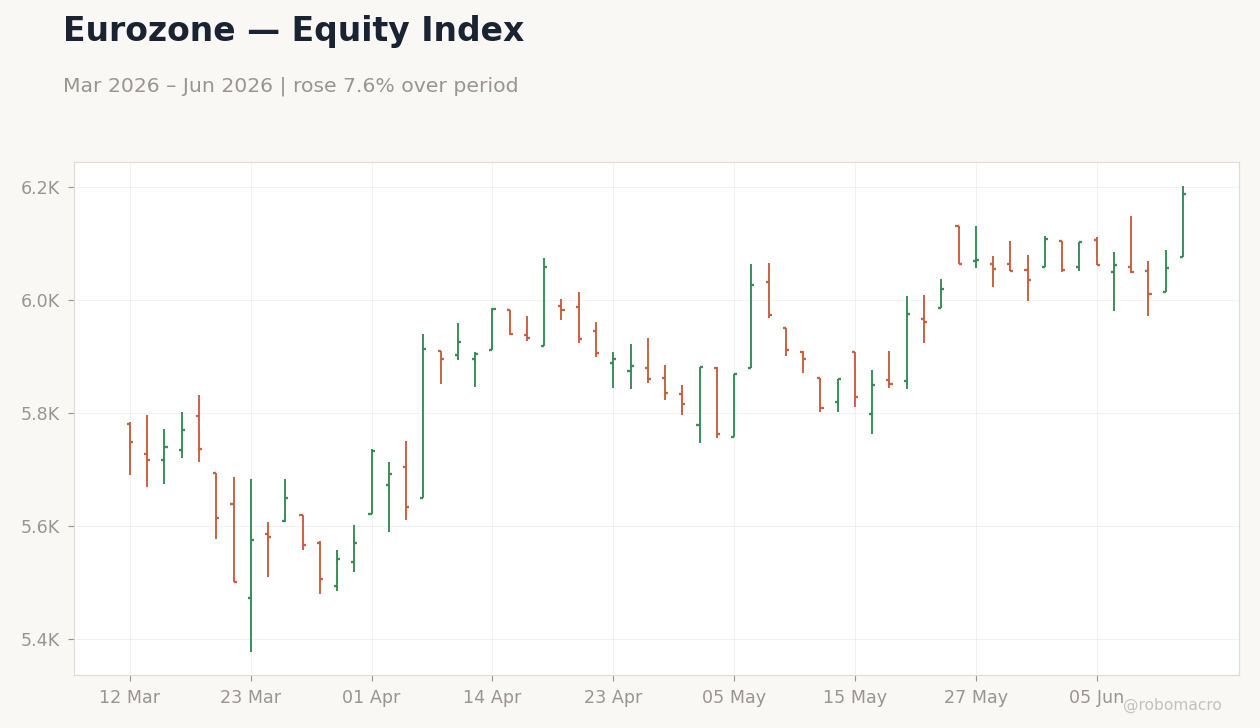
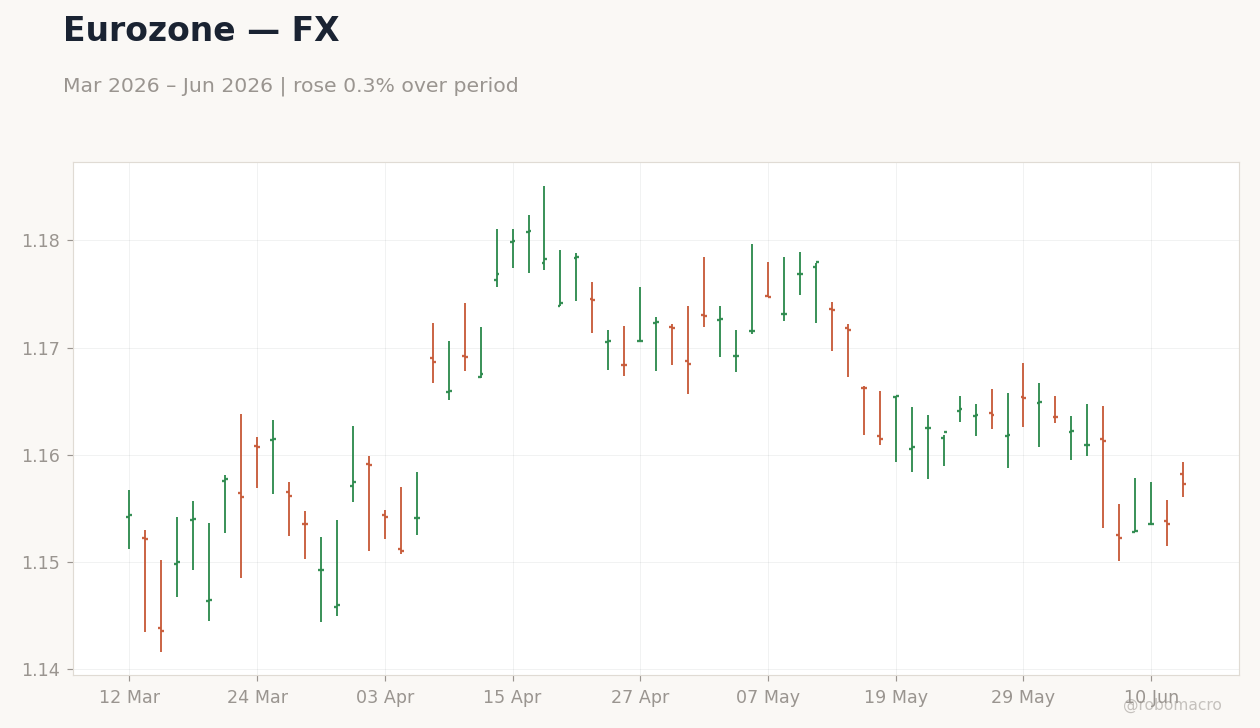
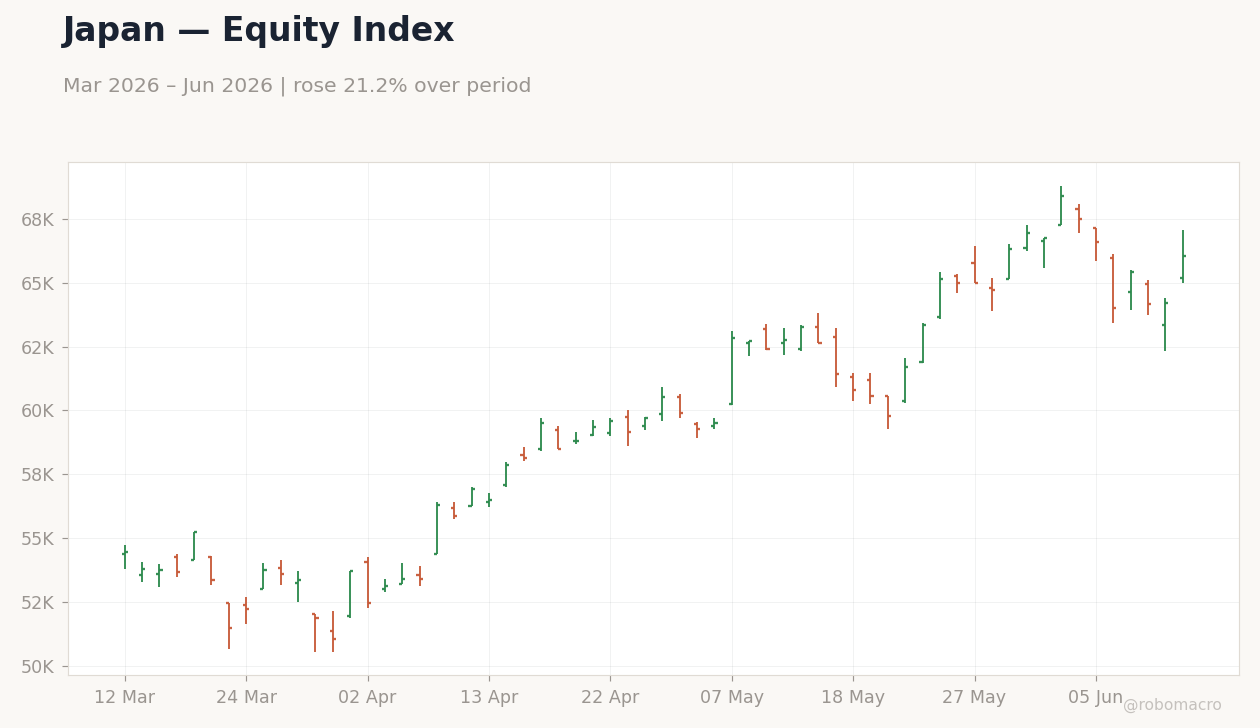
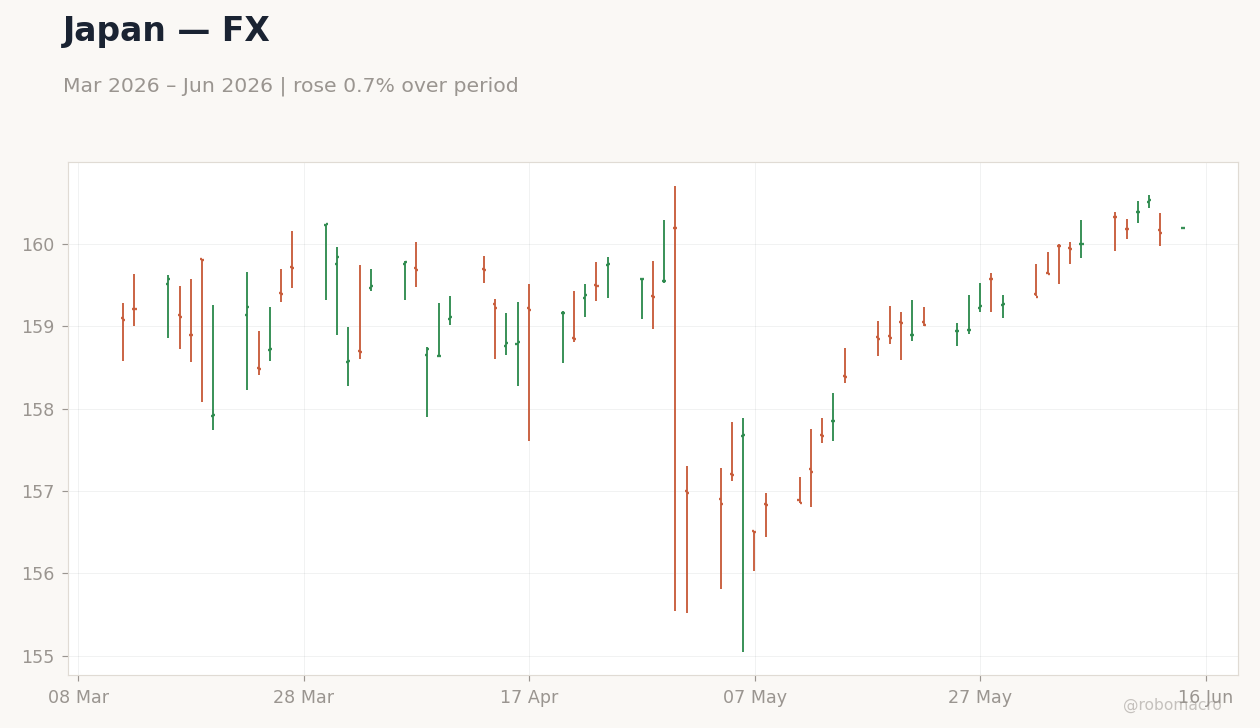
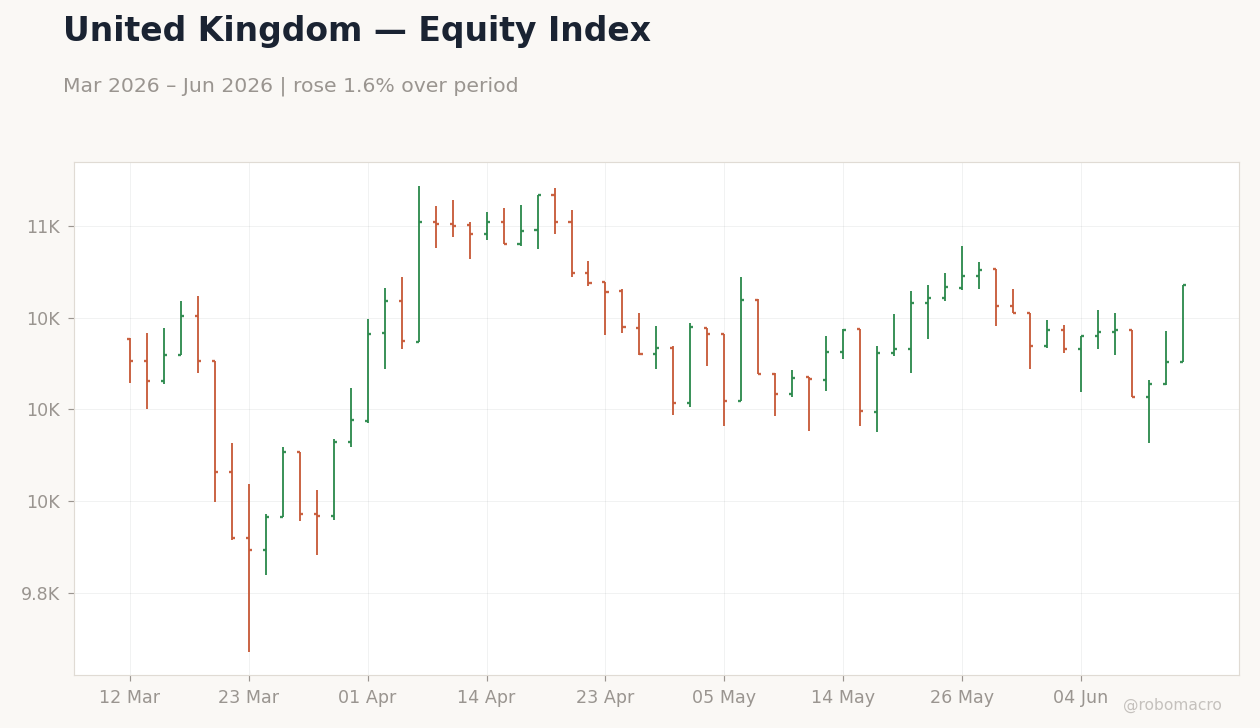
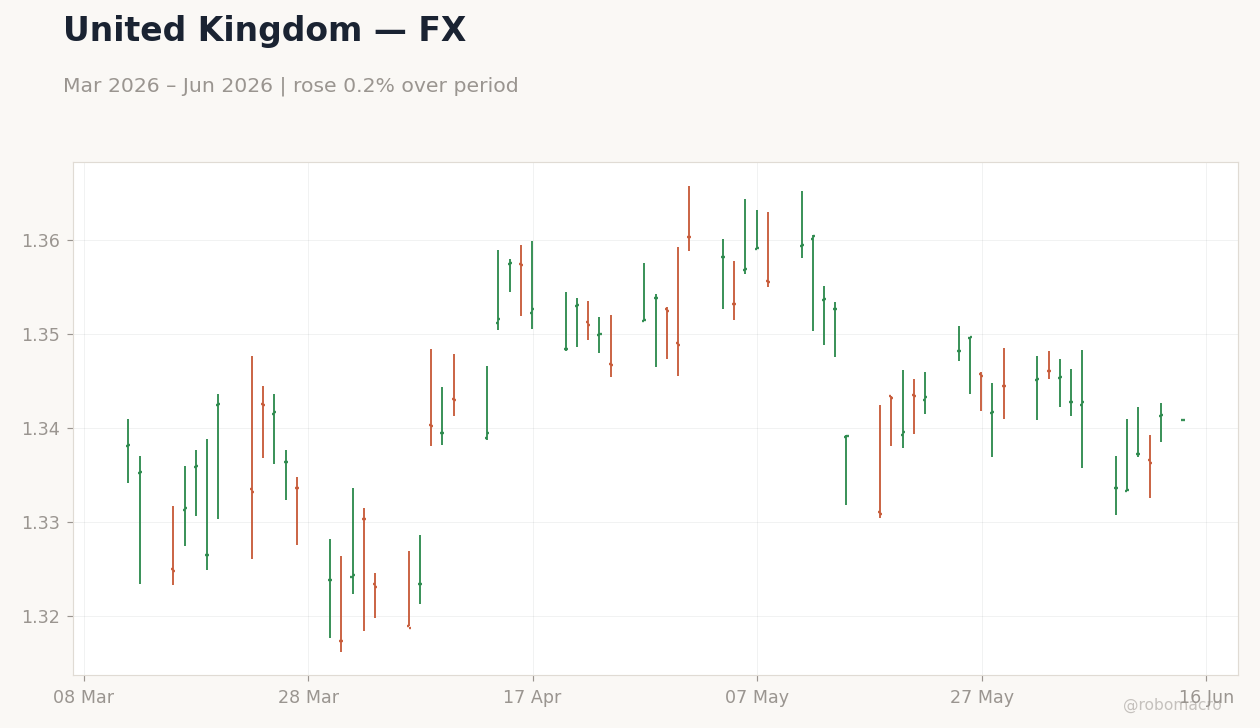
Developed-market outcomes clustered around US inflation spillovers and selective domestic resilience. In the euro area, the Euro Stoxx 50 rose 2.07 percent to 6,187.63 and the CAC 40 gained 1.85 percent to 8,350.87, while EUR/USD advanced 0.44 percent to 1.16. German 10-year yields fell 4 basis points to 3.00 percent, yet the 2s10s spread widened to +38 basis points, reflecting modest steepening amid stable growth signals. Japan recorded a 3.12 percent Nikkei 225 gain to 66,020.04 as USD/JPY held near 160.18, with Brent’s decline adding external disinflation pressure that left BoJ policy on hold. The United Kingdom saw the FTSE 100 rise 0.95 percent to 10,471.7 and GBP/USD strengthen 0.54 percent to 1.34, as Gilt 2-year yields declined 12 basis points to 4.23 percent on firmer domestic demand.
Canada’s May employment rose while unemployment declined, prompting the Bank of Canada to hold the policy rate steady without labeling conditions a recession. These prints kept BoC OIS-implied hold probabilities steady through the next decision. Across DM economies the common thread is data dependence that tolerates above-target inflation prints to support growth, with OIS curves showing only limited repricing for near-term policy changes.
EM Performance Splits Along Domestic Inflation and Commodity Lines
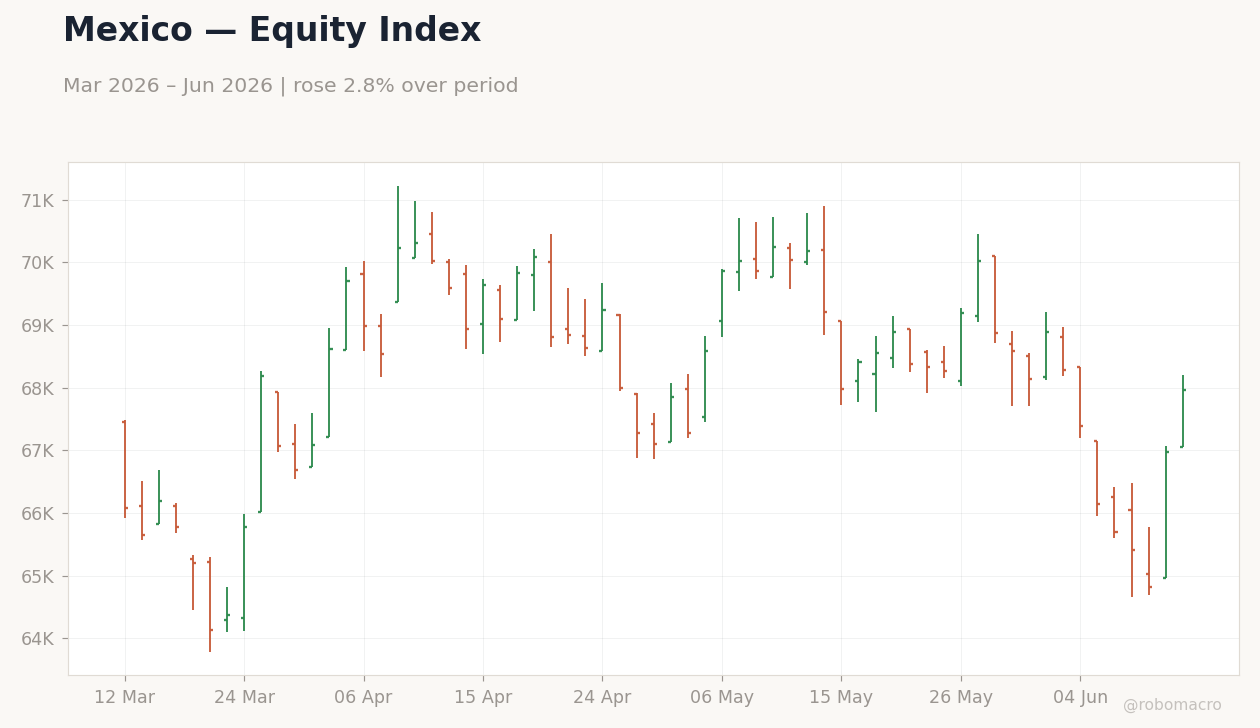
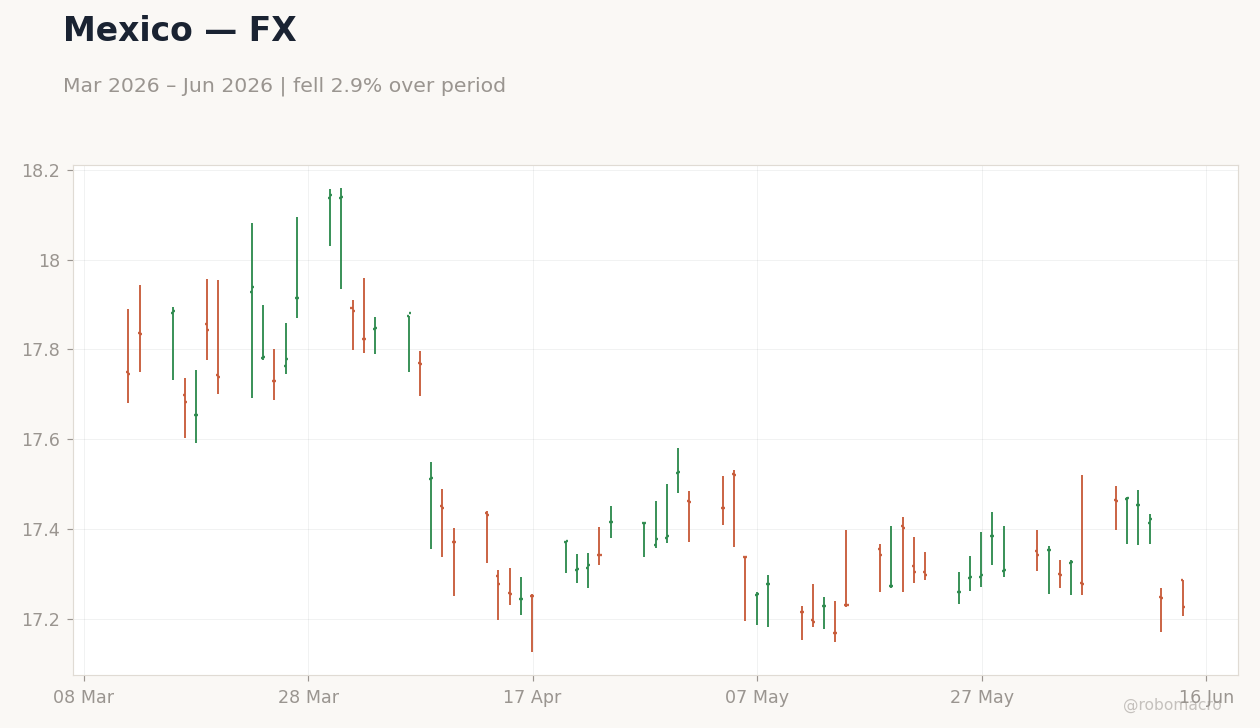
Emerging-market data flows diverged between disinflation surprises and activity resilience. Mexico’s May inflation printed below consensus on both year-over-year and month-over-month bases, returning headline CPI inside Banco de Mexico’s target band and lifting the IPC Bolsa 3.43 percent to 67,954.55 while USD/MXN fell 1.35 percent to 17.23. In contrast, Brazil activity data prompted upward revisions to the Selic path for 2026-2027, leaving BCB OIS curves showing limited movement and markets pricing the central bank on hold at the next COPOM decision. China’s May exports and imports both exceeded expectations, widening the trade surplus on AI hardware demand, while CPI printed below forecast and held flat month-over-month; the Shanghai Composite rose 1.82 percent to 4,031.51.
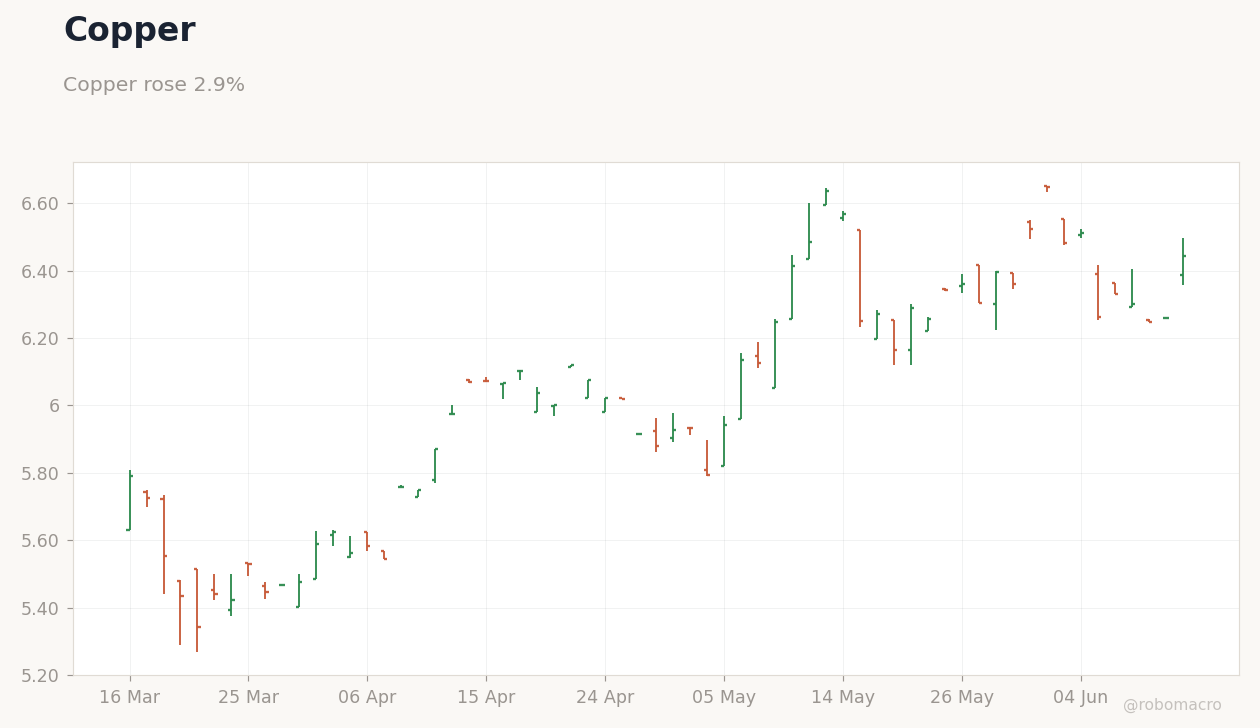
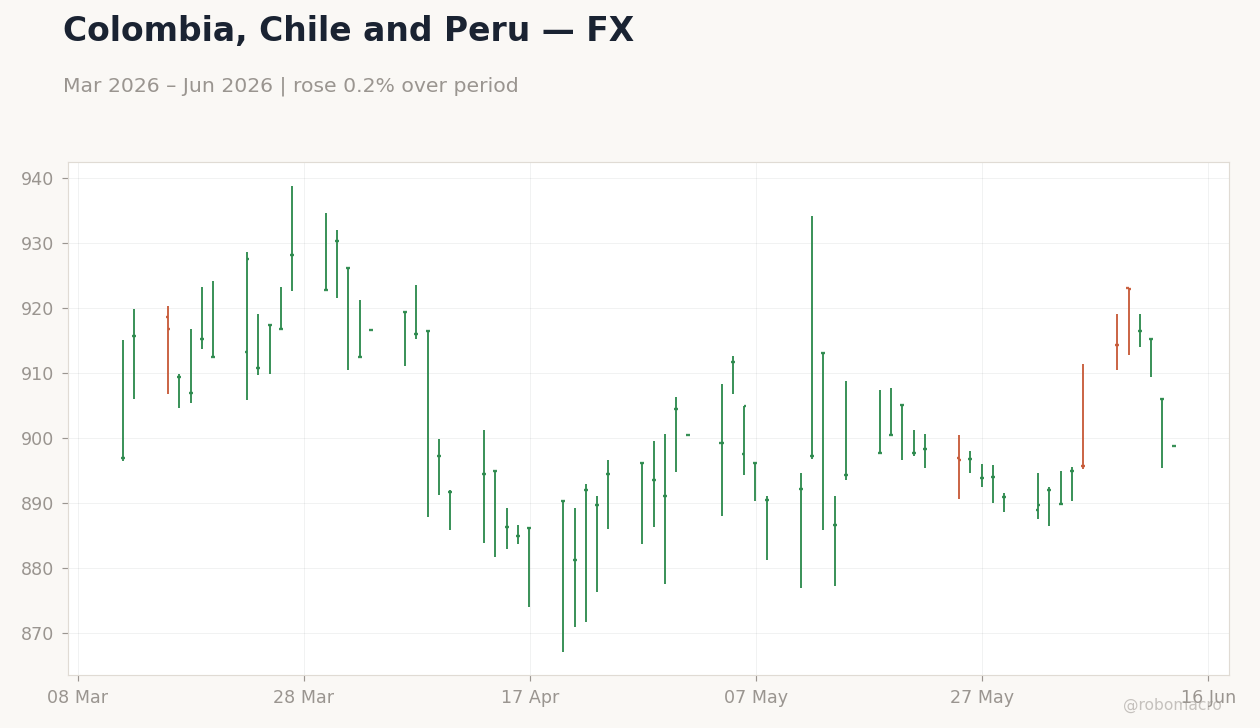
Andean markets posted the clearest risk-asset rebound, with MSCI Peru rising 12.0 percent to 87.56 and MSCI Chile advancing 9.15 percent to 41.50 as copper climbed 1.82 percent to 6.45. South Africa’s Q1 GDP expanded, supporting the rand and narrowing long-term yields even as the JSE Top 40 declined 2.24 percent. The pattern is one of selective domestic strength offset by external financing conditions that remain dollar-sensitive.
Cross-Asset Pricing Reflects Oil Relief and USD Resilience
Fixed-income curves steepened modestly while equities advanced in most regions outside the United States. US 2-year yields fell 7 basis points to 4.21 percent and 10-year yields declined 5 basis points to 4.49 percent, widening the 2s10s spread to +27 basis points. UK 10-year yields moved 4 basis points lower to 4.83 percent while the 2s10s spread reached +60 basis points. Brent crude declined 7.34 percent to 87.33 and WTI fell 7.03 percent to 84.88, reducing imported cost pressures for net importers across Asia and Europe. Gold fell 2.24 percent to 4,238.80 amid the stronger dollar tone.
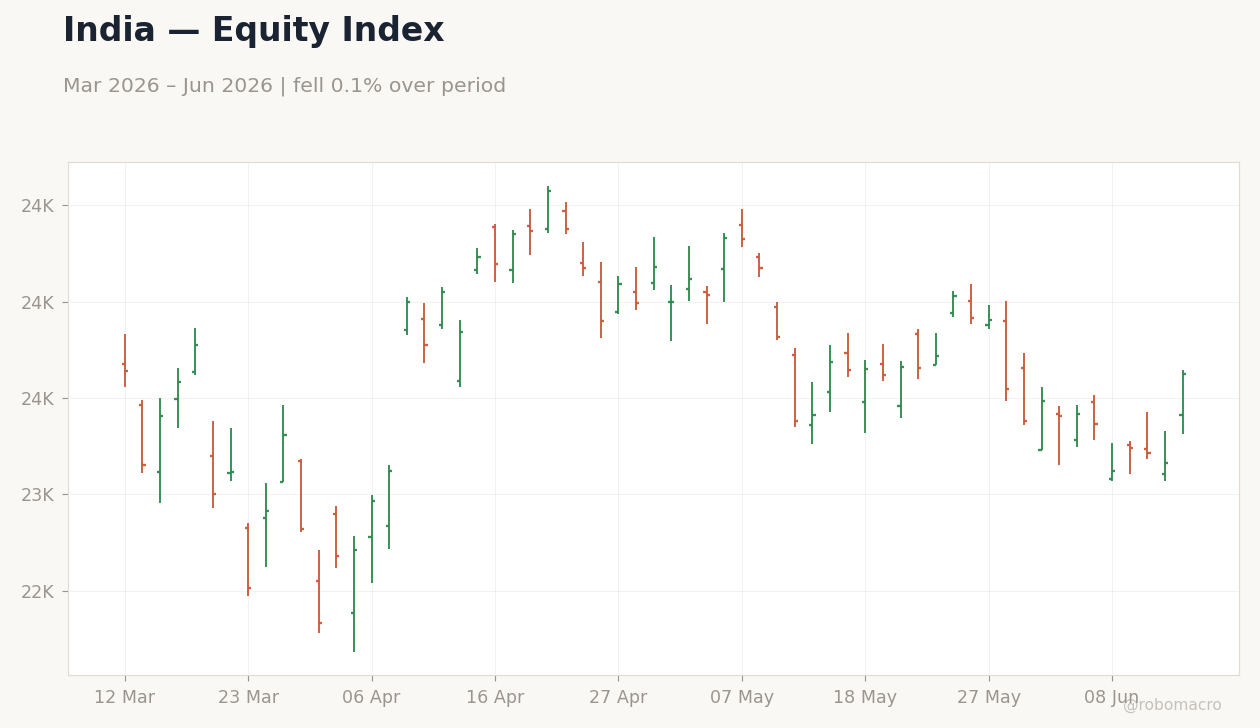
Equity indices in Europe and Asia outperformed, with the Nikkei 225 closing at 66,020.04 and the ASX 200 rising 2.32 percent to 8,804.0. The Nifty 50 advanced 2.16 percent to 23,622.9 while USD/INR closed at 95.1. These moves indicate that lower energy prices are freeing purchasing power without yet triggering broad risk-off positioning.
Policy Outlook Centers on Divergent Rate Paths
Central banks maintained a data-dependent stance with clear divergences emerging. The Federal Reserve faces reinforced higher-for-longer pricing after the CPI and labor data, while the Bank of Canada, SARB, and several Asian central banks held rates steady. Mexico’s disinflation surprise opened room for measured easing, yet Banxico OIS curves priced only gradual cuts. Brazil and Turkey OIS curves showed modest repricing tied to activity and fiscal risks. The PBoC conducted routine 7-day reverse repo operations and signed a direct yuan-rupiah settlement MoU, reinforcing liquidity management amid cash glut concerns. This landscape points to staggered normalization rather than coordinated easing through year-end.
Forward Look Centers on Next Week’s Inflation and Activity Prints
Markets will focus on incoming inflation prints from Europe and Asia as well as US labor data for further confirmation of the higher-for-longer path. Riksbank and Norges Bank decisions lie ahead, with OIS curves showing limited movement. Any further Brent price weakness below 87.33 would amplify disinflationary impulses in net-importing economies, while USD strength above 99.75 would continue to pressure EM external balances. The data flow next week will determine whether the current US-driven repricing extends or begins to moderate.
| Economy | Real GDP (% y/y) | Consumer Prices (% y/y) | ||||
|---|---|---|---|---|---|---|
| 2026E | 2027E | 2028E | 2026E | 2027E | 2028E | |
| Americas | ||||||
| United States | 2.0 | 1.9 | 1.8 | 2.3 | 2.2 | 2.1 |
| Canada | 1.8 | 1.7 | 1.6 | 2.1 | 2.0 | 2.0 |
| Mexico | 2.0 | 2.1 | 2.2 | 3.5 | 3.3 | 3.2 |
| Brazil | 2.2 | 2.3 | 2.4 | 4.0 | 3.8 | 3.5 |
| Argentina | 3.5 | 4.0 | 3.5 | 45.0 | 30.0 | 20.0 |
| Colombia | 3.0 | 3.2 | 3.1 | 4.5 | 4.0 | 3.8 |
| Chile | 2.5 | 2.6 | 2.7 | 3.5 | 3.2 | 3.0 |
| Peru | 3.0 | 3.1 | 3.2 | 2.8 | 2.7 | 2.6 |
| Asia / Pacific | ||||||
| Japan | 1.0 | 0.8 | 0.7 | 1.5 | 1.4 | 1.3 |
| China | 4.5 | 4.2 | 4.0 | 1.8 | 1.9 | 2.0 |
| India | 6.5 | 6.3 | 6.2 | 4.5 | 4.3 | 4.2 |
| Australia | 2.2 | 2.3 | 2.2 | 2.5 | 2.4 | 2.3 |
| New Zealand | 2.0 | 2.1 | 2.0 | 2.3 | 2.2 | 2.1 |
| South Korea | 2.3 | 2.2 | 2.1 | 2.0 | 2.0 | 2.0 |
| Indonesia | 5.0 | 5.1 | 5.0 | 2.5 | 2.4 | 2.3 |
| Malaysia | 4.5 | 4.6 | 4.5 | 2.2 | 2.1 | 2.0 |
| Philippines | 5.8 | 5.7 | 5.6 | 3.0 | 2.9 | 2.8 |
| Singapore | 2.5 | 2.6 | 2.5 | 2.0 | 2.0 | 2.0 |
| Thailand | 2.8 | 2.9 | 2.8 | 1.8 | 1.9 | 2.0 |
| Taiwan | 2.5 | 2.4 | 2.3 | 1.8 | 1.9 | 2.0 |
| Vietnam | 6.5 | 6.4 | 6.3 | 3.5 | 3.4 | 3.3 |
| Western Europe | ||||||
| Euro area | 1.2 | 1.3 | 1.4 | 2.0 | 2.0 | 2.0 |
| Germany | 0.8 | 1.0 | 1.2 | 2.1 | 2.0 | 2.0 |
| France | 1.3 | 1.4 | 1.4 | 1.9 | 2.0 | 2.0 |
| Italy | 0.9 | 1.0 | 1.1 | 2.0 | 2.0 | 2.0 |
| Spain | 2.0 | 1.9 | 1.8 | 2.2 | 2.1 | 2.0 |
| United Kingdom | 1.5 | 1.4 | 1.3 | 2.3 | 2.2 | 2.1 |
| Sweden | 2.0 | 2.1 | 2.0 | 2.0 | 2.0 | 2.0 |
| Norway | 1.8 | 1.7 | 1.6 | 2.2 | 2.1 | 2.0 |
| Denmark | 1.5 | 1.6 | 1.5 | 2.0 | 2.0 | 2.0 |
| Switzerland | 1.2 | 1.3 | 1.2 | 1.0 | 1.1 | 1.2 |
| Netherlands | 1.5 | 1.6 | 1.5 | 2.0 | 2.0 | 2.0 |
| Poland | 3.2 | 3.0 | 2.8 | 3.5 | 3.2 | 3.0 |
| Czech Republic | 2.5 | 2.4 | 2.3 | 2.5 | 2.3 | 2.2 |
| Hungary | 2.8 | 2.7 | 2.6 | 4.0 | 3.5 | 3.2 |
| Romania | 3.0 | 2.9 | 2.8 | 4.5 | 4.0 | 3.5 |
| EMEA Emerging | ||||||
| Turkey | 3.0 | 3.5 | 3.5 | 25.0 | 18.0 | 12.0 |
| South Africa | 1.5 | 1.8 | 2.0 | 4.5 | 4.3 | 4.0 |
| Israel | 3.5 | 3.3 | 3.2 | 2.5 | 2.4 | 2.3 |
| Saudi Arabia | 3.5 | 3.2 | 3.0 | 2.0 | 2.0 | 2.0 |
| UAE | 4.0 | 3.8 | 3.5 | 2.0 | 2.0 | 2.0 |
| Egypt | 4.0 | 4.5 | 4.5 | 20.0 | 15.0 | 12.0 |
| Nigeria | 3.2 | 3.5 | 3.8 | 22.0 | 18.0 | 15.0 |
| Kenya | 5.0 | 5.2 | 5.1 | 5.0 | 4.5 | 4.0 |
| Global Aggregates | ||||||
| Global | 3.2 | 3.1 | 3.0 | 3.5 | 3.3 | 3.2 |
| Developed markets | 1.6 | 1.5 | 1.5 | 2.1 | 2.0 | 2.0 |
| Emerging markets | 4.2 | 4.1 | 4.0 | 4.5 | 4.2 | 4.0 |
| Central Bank | Instrument | Current Rate |
Last Change |
bp | Next Meeting |
Expected Move |
Q1 2026 |
Q2 2026 |
Q3 2026 |
Q4 2026 |
|---|---|---|---|---|---|---|---|---|---|---|
| The Americas | ||||||||||
| Federal Reserve | Fed funds upper | 3.75% | Dec 2025 | -25 | Jul 29 | Hold | 4.00 | 3.75 | 3.50 | 3.25 |
| Bank of Canada | O/N rate | 2.75% | Mar 2026 | -25 | Jul 15 | Hold | 3.00 | 2.75 | 2.50 | 2.50 |
| BCB (Brazil) | SELIC | 10.50% | May 2026 | -25 | Jun 18 | Hold | 10.75 | 10.50 | 10.25 | 10.00 |
| Banxico | O/N rate | 8.00% | Mar 2026 | -25 | Jun 26 | Hold | 8.25 | 8.00 | 7.75 | 7.50 |
| BCRA (Argentina) | Repo rate | 29.00% | Apr 2026 | -200 | Jun 19 | -200bp | 32.00 | 29.00 | 26.00 | 23.00 |
| BanRep (Colombia) | Repo | 9.25% | Apr 2026 | -25 | Jun 27 | Hold | 9.50 | 9.25 | 9.00 | 8.75 |
| BCCh (Chile) | MPR | 5.00% | Jan 2026 | -25 | Jul 29 | Hold | 5.25 | 5.00 | 4.75 | 4.50 |
| Europe / Africa | ||||||||||
| ECB | Depo rate | 2.00% | Apr 2026 | -25 | Jul 23 | Hold | 2.25 | 2.00 | 1.75 | 1.50 |
| Bank of England | Bank rate | 4.00% | May 2026 | -25 | Jun 18 | Hold | 4.25 | 4.00 | 3.75 | 3.50 |
| Riksbank | Repo rate | 2.25% | May 2026 | -25 | Jul 2 | Hold | 2.50 | 2.25 | 2.00 | 1.75 |
| Norges Bank | Dep rate | 4.25% | Mar 2026 | -25 | Jun 18 | Hold | 4.50 | 4.25 | 4.00 | 3.75 |
| SNB | Policy rate | 0.25% | Mar 2026 | -25 | Jun 18 | Hold | 0.50 | 0.25 | 0.00 | 0.00 |
| CNB (Czech) | 2-wk repo | 3.50% | May 2026 | -25 | Jun 25 | Hold | 3.75 | 3.50 | 3.25 | 3.00 |
| NBH (Hungary) | Base rate | 6.50% | Mar 2026 | -25 | Jun 24 | Hold | 6.75 | 6.50 | 6.25 | 6.00 |
| NBP (Poland) | Ref rate | 5.75% | May 2026 | 0 | Jul 9 | Hold | 5.75 | 5.75 | 5.50 | 5.25 |
| SARB | Repo rate | 7.25% | Jan 2026 | -25 | Jul 23 | Hold | 7.50 | 7.25 | 7.00 | 6.75 |
| CBRT (Turkey) | 1-wk repo | 46.00% | Apr 2026 | -300 | Jun 26 | -300bp | 50.00 | 46.00 | 42.00 | 38.00 |
| Asia / Pacific | ||||||||||
| RBA | Cash rate | 3.85% | May 2026 | -25 | Jul 7 | Hold | 4.10 | 3.85 | 3.60 | 3.35 |
| RBNZ | OCR | 3.25% | May 2026 | -25 | Jul 9 | Hold | 3.50 | 3.25 | 3.00 | 2.75 |
| BoJ | Pol rate | 0.50% | Jan 2026 | +25 | Jul 30 | Hold | 0.25 | 0.50 | 0.50 | 0.75 |
| PBoC | 1-yr LPR | 3.00% | Sep 2024 | -10 | Jul 15 | Hold | 3.00 | 3.00 | 2.90 | 2.80 |
| RBI (India) | Repo rate | 6.25% | Apr 2025 | -25 | Jun 6 | Hold | 6.25 | 6.25 | 6.00 | 5.75 |
| BoK (Korea) | Base rate | 2.75% | May 2026 | -25 | Jul 16 | Hold | 3.00 | 2.75 | 2.50 | 2.25 |
| BI (Indonesia) | BI-Rate | 5.75% | Apr 2026 | -25 | Jun 18 | Hold | 6.00 | 5.75 | 5.50 | 5.25 |
| BSP (Philippines) | Rev repo | 5.75% | Apr 2026 | -25 | Jun 26 | Hold | 6.00 | 5.75 | 5.50 | 5.25 |
| BoT (Thailand) | 1-day repo | 1.75% | Apr 2025 | -25 | Jun 25 | Hold | 1.75 | 1.75 | 1.50 | 1.25 |
| CBC (Taiwan) | Disc rate | 2.00% | Dec 2024 | 0 | Jun 19 | Hold | 2.00 | 2.00 | 1.75 | 1.50 |
| MAS (Singapore) | SGD NEER | 0% slope% | Apr 2025 | 0 | Jul 15 | Hold | 0% slope | 0% slope | 0% slope | 0% slope |


Week in Review
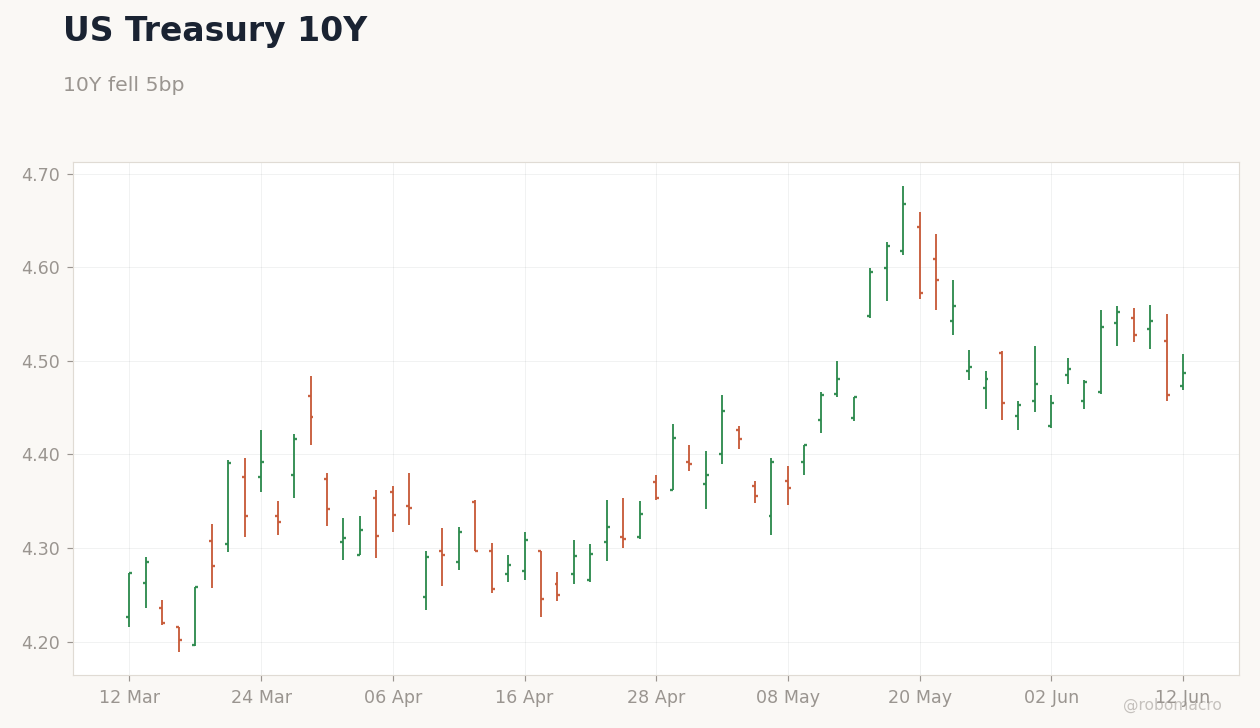
UK 2-year gilt yields led declines among major DM markets, falling 12bp to 4.23%. U.S. Treasuries saw yields ease modestly with the 10-year declining 5bp to close at 4.49%. German bund yields fell 4bp to 3.00%, while Japanese 10-year yields moved 3bp lower to 2.64%. The U.S. 10-year yield exhibited volatility over the week, opening at 4.5520 on Monday, declining to 4.5280 on Tuesday, rising to 4.5420 midweek on Wednesday, before falling sharply to 4.4630 on Thursday and settling at 4.4870 on Friday. Similar patterns were seen in the 5-year and 30-year sectors with the latter closing at 4.9750. Long-dated JGBs outperformed with the 30-year yield dropping 10bp to 3.80%.
Curve & Spreads
The U.S. 2s10s curve sits at +27bp, compared to +38bp in Germany and +60bp in the UK. The UK curve is notably steeper than its U.S. and German counterparts. These positive slopes across major markets imply expectations for improving growth conditions ahead. The flatter U.S. curve relative to the UK suggests more tempered growth expectations in the U.S.
EM Bonds
Turkish 10-year yields stand at 33.87% while Brazilian 10-year yields are at 14.48%. South African 10-year yields closed at 8.51% and Indonesian 10-year yields at 7.17%. Turkish yields moved significantly lower over the week, with the curve remaining deeply inverted at 2s10s of -891bp. EM yields generally remain elevated relative to DM levels. Brazilian yields fell to 14.48% and South African yields declined to 8.51%, while Indonesian yields rose to 7.17% for the 10-year and 7.45% for the 30-year.
Central Bank Read
Yield moves suggest a general easing bias priced into major central banks. In the U.S., the 2-year yield fell 7bp compared to a 5bp decline in the 10-year and only 2bp in the 30-year, steepening the curve and implying an easing bias. Similar patterns emerged in the UK where the 2-year fell 12bp versus 4bp in the 10-year, and in Germany with 7bp and 4bp declines respectively. The curve shape across these markets implies policy accommodation ahead as front-end rates outpaced long-end declines. In Japan, smaller moves with the 30-year falling 10bp point to ongoing easing measures. Front-end outperformance versus back-end moves reinforces this directional easing bias in DM curves.
Week Ahead
Next week brings CPI and inflation prints, payrolls and jobs data, central bank meetings from the Fed, ECB, BoE and BoJ, GDP releases, and Treasury auctions. These events will be watched closely for signals on policy direction. The inflation prints and central bank meetings matter most for duration risk because they will directly influence yield levels and curve shape. Stronger-than-expected inflation would pressure yields higher while softer data or dovish signals would ease duration concerns.
| Country | 2Y | 2Y WoW | 10Y | 10Y WoW | 30Y | 30Y WoW | 2s10s |
|---|---|---|---|---|---|---|---|
| United States | 4.21% | -7bp | 4.49% | -5bp | 4.97% | -2bp | +27bp |
| United Kingdom | 4.23% | -12bp | 4.83% | -4bp | 5.54% | -6bp | +60bp |
| Germany | 2.62% | -7bp | 3.00% | -4bp | 3.55% | -2bp | +38bp |
| France | 2.79% | -9bp | 3.65% | -4bp | 4.53% | -2bp | +86bp |
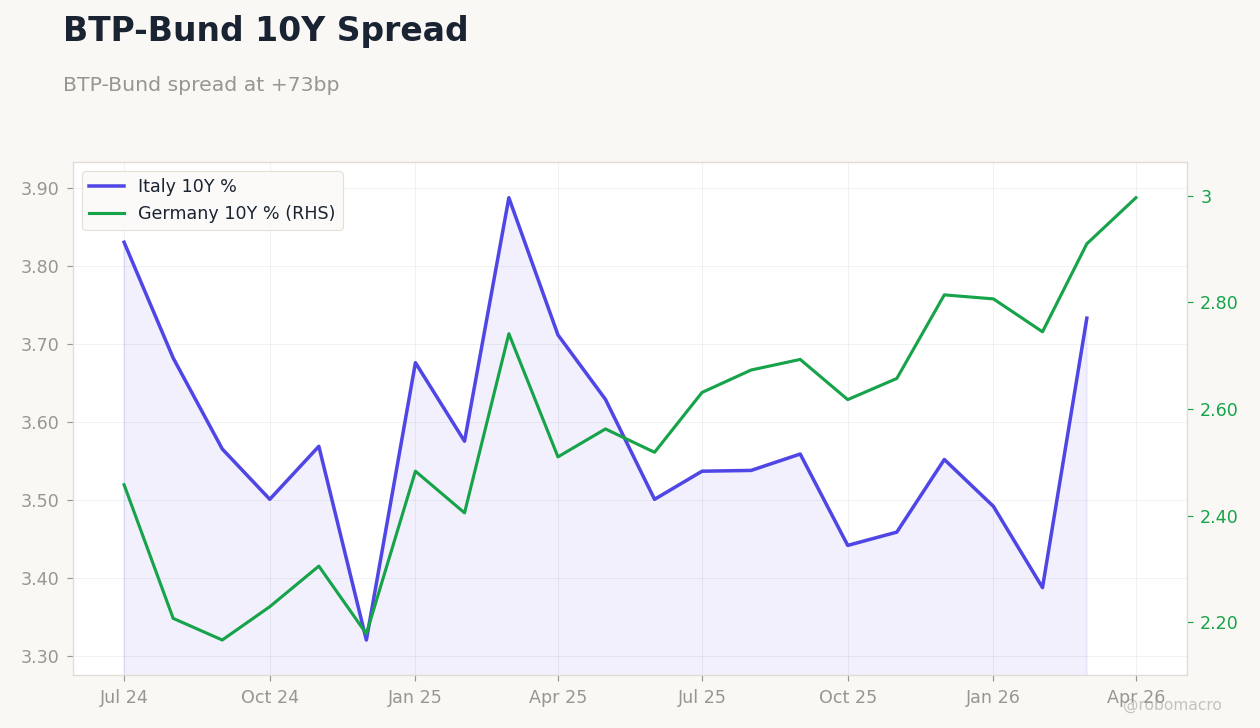
| Italy | 2.81% | -9bp | 3.73% | -8bp | 4.58% | -6bp | +92bp |
| Spain | 2.77% | -1bp | 3.45% | -1bp | 4.19% | -2bp | +67bp |
| Japan | 1.41% | -1bp | 2.64% | -3bp | 3.80% | -10bp | +123bp |
| Canada | 2.76% | -11bp | 3.40% | -7bp | 3.82% | -1bp | +64bp |
| Australia | 4.49% | -16bp | 4.81% | -13bp | 5.35% | -6bp | +33bp |
| China | 1.28% | +5bp | 1.74% | +2bp | 2.23% | +3bp | +46bp |
| India | 6.20% | -24bp | 6.89% | -7bp | 7.54% | -6bp | +69bp |
| Brazil | 14.47% | -17bp | 14.48% | -28bp | — | — | +1bp |
| Mexico | — | — | 9.03% | -12bp | — | — | — |
| South Korea | 3.67% | -11bp | 4.21% | -4bp | 4.26% | -1bp | +54bp |
| Indonesia | — | — | 7.17% | +26bp | 7.45% | +44bp | — |
| Turkey | 42.78% | -96bp | 33.87% | -73bp | — | — | -891bp |
| South Africa | — | — | 8.51% | -21bp | 9.07% | -19bp | — |
| Poland | — | — | 5.61% | -20bp | — | — | — |
US Treasury yields fell across the curve, led by the 2-year down 7bp to 4.21%. UK and Australian 2-year yields posted the largest developed-market declines, easing 12bp and 16bp. Turkey recorded the steepest drops globally, with the 2-year plunging 96bp and the 10-year 73bp. Indonesia bucked the trend as the sole notable riser, with 10-year yields climbing 26bp. Curves steepened markedly in Japan and Italy, 2s10s widening 123bp and 92bp. European peripherals outperformed Germany on the week. Next week, focus centers on fresh inflation prints and central-bank signals.


Week in Review
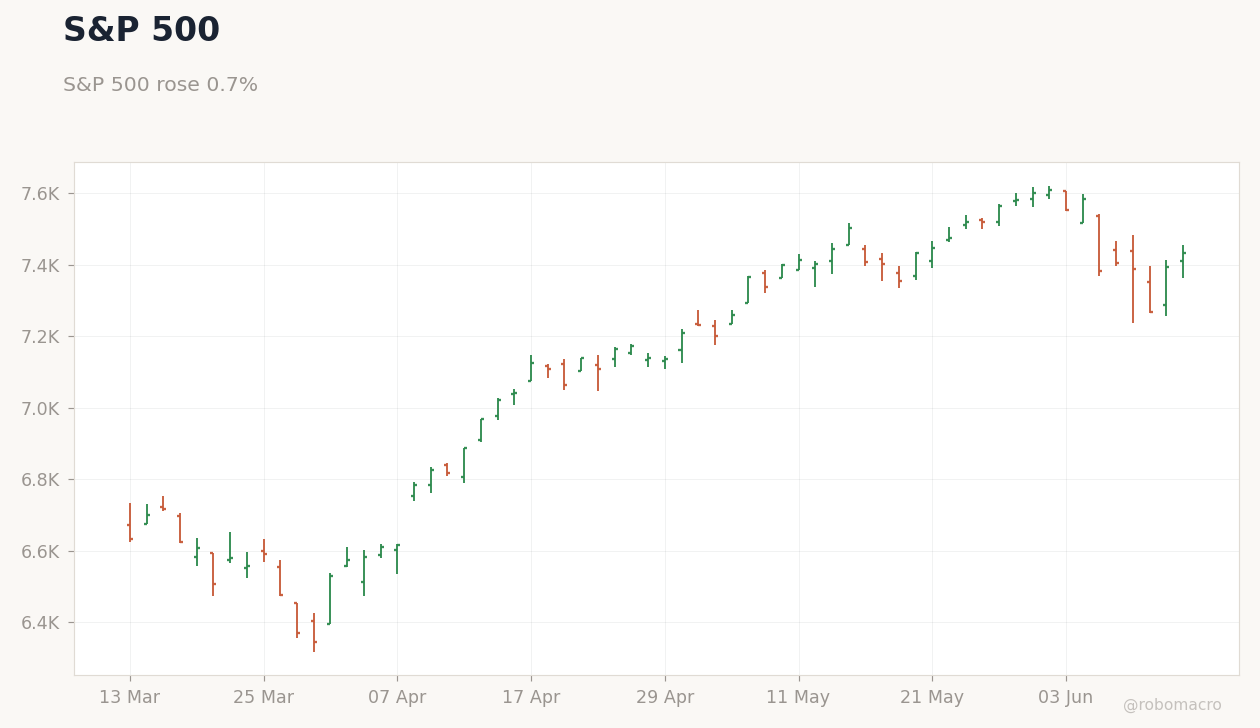
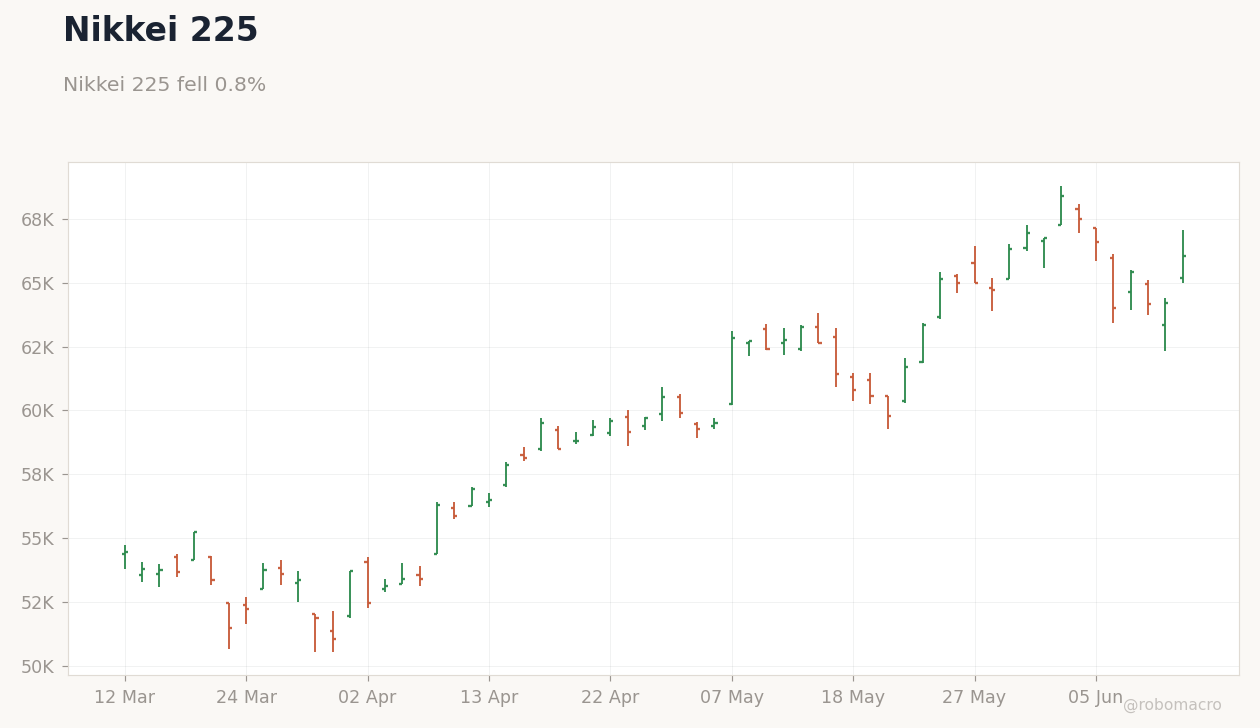
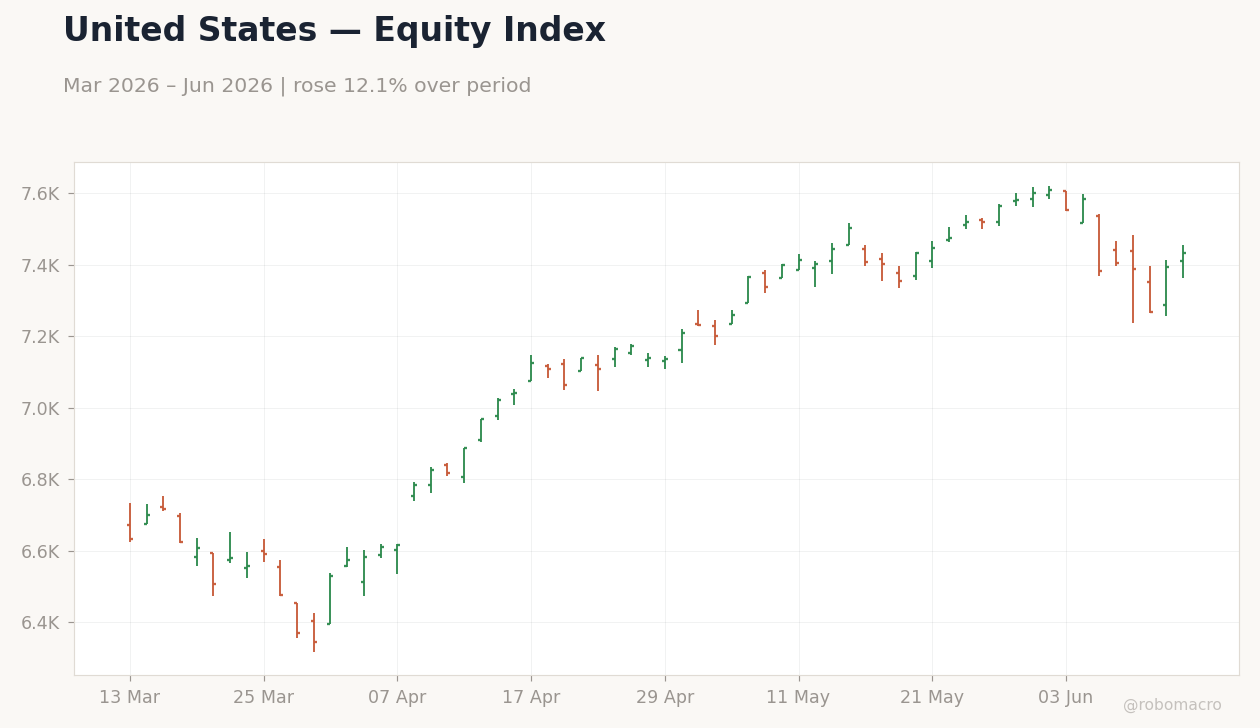
The S&P 500 rose 0.7% week-over-week to close at 7,431. The index followed a volatile path during the week, opening at 7,406 on Monday before declining to 7,387 on Tuesday and plunging to 7,267 on Wednesday amid market whipsaws. It then recovered to 7,394 on Thursday and climbed further to close at 7,431 on Friday. In Europe, the Euro Stoxx 50 gained 2.1% to finish at 6,188 after falling to 6,010 on Wednesday and rallying strongly in the final sessions. Asian markets lagged with the Nikkei 225 falling 0.8% to 66,020 despite ending the week on a high note at that level from Thursday’s 64,217. Emerging markets displayed strength as the Russell 2000 surged 3.9% to 2,944, the IPC Mexico rose 2.7% to 67,955, Ibovespa added 1.2% and JSE Top 40 gained 2.2%.
Regional Divergences
European indices outperformed their peers with the Euro Stoxx 50 up 2.1%, CAC 40 advancing 1.6%, FTSE 100 rising 1.0% and FTSE MIB surging 3.2%. This contrasted with more modest gains in North America where the S&P 500 and Dow Jones both rose 0.7% while the S&P/TSX gained 1.5%. Asian benchmarks mostly declined with the Nikkei 225 down 0.8%, Hang Seng falling 1.0%, CSI 300 off 0.8% and KOSPI slipping 0.5%. These regional divergences can be connected to varied macro catalysts including strong employment data in Canada, inflation prints below expectations in Mexico that bolstered local equities, and US CPI data that reinforced higher-for-longer policy expectations leading to tech rotation. In Latin America, resilient activity data in Brazil helped limit declines despite falling crude prices.
Volatility & Risk Appetite
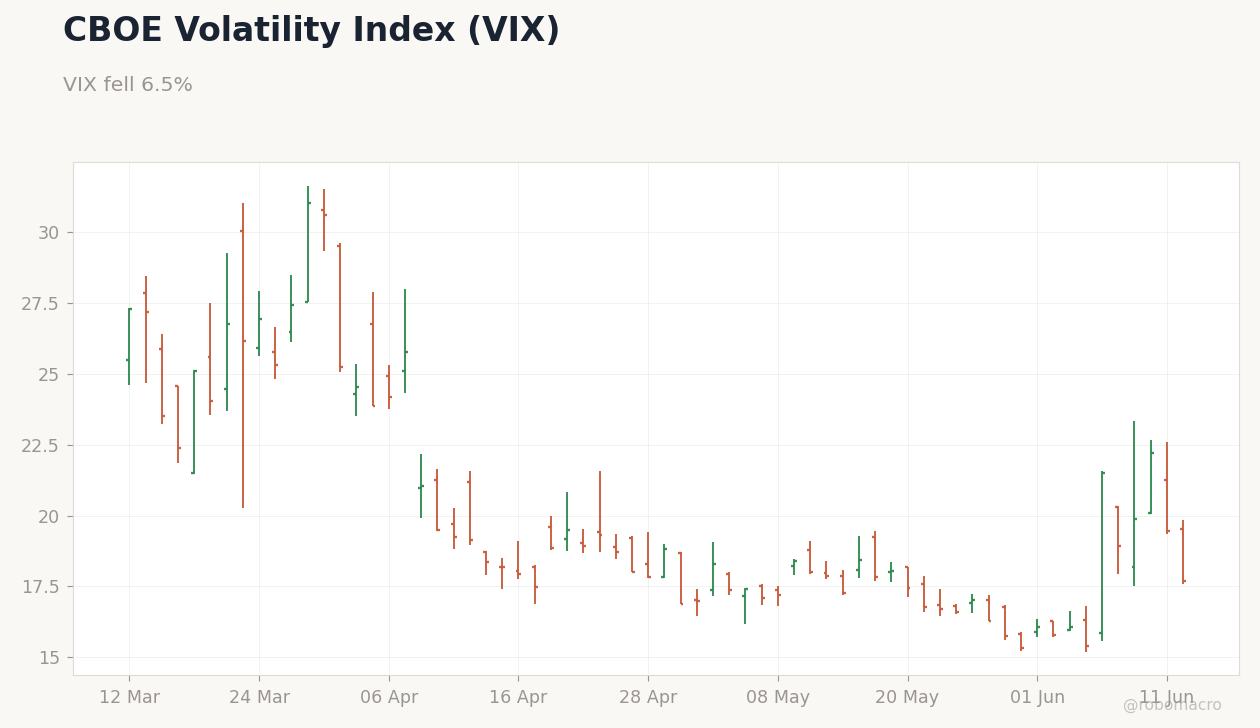
The VIX closed at 17.7 on Friday after reaching 22.2 on Wednesday. Growth stocks outperformed value counterparts as evidenced by the Nasdaq 100 rising 2.3% compared to the Dow Jones increase of 0.7%. Small capitalization stocks outperformed large caps with the Russell 2000 gaining 3.9% versus the S&P 500’s 0.7% rise. Sector signals from commodity and rate moves were mixed with energy under pressure following a 6.2% decline in WTI Crude and Brent Crude while copper climbed 2.9% indicating selective strength in industrials. Gold fell 2.3% and silver 1.4% amid shifting rate expectations while bond yields fell across major markets providing support to risk assets.
Week Ahead
The economic calendar for the coming week includes several central bank meetings and data releases that could impact global equities. Riksbank and Norges Bank decisions lie ahead and may influence regional risk sentiment in the Nordic countries. Any CPI or PMI prints that come in hotter than expected would likely trigger risk-off moves in equities while softer data could bolster risk-on positioning. Corporate earnings reports will also remain in focus following recent whipsaws and the equity funding squeeze.
| Index | Level | WoW | MTD | YTD |
|---|---|---|---|---|
| S&P 500 | 7,431 | +0.7% | -2.2% | +8.3% |
| Nasdaq 100 | 29,636 | +2.3% | -2.9% | +17.6% |
| Dow Jones | 51,202 | +0.7% | +0.2% | +5.8% |
| Russell 2000 | 2,944 | +3.9% | +1.3% | +17.4% |
| S&P/TSX | 34,938 | +1.5% | +0.6% | +9.6% |
| FTSE 100 | 10,472 | +1.0% | +1.3% | +5.2% |
| Euro Stoxx 50 | 6,188 | +2.1% | +2.5% | +4.5% |
| DAX | 24,635 | -0.5% | -1.5% | +0.4% |
| CAC 40 | 8,351 | +1.6% | +2.5% | +1.9% |
| FTSE MIB | 51,497 | +3.2% | +3.5% | +13.5% |
| IBEX 35 | 18,764 | +2.3% | +3.2% | +7.3% |
| Nikkei 225 | 66,020 | -0.8% | -1.4% | +27.4% |
| Hang Seng | 24,718 | -1.0% | -2.7% | -6.2% |
| CSI 300 | 4,777 | -0.8% | -1.4% | +1.3% |
| S&P/ASX 200 | 8,804 | +2.1% | +0.8% | +0.9% |
| KOSPI | 8,124 | -0.5% | -7.6% | +88.5% |
| Nifty 50 | 23,623 | +1.1% | +1.0% | -9.7% |
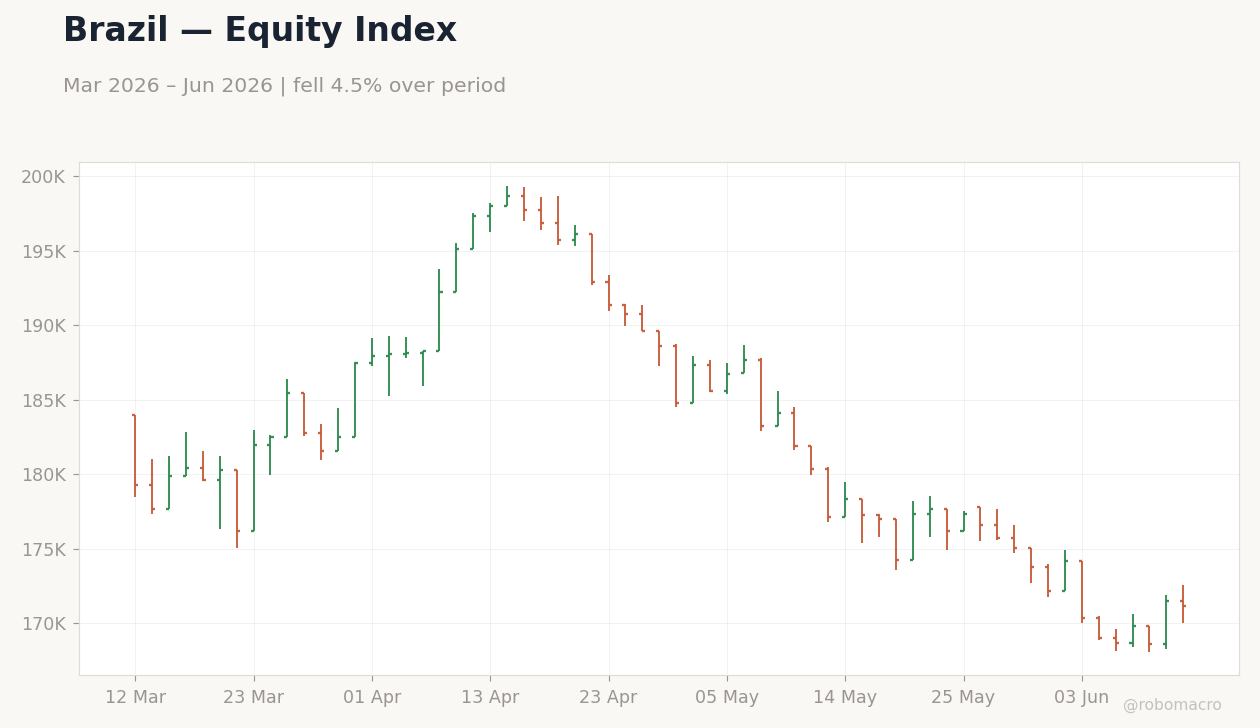
| Ibovespa | 171,133 | +1.2% | -0.6% | +6.6% |
| IPC Mexico | 67,955 | +2.7% | -0.3% | +5.9% |
| JSE Top 40 | 6,908 | +2.2% | +1.0% | -2.1% |
Global equities posted mixed weekly gains. The Russell 2000 led advances with a 3.9% rise, followed by the FTSE MIB’s 3.2% gain and the Nasdaq 100’s 2.3% increase. The S&P 500 edged up 0.7% while the Dow Jones added 0.7%. On the downside, the Hang Seng fell 1.0%, the Nikkei 225 declined 0.8% and the CSI 300 dropped 0.8%. The DAX slipped 0.5% even as the Euro Stoxx 50 rose 2.1%. The KOSPI’s 88.5% year-to-date advance stands out amid its 0.5% weekly decline. Divergences emerged between U.S. small caps and Asian markets. Next week’s focus will center on inflation data and policy updates.
| Index | WoW | MTD | YTD |
|---|---|---|---|
| S&P 500 | +0.7% | -2.2% | +8.3% |
| Nasdaq 100 | +2.3% | -2.9% | +17.6% |
| Dow Jones | +0.7% | +0.2% | +5.8% |
| Russell 2000 | +3.9% | +1.3% | +17.4% |
| S&P/TSX | +1.5% | +0.6% | +9.6% |
| FTSE 100 | +1.0% | +1.3% | +5.2% |
| Euro Stoxx 50 | +2.1% | +2.5% | +4.5% |
| DAX | -0.5% | -1.5% | +0.4% |
| CAC 40 | +1.6% | +2.5% | +1.9% |
| FTSE MIB | +3.2% | +3.5% | +13.5% |
| IBEX 35 | +2.3% | +3.2% | +7.3% |
| Nikkei 225 | -0.8% | -1.4% | +27.4% |
| Hang Seng | -1.0% | -2.7% | -6.2% |
| CSI 300 | -0.8% | -1.4% | +1.3% |
| S&P/ASX 200 | +2.1% | +0.8% | +0.9% |
| KOSPI | -0.5% | -7.6% | +88.5% |
| Nifty 50 | +1.1% | +1.0% | -9.7% |
| Ibovespa | +1.2% | -0.6% | +6.6% |
| IPC Mexico | +2.7% | -0.3% | +5.9% |
| JSE Top 40 | +2.2% | +1.0% | -2.1% |


Week in Review
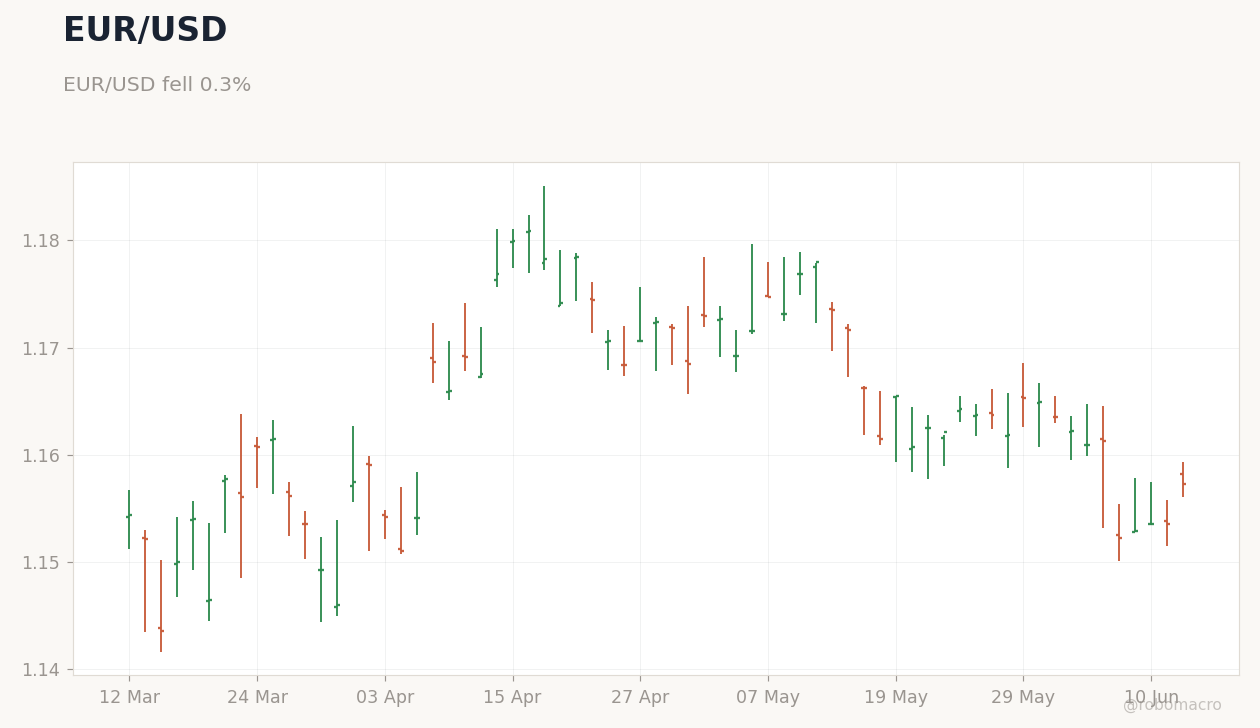
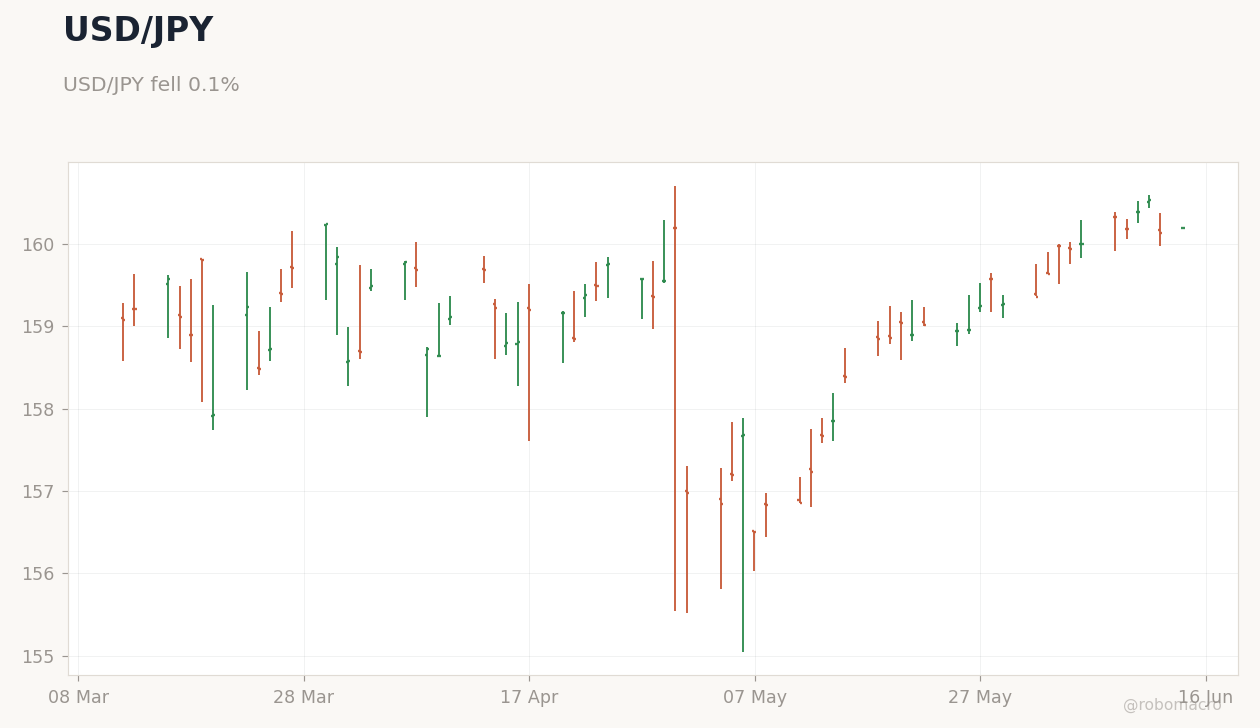
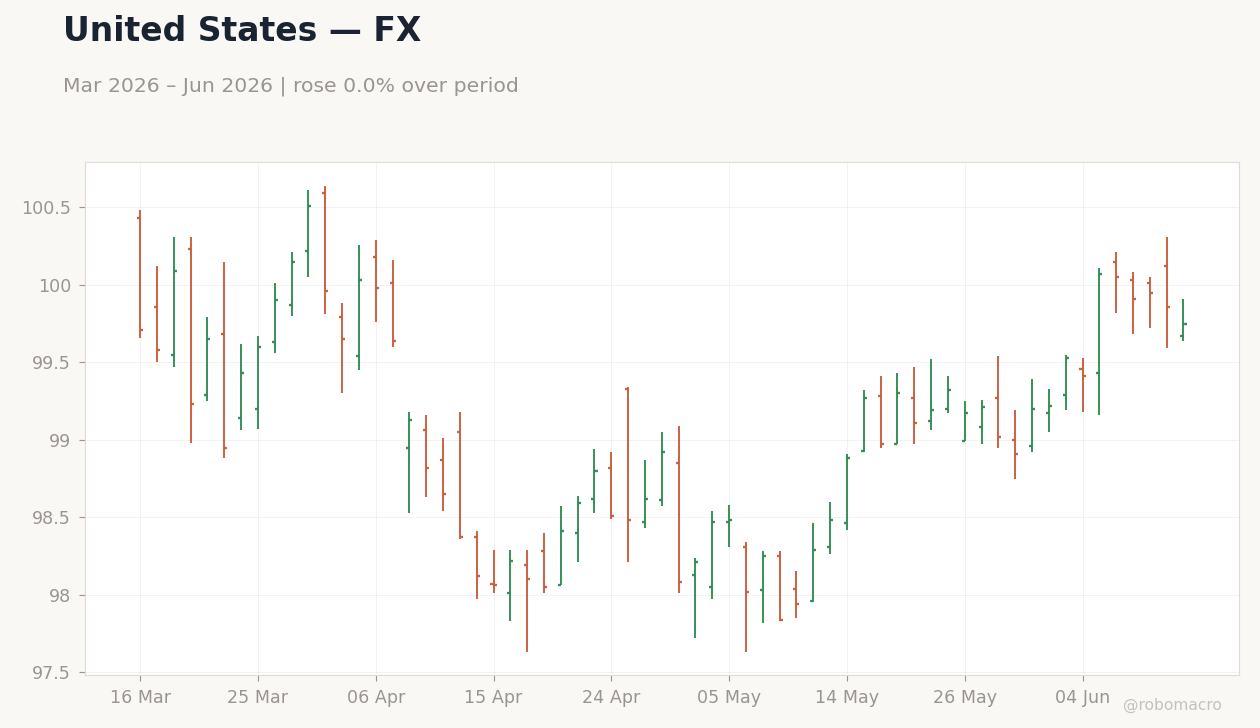
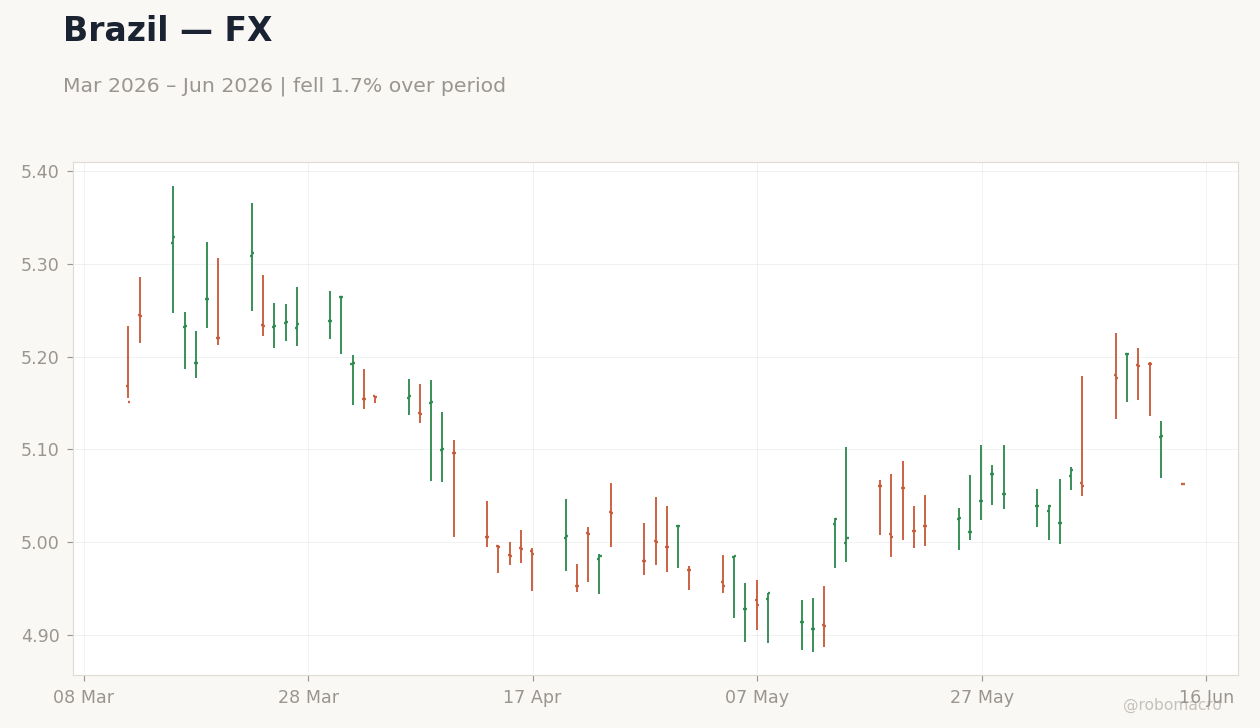
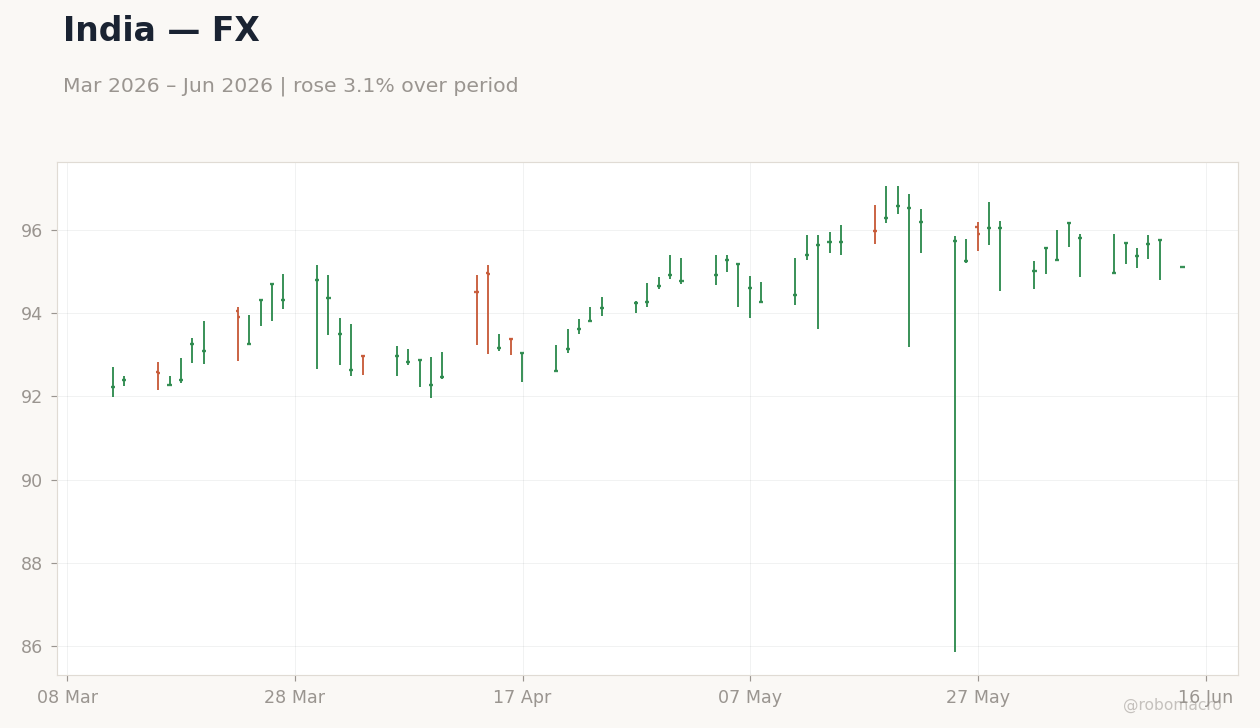
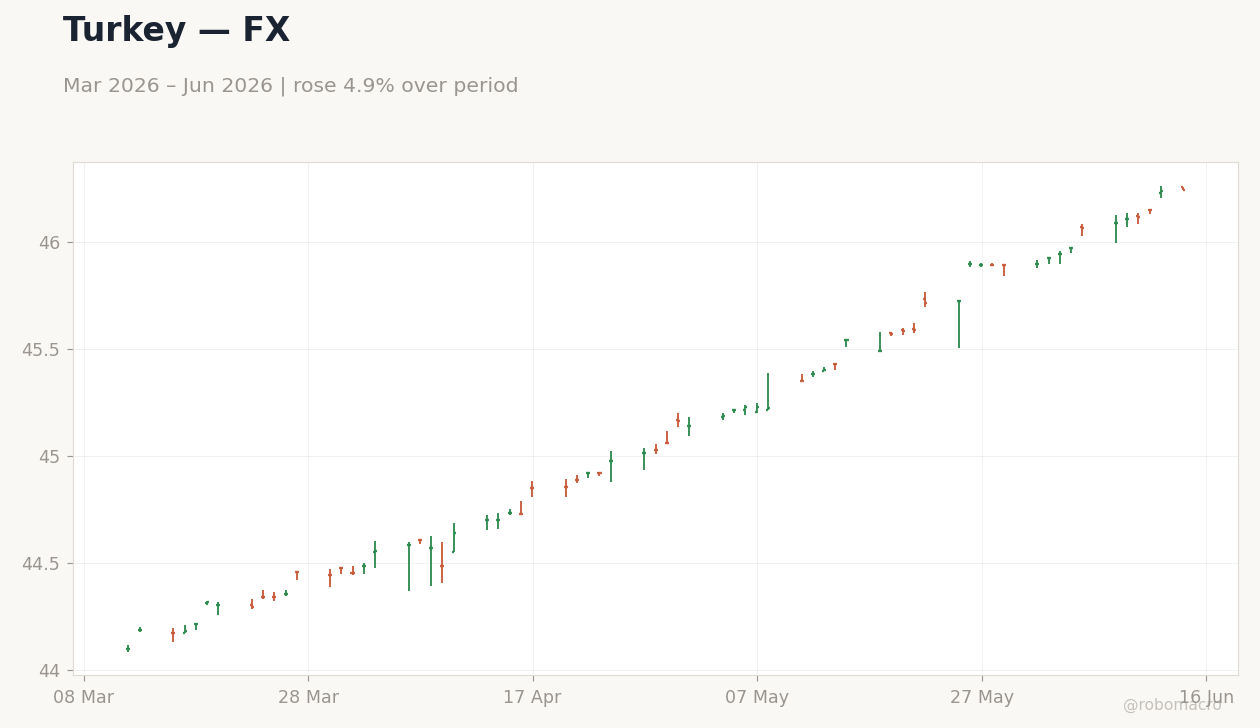
The DXY fell 0.3% this week to 99.75. It held steady at 99.9 from Tuesday through Thursday before slipping to 99.8 on Friday. In G10 FX, EUR/USD declined 0.3% to 1.1573, GBP/USD rose 0.5% to 1.3408, and USD/JPY eased 0.1% to 160.19. AUD/USD gained 0.1% to 0.7049 while NZD/USD climbed 0.7% to 0.5835; USD/CAD rose 0.3% to 1.3985 and USD/CHF slipped 0.1% to 0.7956. EM pairs were mostly softer for the dollar, with USD/BRL falling 2.2% to 5.0626, USD/MXN down 1.4% to 17.23, USD/ZAR lower by 1.7% to 16.27, USD/TRY up 0.3% to 46.24, and USD/CNY little changed at 6.7621 after a 0.1% decline.
Dollar & G10
The dollar weakened modestly as improved risk sentiment from Iran peace hopes offset supportive rate differentials, with the US 2s10s at +27bp versus wider curves such as the UK at +60bp, Germany at +38bp, and Japan at +123bp. EUR/USD closed the week at 1.1573 after a 0.3% decline, having advanced from 1.1523 on Monday through steady gains to 1.1573 on Friday. GBP/USD rose 0.5% to 1.3408, moving from 1.3336 on Monday to 1.3414 on Friday. USD/JPY ended at 160.19, down 0.1% on the week after fluctuating between 160 and 161 in daily closes.
EM FX
EM FX saw broad dollar softening tied to shifting commodity prices and local bond yield differentials. USD/BRL fell 2.2% to 5.0626 as risk appetite improved and Brazilian curves flattened to +1bp. USD/MXN declined 1.4% to 17.23 after inflation data narrowed rate gaps with the US. USD/ZAR dropped 1.7% to 16.27 while USD/TRY edged 0.3% higher to 46.24 despite an inverted Turkish curve at -891bp. USD/CNY eased 0.1% to 6.7621, reflecting relatively stable yield differentials versus the US.
Bitcoin & Crypto
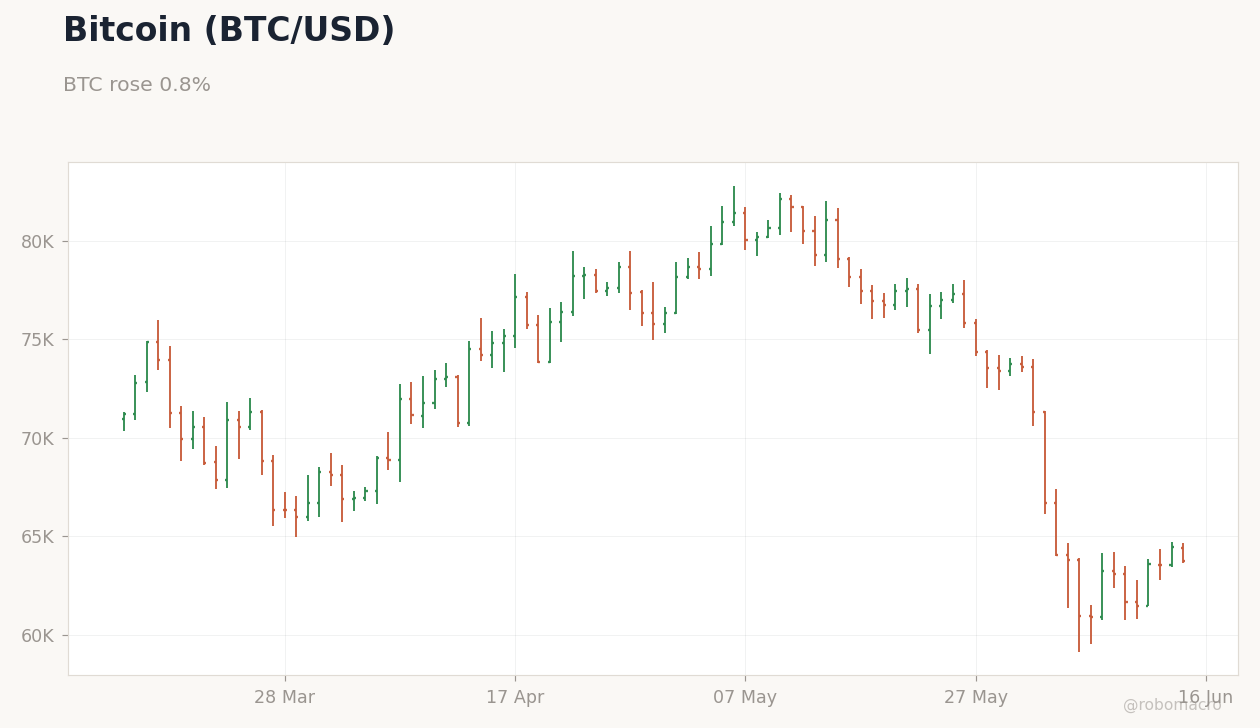
Bitcoin rose 0.8% on the week to $63,780. It advanced from 61,449 on Wednesday to 63,561 on Thursday, held near 63,543 on Friday, and reached 64,421 on Saturday. Ethereum fell 1.5% to $1,661 while Solana gained 1.6% to $67 and XRP declined 2.0% to $1. Digital assets displayed resilience amid equity rotation out of tech names, with Bitcoin outperforming Ethereum and XRP as risk sentiment improved on peace hopes and select central bank signals.
Week Ahead
Central bank rate decisions remain in focus and will move FX directly through their impact on rate differentials. CPI releases are due in several major economies and could alter yield curves and currency positioning. Trade balance data for select EM countries may sway pairs such as USD/MXN and USD/BRL. Crypto markets will monitor any regulatory events or protocol developments, though none are explicitly flagged for the coming week.


Week in Review
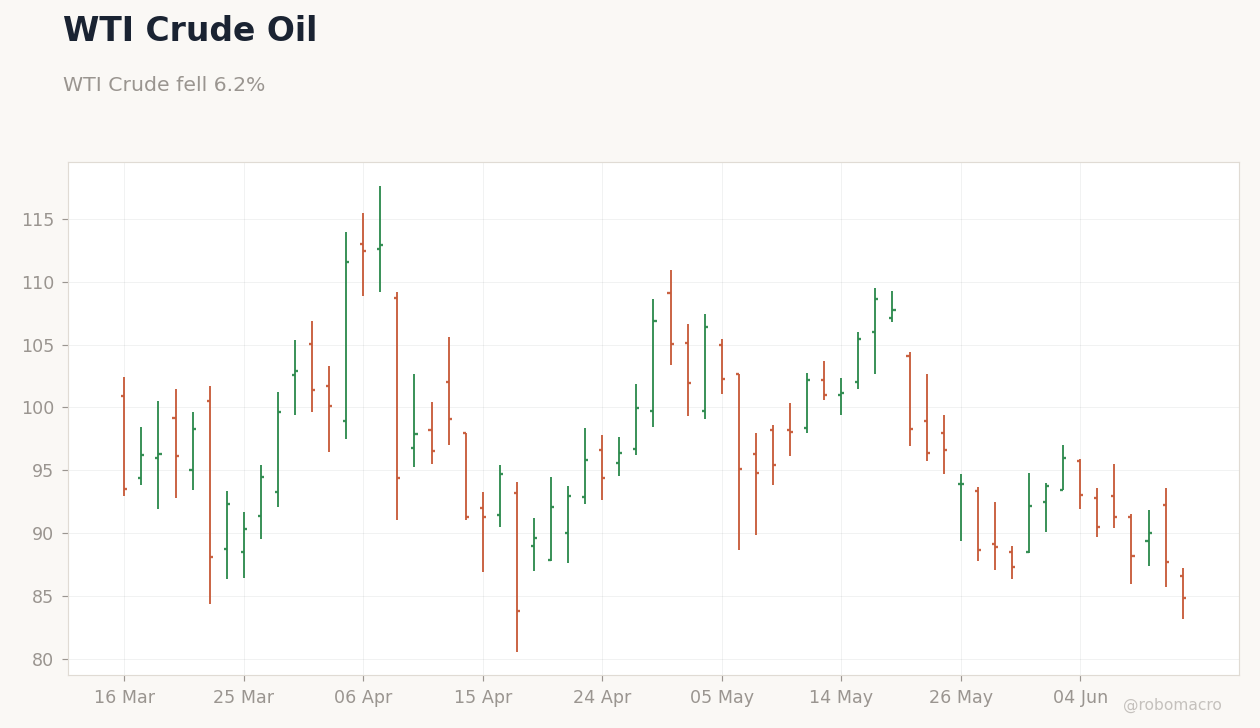
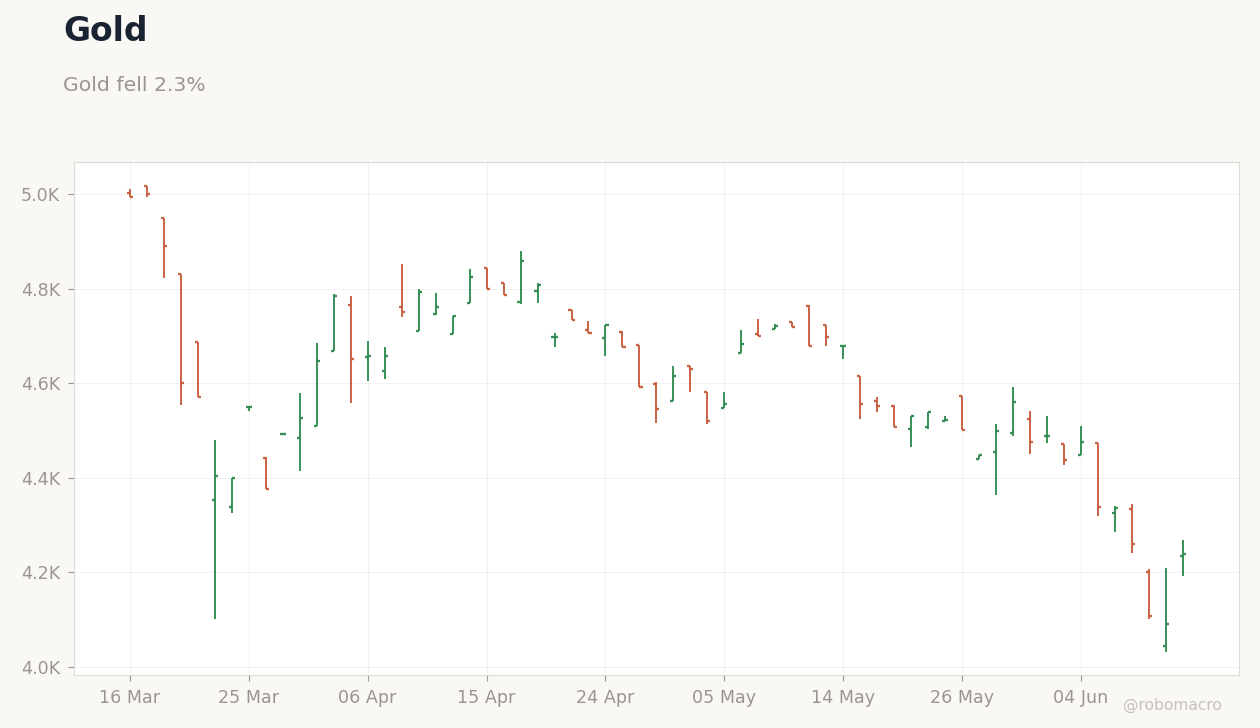
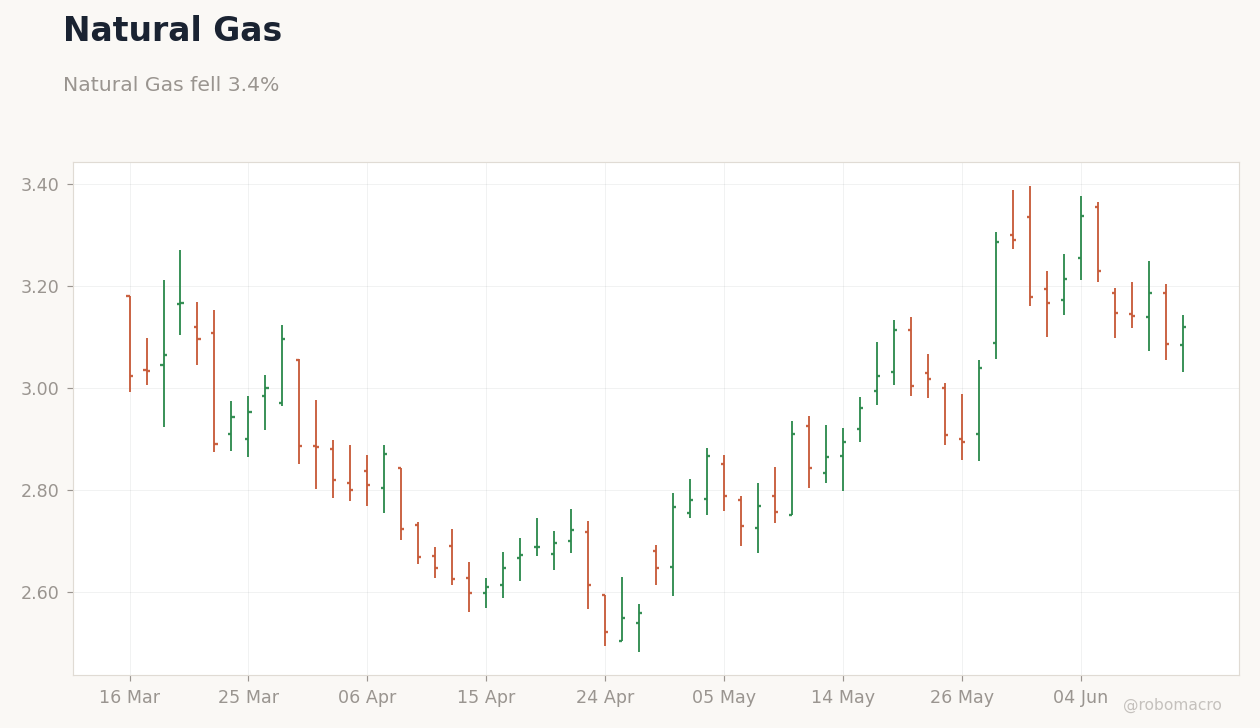
WTI Crude was the biggest mover, declining -6.2% week-over-week to 84.88. Prices climbed from 88.2 on Tuesday to 90.0 on Wednesday before reversing sharply lower to 87.7 on Thursday and closing at 84.9 on Friday. Brent Crude mirrored the move, also falling -6.2% to 87.33. Gold dropped -2.3% to 4238.80, falling from 4,260 on Tuesday to 4,090 on Thursday before rebounding to 4,239 on Friday. Silver eased -1.4% to 67.97, trading from 65.1 on Tuesday to 68.0 on Friday. Copper rose +2.9% to 6.45, closing at 6.4450 on Friday, while Wheat gained +0.8% to 584.50 and Natural Gas fell -3.4% to 3.12.
Energy Complex
WTI Crude settled at 84.88, down -6.2% on the week, while Brent Crude reached 87.33, also down -6.2%. Natural Gas closed at 3.12 after a -3.4% weekly decline, with daily closes showing modest volatility between 3.1400 on Tuesday and 3.1200 on Friday. Geopolitical signals around a potential Iran deal eased some supply disruption concerns that had previously supported risk premiums across the complex. OPEC diplomacy remained a key theme as participants weighed longer-term production signals against the latest price action. Overall the energy complex reflected reduced near-term tightness even as broader macro narratives continued to evolve.
Metals & Ags
Gold ended at 4238.80 after a -2.3% weekly move while Silver fell -1.4% to 67.97. The gold-silver ratio widened as gold underperformed. Copper surged +2.9% to 6.45, acting as a positive growth signal amid improving sentiment on global economic prospects and mining equities. Wheat rose +0.8% to 584.50, showing modest resilience within agriculture even as the broader metals group remained mixed. Iron Ore declined -0.4% to 101.62, rounding out a week where industrial metals diverged from precious metals on shifting inflation and rate expectations.
Week Ahead
The economic calendar for next week contains no commodity-relevant events, with no scheduled EIA crude or gas inventories reports, OPEC meetings, China PMI or industrial data releases, US CPI prints, or central bank meetings that would directly affect commodity currencies such as the Canadian dollar, Australian dollar or Brazilian real. In the absence of major data, non-calendar risks will dominate. Geopolitical developments, weather patterns for agriculture, and OPEC diplomacy remain the primary factors to watch for potential volatility in crude, metals and grains.
| Pair | Level | WoW | MTD | YTD |
|---|---|---|---|---|
| DXY | 99.75 | -0.3% | +0.6% | +1.4% |
| EUR/USD | 1.1573 | -0.3% | -0.7% | -1.5% |
| GBP/USD | 1.3408 | +0.5% | -0.3% | -0.5% |
| USD/JPY | 160.19 | -0.1% | +0.5% | +2.2% |
| AUD/USD | 0.7049 | +0.1% | -1.8% | +5.5% |
| NZD/USD | 0.5835 | +0.7% | -2.5% | +1.3% |
| USD/CAD | 1.3984 | +0.3% | +1.4% | +1.9% |
| USD/CHF | 0.7956 | -0.1% | +1.8% | +0.5% |
| USD/CNY | 6.7621 | -0.1% | -0.1% | -3.3% |
| USD/BRL | 5.0628 | -2.2% | +0.5% | -8.2% |
| USD/MXN | 17.23 | -1.4% | -0.7% | -4.2% |
| USD/INR | 95.10 | +0.2% | +0.1% | +5.7% |
| USD/ZAR | 16.27 | -1.7% | +0.3% | -1.7% |
| USD/TRY | 46.24 | +0.3% | +0.8% | +7.6% |
| Commodity | Level | WoW | MTD | YTD |
|---|---|---|---|---|
| WTI Crude | 84.88 | -6.2% | -7.9% | +48.1% |
| Brent Crude | 87.33 | -6.2% | -8.1% | +43.8% |
| Gold | 4238.80 | -2.3% | -5.3% | -1.8% |
| Silver | 67.97 | -1.4% | -9.4% | -3.7% |
| Copper | 6.45 | +2.9% | -1.2% | +14.3% |
| Natural Gas | 3.12 | -3.4% | -1.9% | -13.8% |
| Wheat | 584.50 | +0.8% | -4.0% | +15.4% |
| Iron Ore | 101.62 | -0.4% | -3.2% | -5.2% |
| Asset | Level | WoW | MTD | YTD |
|---|---|---|---|---|
| Bitcoin | $63,737 | +0.8% | -10.6% | -28.2% |
| Ethereum | $1,662 | -1.5% | -17.0% | -44.6% |
| Solana | $67 | +1.7% | -16.8% | -46.8% |
| XRP | $1 | -2.0% | -12.6% | -39.7% |
The DXY index fell 0.3% to 99.75 as EUR/USD slipped 0.3% to 1.1573. GBP/USD rose 0.5% to 1.3408 while NZD/USD gained 0.7% to 0.5835. USD/JPY was little changed at 160.19. In EM, USD/BRL dropped 2.2% to 5.0626 and USD/ZAR declined 1.7% to 16.27, outpacing USD/MXN’s 1.4% fall to 17.23. USD/CAD added 0.3% to 1.3985 while USD/INR edged 0.2% higher to 95.10. USD/TRY rose 0.3% to 46.24. G10 commodity currencies outperformed European crosses amid divergent flows. Next week’s focus turns to inflation releases and central-bank signals.
| Asset | Level | WoW |
|---|---|---|
| S&P 500 | 7431.46 | +0.3% |
| Nasdaq 100 | 29635.95 | +0.8% |
| Dow Jones | 51202.26 | +0.8% |
| Russell 2000 | 2943.99 | +3.1% |
| USD/JPY | 160.18 | -0.1% |
| EUR/USD | 1.16 | +0.4% |
| GBP/USD | 1.34 | +0.5% |
| Gold | 4238.8 | -2.2% |
| WTI Crude | 84.88 | -7.0% |
| Bitcoin | 63769.51 | +0.8% |


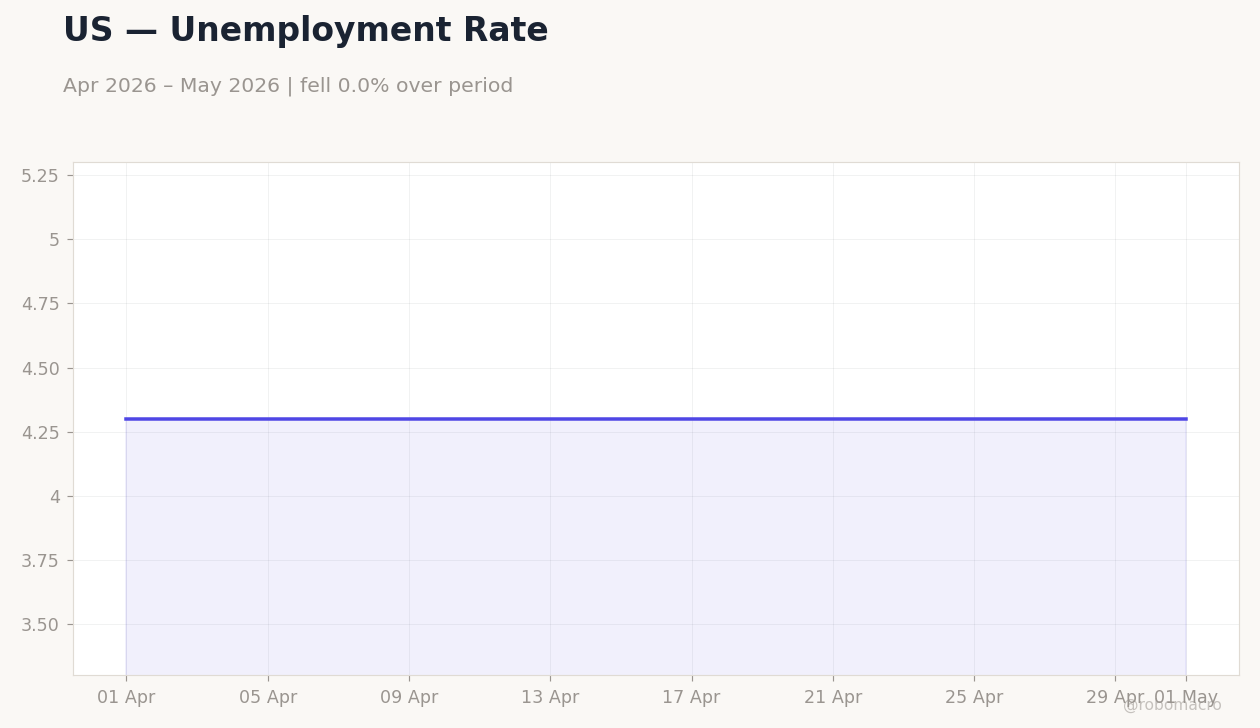
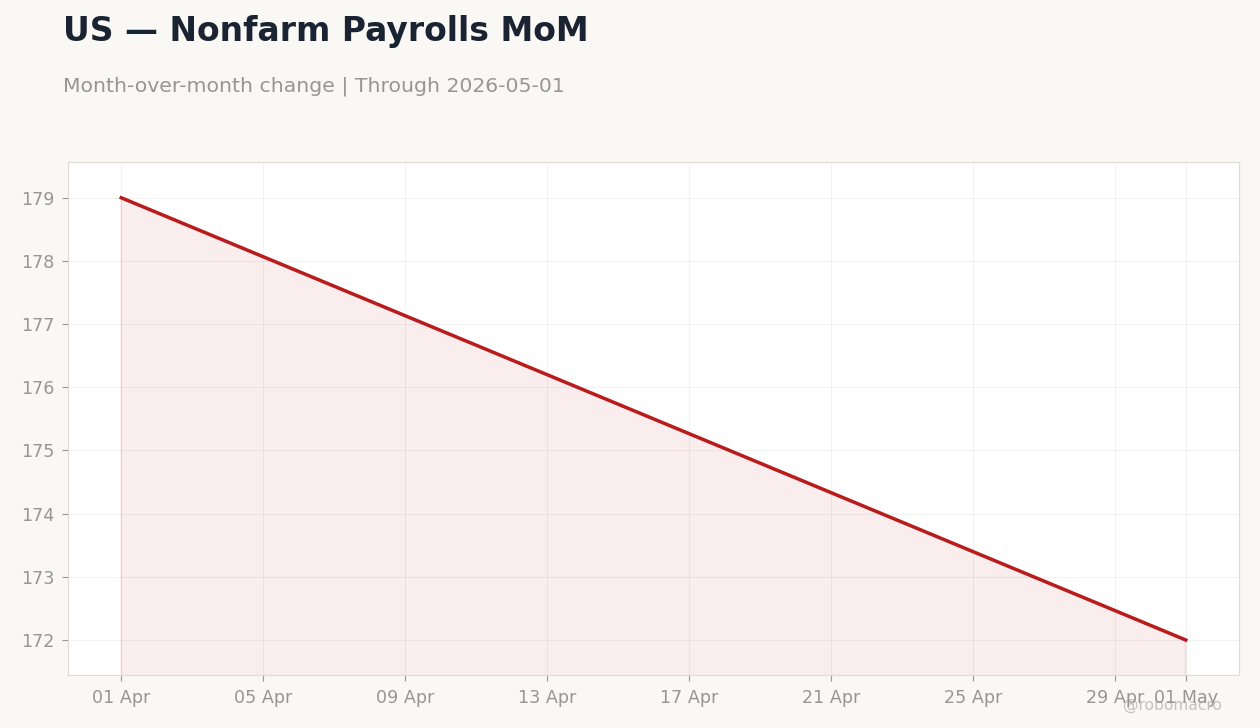
Labor market shows resilience. ADP employment change printed modestly lower than the prior reading and consistent with the unemployment rate that has held since May. This outcome kept terminal rate expectations anchored higher after three consecutive weeks of data outperformance. Housing data surprised to the upside. Existing home sales posted a month-over-month gain versus consensus, while the trade balance narrowed on exports rising. These prints confirmed domestic demand remained intact even as mortgage rates moved higher. Inflation reacceleration dominated sentiment. Headline CPI rose in May, the highest level in three years, while core CPI held steady with the month-over-month core beating expectations lower. Markets responded by lifting Fed hike bets. The narrative arc therefore centers on resilient activity data that has re-anchored policy expectations without triggering a growth scare. Equity breadth narrowed as the Nasdaq 100 fell that same session while WTI Crude moved higher on geopolitical supply concerns. Cross-asset pricing reflected the repricing, with USD/JPY holding near current levels and gold little changed. The week closed with the S&P 500 up 0.35% week-over-week, as positioning adjusted to the delayed rate-cut path.
No FOMC speakers appeared during the week, leaving incoming data and positioning to drive expectations. The May CPI outcome shifted Fed OIS curves to price the first cut no earlier than mid-2027. Market participants interpreted the month-over-month core print as insufficient to alter the higher-for-longer stance given resilient labor demand. The MBA 30-year mortgage rate release reinforced the view that borrowing costs would remain elevated. Annual bank stress-test results scheduled for later this month were flagged as unlikely to change capital requirements. Overall the data have lengthened the expected hold period at the current fed funds rate.
Existing home sales rose month-over-month against consensus, marking the clearest housing stabilization signal since April. The trade deficit narrowed versus forecast as exports climbed and imports rose. ADP employment change printed slightly softer than the prior reading but still consistent with gradual labor-market cooling rather than outright contraction. May CPI delivered headline inflation in line with consensus while core inflation held steady; the month-over-month core print beat expectations lower and pointed to contained underlying pressures. These outcomes place the economy firmly in mid-expansion with demand absorbing higher energy costs without immediate contraction signals. The headline reading, the highest in three years and driven by gasoline components, has pushed Fed OIS-implied terminal rates higher and delayed the first cut beyond the previously expected window. Housing resilience suggests mortgage-rate sensitivity has not yet produced a sharp downturn in turnover. Trade data reinforces external demand support for growth. Overall the releases tilt the inflation-growth balance toward persistent above-target inflation that the Federal Reserve can tolerate given solid activity.
Calendar data unavailable


The upcoming week features manufacturing, industrial production, housing, retail sales, and consumer sentiment data. These releases will test whether the CPI print marks a durable reacceleration or a one-off energy-driven spike.
The CPI reading has reduced the probability of near-term easing and increased the risk of further dollar strength that tightens global financial conditions. Upside inflation surprises could push yields higher while downside housing data would signal faster cooling. Positioning in equities remains light after recent declines, leaving room for volatility if industrial production misses expectations. Flow data show continued rotation out of tech into small-caps, with the Russell 2000 advancing this week. An oil-price rebound would add to headline inflation risks and further delay Fed OIS repricing.
The S&P 500 closed the week at 7431.46, up 0.35%. The Nasdaq 100 ended at 29635.95, up 0.75% week-over-week. The Dow Jones reached 51202.26, gaining 0.82%, while the Russell 2000 advanced 3.1% to 2943.99 on rotation into value. USD/JPY held at 160.18, little changed on the week. EUR/USD rose 0.44% to 1.16 and GBP/USD gained 0.54% to 1.34 as the dollar found support near 100.00 on rate-hike repricing. Gold fell 2.24% to 4238.80. WTI Crude declined 7.03% to 84.88, while Bitcoin rose 0.84% to 63769.51.
Middle East tensions supported safe-haven flows into the dollar and gold early in the week before WTI Crude’s decline eased imported inflation pressure for net importers. The euro area saw German Bund yields move higher in tandem with US 10-year yields, trimming ECB easing odds. Japan’s Ministry of Finance intervention kept USD/JPY near current levels while real wages extended gains. Emerging-market currencies faced dollar-driven pressure, with the Mexican peso and Brazilian real both weaker on external financing lines.
| Asset | Level | WoW |
|---|---|---|
| Euro Stoxx 50 | 6187.63 | +2.1% |
| DAX | 24635.3 | +0.1% |
| CAC 40 | 8350.87 | +1.9% |
| EUR/USD | 1.16 | +0.4% |
| EUR/GBP | 0.86 | -0.1% |
| EUR/JPY | 185.37 | +0.3% |
| Gold | 4238.8 | -2.2% |
| Brent Crude | 87.33 | -7.3% |
| Bitcoin | 63769.51 | +0.8% |


Equity markets posted gains. The Euro Stoxx 50 rose 2.07% to 6187.63 while the CAC 40 gained 1.85% to 8350.87. The DAX advanced 0.08% to 24635.30. EUR/USD rose 0.44% to 1.16 and EUR/JPY gained 0.34% to 185.37. Brent crude fell 7.34% to 87.33, while gold declined 2.24% to 4238.80 and Bitcoin rose 0.84% to 63769.51.
Markets adjusted pricing toward a later first cut. German 10-year yields moved higher, embedding a higher terminal rate path than at the start of the week. The week’s data flow reinforced a wait-and-see stance.
Market pricing reflected higher terminal-rate expectations in fixed income alongside equity resilience. Commodity price declines eased imported cost pressures for net-energy importers.
Calendar data unavailable
The calendar is light. Markets will monitor any releases for shifts in growth or inflation expectations that could alter OIS pricing.
Volatility remained contained. Flow data suggest rotation out of cyclicals into peripheral equities. Energy price movements remain the dominant external variable.
Equities posted net gains. The Euro Stoxx 50 rose 2.07% to 6187.63 while the DAX advanced 0.08% to 24635.30. The CAC 40 gained 1.85% to 8350.87. EUR/USD rose 0.44% to 1.16 and EUR/JPY advanced 0.34% to 185.37. Brent crude fell 7.34% to 87.33 while gold declined 2.24% to 4238.80. Bitcoin closed at 63769.51, up 0.84%.
Brent crude’s 7.34% weekly decline eased imported inflation pressure for net-energy importers, supporting the euro’s modest 0.44% gain against the dollar. Trade dynamics showed no material shift.
| Asset | Level | WoW |
|---|---|---|
| Nikkei 225 | 66020.04 | +3.1% |
| USD/JPY | 160.18 | -0.1% |
| EUR/JPY | 185.37 | +0.3% |
| GBP/JPY | 214.84 | +0.5% |
| Gold | 4238.8 | -2.2% |
| Brent Crude | 87.33 | -7.3% |
| Bitcoin | 63769.51 | +0.8% |


Market Moves The Nikkei 225 posted a 3.12% weekly gain to close at 66020.04. USD/JPY ended at 160.18 after a 0.09% weekly decline. Brent crude fell 7.34% to 87.33.
The Nikkei 225 closed at 66020.04 and USD/JPY at 160.18 after the latest data round. Front-end OIS curves reflected ongoing repricing of policy normalization.
Calendar data unavailable
Markets will focus on the BoJ Interest Rate Decision and subsequent data releases on trade, orders, and inflation. These prints will inform the rate path and yen intervention risks.
Persistent yen weakness near 160.18 keeps imported inflation risks elevated. Equity gains could reverse on weaker external demand data. Markets continue to monitor verbal and actual intervention signals.
| Asset | Level | WoW |
|---|---|---|
| S&P/TSX | 34937.9 | +1.3% |
| USD/CAD | 1.4 | +0.3% |
| EUR/CAD | 1.62 | +0.7% |
| WTI Crude | 84.88 | -7.0% |
| Natural Gas | 3.12 | -0.9% |
| Gold | 4238.8 | -2.2% |
| Brent Crude | 87.33 | -7.3% |
| Bitcoin | 63769.51 | +0.8% |


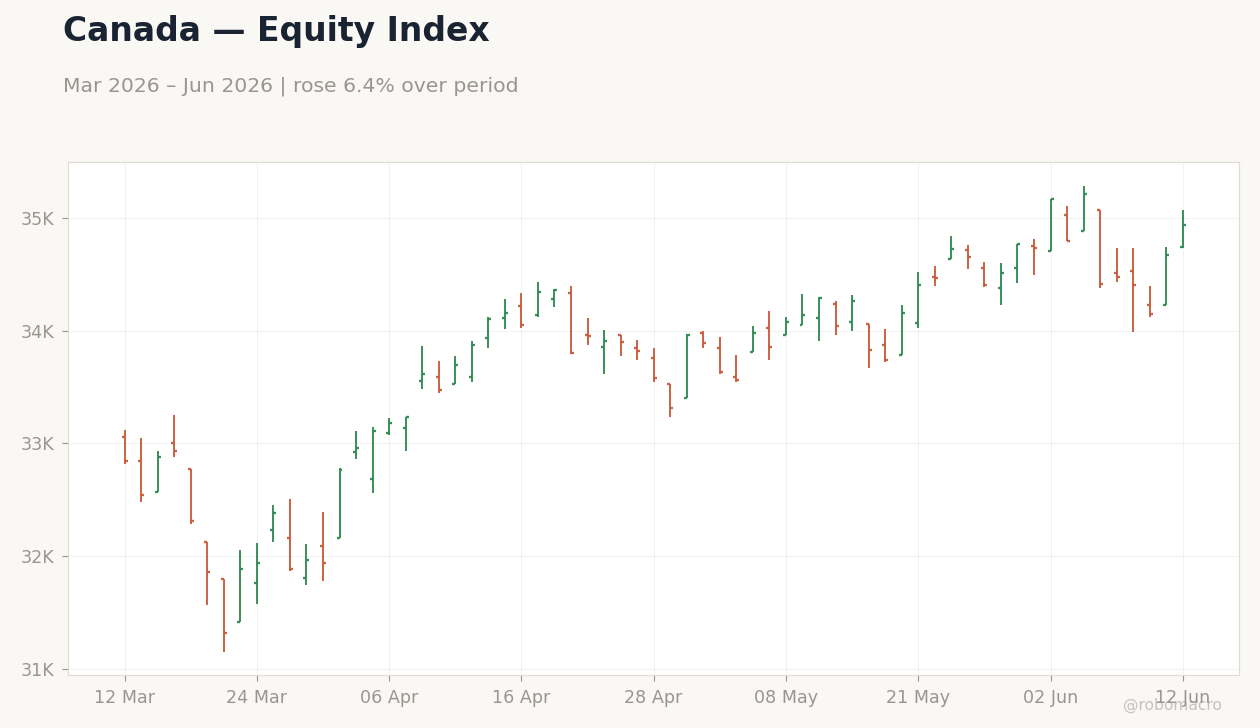
Labor Market Resilience The May jobs print delivered the clearest positive surprise of the week, adding positions and lowering the unemployment rate. This outcome reversed the prior softening trend visible in April data and lifted the S&P/TSX 1.33 percent week-over-week to 34,937.90. Equity breadth improved in energy and materials even as broader risk sentiment remained cautious.
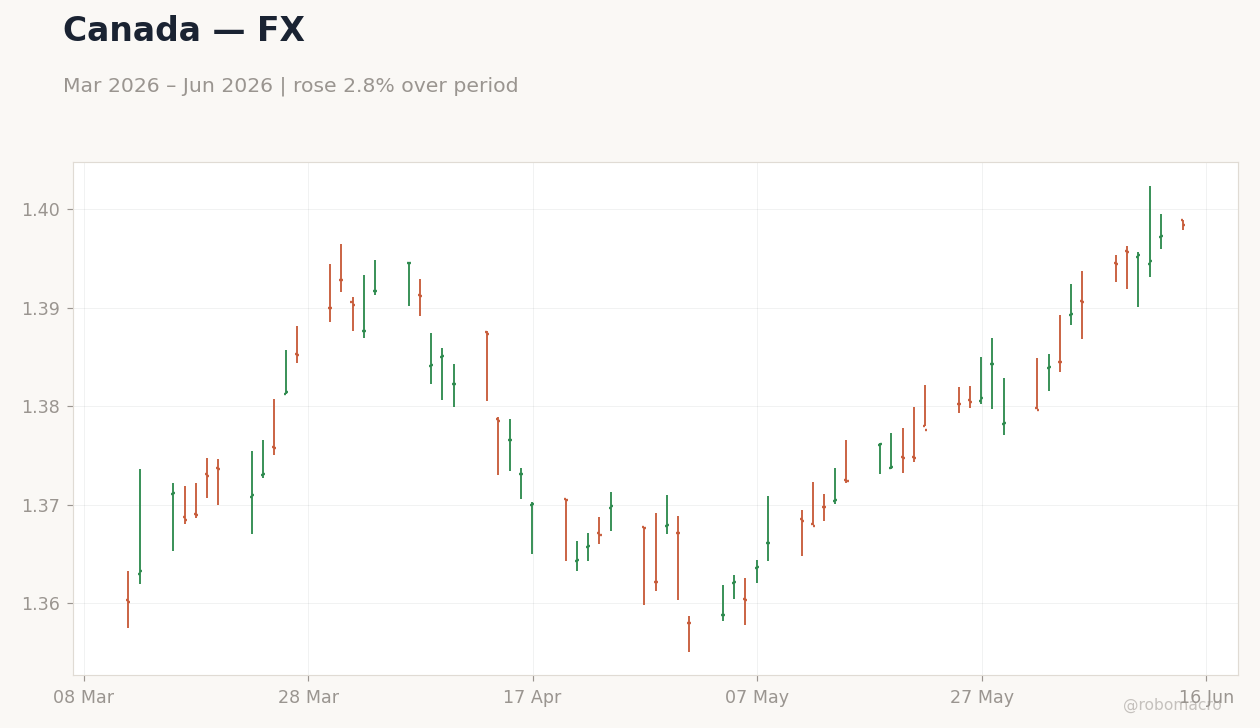
External Accounts and Commodity Linkages April trade data printed a wider surplus than expected, driven by record crude exports. The beat occurred alongside a 7.03 percent decline in WTI to 84.88, illustrating that volume gains offset price weakness for the external balance. USD/CAD finished at 1.40, up only 0.28 percent on the week, showing limited pass-through from softer energy prices into the currency.
Policy and Yield Dynamics The Bank of Canada decision reinforced a data-dependent hold, with the 2-year yield closing in line with the policy rate and the 10-year yield higher. Markets absorbed the statement without material BoC OIS repricing, consistent with the prior week’s steady front-end curve. Growth concerns flagged by the Bank contrasted with the labor and trade prints, leaving the domestic narrative bifurcated between resilient external demand and softening internal momentum.
Cross-Asset Consolidation Gold declined 2.24 percent to 4,238.80 while Bitcoin gained 0.84 percent, reflecting selective safe-haven flows amid the mixed Canadian data. Overall, the week’s arc showed data outperformance on labor and trade tempering recession fears without yet shifting the Bank’s cautious stance.
The Bank of Canada maintained the policy rate and highlighted weaker-than-expected growth in its statement, stopping short of recession language. Forward guidance emphasized the balance between persistent inflation and downside risks to domestic demand. BoC OIS curves showed only marginal shifts, pricing a prolonged hold through the next meeting with limited odds of near-term easing. The record trade surplus and May jobs beat reinforced the Bank’s ability to remain patient, while softer Q1 GDP prints continued to anchor caution. No additional speakers altered the tone during the week.
Calendar data unavailable
Housing Starts will provide the first read on June construction momentum after the prior print. A weak outcome could reinforce growth concerns ahead of the next Bank of Canada decision. New Housing Price Index month-over-month will test whether cooling prices are broadening beyond prior months. Retail Sales ex-Autos and headline Retail Sales will clarify whether consumer spending is stabilizing after soft Q1 readings. Collectively these releases will shape BoC OIS expectations for the balance between inflation risks and growth support in coming quarters. Markets will watch for any signal that softer activity data accelerates the timeline for policy relief.
The sharp 7.03 percent drop in WTI to 84.88 raises downside risks to provincial revenues and CAD support even as the trade surplus remains robust. Persistent technical recession signals from earlier GDP data could pressure the Bank toward earlier easing if upcoming housing and retail prints disappoint. Markets appear to underprice the probability of prolonged stability at the current policy rate given the inflation-growth trade-off. An upside scenario would require sustained jobs momentum to keep BoC OIS curves anchored, while a sharper oil decline could reopen questions about external demand resilience in coming quarters.
| Asset | Level | WoW |
|---|---|---|
| IPC Bolsa | 67954.55 | +3.4% |
| USD/MXN | 17.23 | -1.4% |
| EUR/MXN | 19.92 | -1.0% |
| WTI Crude | 1428.5 | -1.5% |
| Silver | 1652.52 | -1.1% |
| Gold | 4238.8 | -2.2% |
| Brent Crude | 171133.0 | +1.5% |
| Bitcoin | 5.06 | -2.2% |


Inflation surprise drives the narrative. Mexico’s May inflation data delivered a clear downside surprise, with the year-over-year rate falling below consensus and the month-over-month print also undershooting expectations. The outcome placed headline inflation back inside Banco de Mexico’s target range and immediately shifted market focus toward the timing of future policy adjustments.
Peso and equity markets respond in tandem. USD/MXN declined on the release day and extended gains through the week to close at 17.23, a 1.35% weekly drop. The IPC Bolsa initially declined but recovered sharply, posting a 3.43% weekly gain to 67954.55 by June 14. These moves occurred alongside a decline in WTI Crude, which removed some energy-linked support from the peso yet failed to offset the positive inflation impulse.
Growth and external backdrop remain mixed. Prior context showed softer growth signals amid USMCA uncertainty, yet nearshoring and record remittances continued to support the current account. The absence of fresh activity data this week left markets to interpret the inflation print against that softer growth backdrop, producing a net constructive tone for domestic assets. Short-term rates stayed steady while long-term yields rose, steepening the curve modestly.
Data dependence shapes the close. With no additional releases through June 14, the week’s arc centered on the single inflation surprise and its validation of contained price pressures. The combination of lower inflation, a firmer peso, and equity gains suggests markets are now positioning for a gradual rather than aggressive shift in the policy outlook.
Banco de Mexico left the policy rate unchanged with no speakers or minutes released during the week. The May inflation undershoot reinforced the view that price pressures are moderating faster than previously expected, supporting a measured easing trajectory into the next decision. OIS curves priced only limited near-term cuts, reflecting the central bank’s continued data dependence amid resilient remittances and nearshoring flows. The peso’s 1.35% weekly gain against the dollar further eased imported inflation risks, giving policymakers additional room to assess growth signals before adjusting forward guidance. Markets now await the June minutes for any updated reaction function on the balance between the inflation print and external trade uncertainties.
Calendar data unavailable
No major data releases are scheduled for the coming week, leaving markets to monitor secondary indicators such as industrial production and retail sales due later in the month. Attention will center on any follow-up commentary from Banco de Mexico board members regarding the inflation trajectory and the timing of upcoming decisions. Banxico’s June minutes, expected next week, will provide the clearest read on how the recent inflation print alters the rate path. External drivers including US yields, oil prices, and USMCA-related headlines are likely to dominate peso trading in the absence of domestic catalysts. The data dependence emphasized in prior communications suggests policymakers will weigh the recent disinflation against growth revisions before signaling shifts in coming quarters. Traders will also track pension fund flows and nearshoring announcements for any incremental support to the current account.
The inflation undershoot reduces near-term upside risks to prices but highlights downside growth risks from USMCA delays and protectionism noted in prior weeks. A stronger peso could further dampen imported inflation yet pressure export margins if sustained. Markets appear to be underpricing the potential for prolonged USMCA haggling, which could extend tariff uncertainty beyond the next policy meeting. Upside scenarios include faster nearshoring inflows supporting activity, while downside cases center on renewed dollar strength if US data continue to outperform. The current OIS pricing suggests limited scope for aggressive repricing unless upcoming activity prints surprise materially to the downside.
| Asset | Level | WoW |
|---|---|---|
| Bovespa | 4238.8 | -2.2% |
| USD/BRL | 63784.55 | +0.9% |
| EUR/BRL | 63784.55 | +0.9% |
| Vale | 15.71 | +4.8% |
| Petrobras | 18.38 | +3.5% |
| WTI Crude | 84.88 | -7.0% |
| Gold | 4238.8 | -2.2% |
| Bitcoin | 63784.55 | +0.9% |


Activity resilience and forecast revisions Bovespa opened the week lower after the long weekend as profit-taking in Vale and Petrobras coincided with analysts raising Selic projections for 2026-2027 following stronger-than-expected prior retail sales and industrial production prints. USD/BRL moved higher on the combination of higher-for-longer rate expectations and political noise around congressional proceedings. No releases occurred mid-week, leaving the focus on the upcoming IPCA data.
Fiscal signals and rate anchoring Warnings that high-cost congressional proposals could pressure fiscal accounts reinforced arguments for keeping the Selic elevated, pushing fixed-rate bonds higher and supporting short-term rates. Bovespa held steady while USD/BRL eased modestly on commodity price moves and steady Treasury auction demand. Iron-ore export volumes to China rose year-over-year, yet steel margin weakness capped gains for Vale shares.
Pre-data positioning and carry flows Bovespa climbed as Petrobras advanced amid stable WTI Crude, while USD/BRL declined on softer external yields and local carry inflows. Economists revised inflation forecasts higher and argued the easing cycle should pause after the next cut. Markets positioned for the IPCA print to determine whether the Selic would need further upward revision or could remain anchored.
The Banco Central do Brasil maintained the Selic with no speakers or minutes released during the week, leaving BCB OIS curves largely unchanged and pricing steady policy at the next COPOM decision. Hot prior activity data prompted economists to lift rate forecasts, reinforcing the view that resilient domestic demand keeps inflation risks tilted to the upside. Fiscal warnings added term-premium pressure without immediate repricing in the swap curve, as markets continued to embed a prolonged hold. The absence of fresh guidance left the rate path dependent on the inflation outcome and subsequent retail sales momentum. OIS pricing showed only modest shifts, reflecting the central bank’s data-dependent stance amid above-target inflation pressures.
Calendar data unavailable
Business Confidence Index prints offer the first read on sentiment after recent activity strength. Retail Sales follow, testing whether domestic demand remains firm enough to sustain inflation pressures. The Banco Central do Brasil Interest Rate Decision will reveal whether the central bank adjusts the Selic path in response to incoming data. These releases matter directly for the rate trajectory because stronger prints would reinforce the case for holding rates higher for longer while softer outcomes could reopen easing discussions. Markets will also monitor any fiscal updates from Congress that could alter the primary-deficit target and affect BCB OIS pricing. The combination of confidence, sales, and policy signals will shape expectations for coming quarters.
Fiscal slippage risks from congressional spending agendas remain the dominant domestic theme, highlighting how such pressures could keep the Selic elevated even if inflation moderates. Upside growth surprises in prior retail sales and industrial production have already prompted rate-forecast upgrades, suggesting the economy is running above potential and limiting room for near-term easing. Downside scenarios center on weaker-than-expected inflation or retail sales prints that could ease BCB OIS pricing, yet markets appear to underprice the persistence of fiscal rigidities. Commodity price volatility, including WTI Crude declines, adds external uncertainty that could affect export revenues and the real without altering the core inflation-targeting challenge. The data flow continues to support a higher-for-longer rate path relative to earlier expectations.
| Asset | Level | WoW |
|---|---|---|
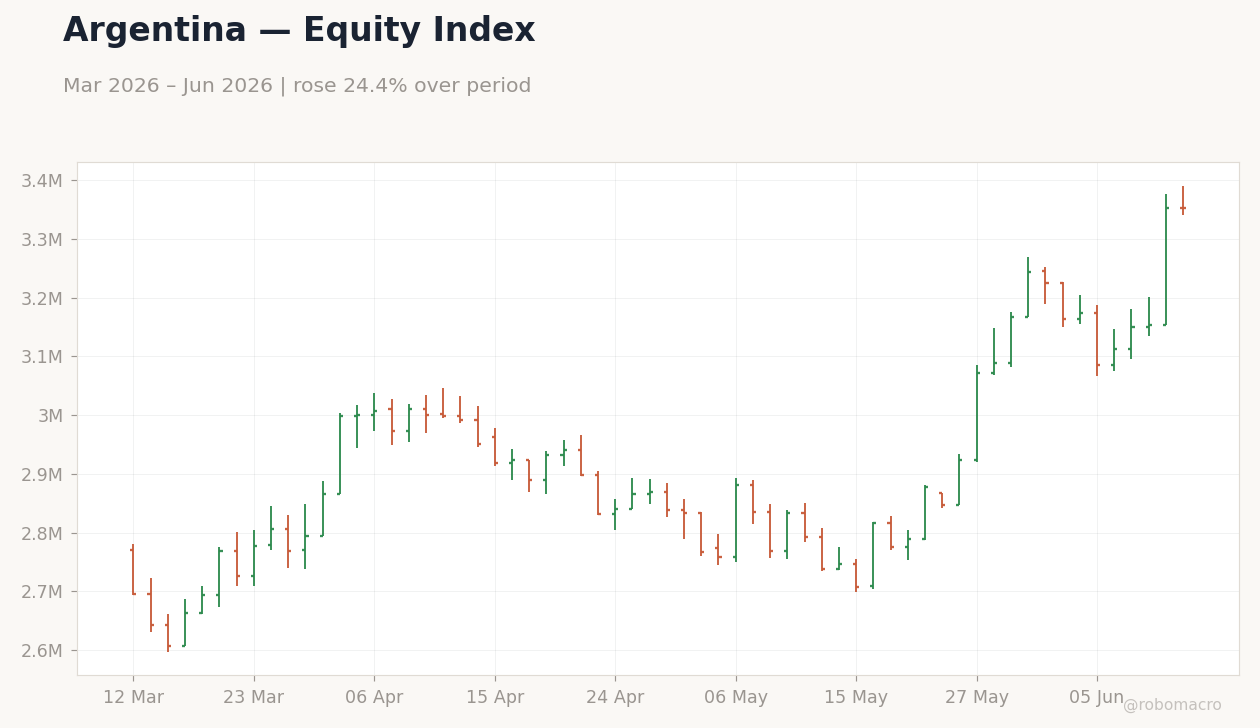
| MERVAL | 84.88 | -7.0% |
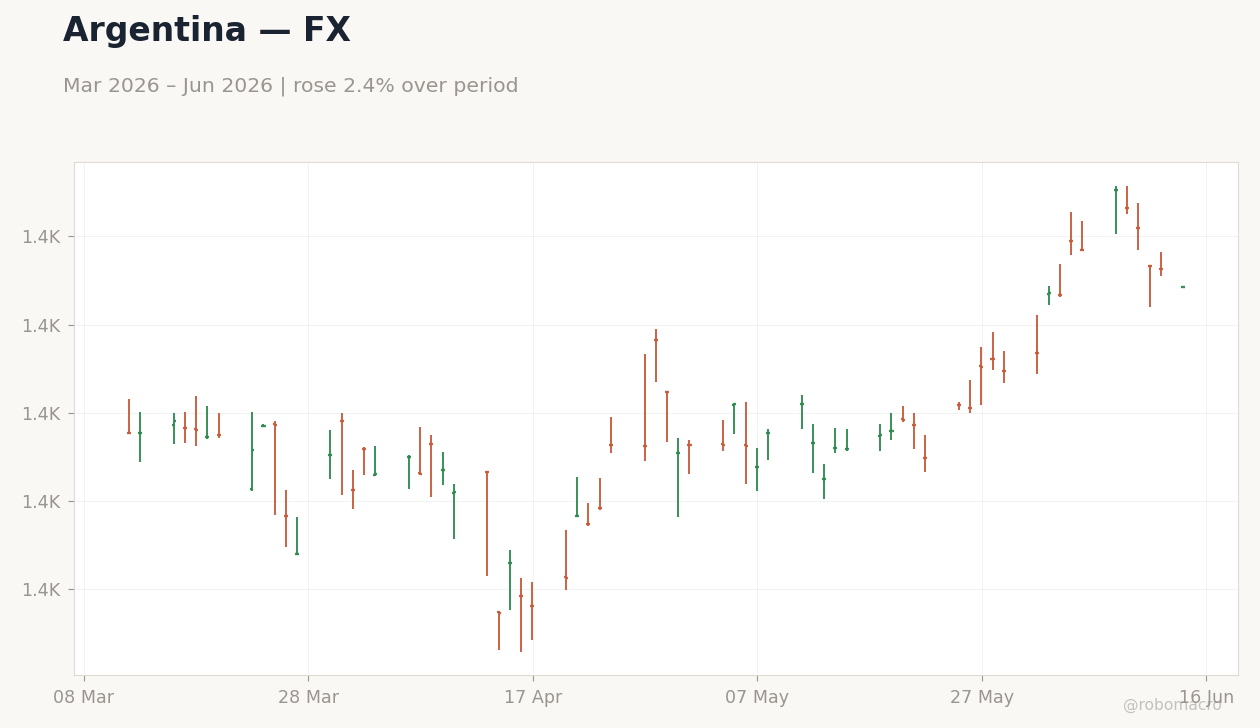
| USD/ARS | 1428.5 | -1.5% |
| EUR/ARS | 87.33 | -7.3% |
| Gold | 171133.0 | +1.5% |
| Brent Crude | 5.06 | -2.2% |
| Soybean | 1132.0 | +1.5% |
| Bitcoin | 63784.55 | +0.9% |


Equity and FX stability amid data vacuum Argentine markets navigated a quiet calendar with zero scheduled releases, allowing price action to reflect positioning and external flows rather than fresh domestic prints. The MERVAL index closed the period at 84.88, down 7.03 percent week-over-week. USD/ARS eased to 1428.5, narrowing the gap with parallel rates and reducing immediate depreciation pressure after BCRA intervention capped volatility.
Commodity and fiscal anchors Soybean futures advanced 1.46 percent to 1132.0, reinforcing export-tax revenue expectations. Brent crude declined 2.21 percent to 5.06, trimming fiscal windfall prospects. Officials emphasized a structural shift away from chronic deficits.
Reserve and external balance trends Reserve accumulation via soybean proceeds continued to offset limited access to international debt markets, supporting credibility under the current program. Overall, the week confirmed market resilience in the absence of surprises, with peso forward points showing limited shifts in devaluation expectations.
The Central Bank of Argentina conducted routine operations without new announcements or changes to the crawl pace. Weekly monetary aggregates and reserve updates remained the primary focus, with net international reserves exceeding program floors and providing room for measured policy adjustments. OIS pricing showed no material repricing for near-term moves, consistent with data dependence ahead of upcoming decisions. Forward guidance from officials continued to tie any easing to sustained reserve gains and fiscal consolidation progress. The absence of inflation or activity prints left the rate path anchored to external balance trends rather than domestic surprises.
Calendar data unavailable
Attention will center on BCRA weekly monetary aggregates and any updates to reserve targets ahead of the next IMF review. Soybean export proceeds and global commodity price swings are expected to drive reserve accumulation and trade balance outcomes. Markets will monitor peso liquidity and domestic bond demand for clues on fiscal financing conditions. Global central-bank decisions elsewhere may influence EM risk appetite and ARS crosses, with limited local volatility anticipated absent fresh guidance. The data calendar remains light, keeping focus on external drivers and any unscheduled FX interventions. Consensus expectations point to continued reserve rebuilding that could open room for gradual policy easing in coming quarters.
Persistent high USD/ARS levels underscore ongoing external imbalances despite recent stability, leaving the outlook sensitive to commodity reversals. Upside scenarios hinge on stronger soybean volumes accelerating reserve gains and supporting earlier easing. Downside risks include renewed global dollar strength that could pressure parallel rates and widen country risk spreads. Markets appear to price limited near-term devaluation, yet any slippage in fiscal consolidation could challenge that view and prompt faster BCRA intervention.
| Asset | Level | WoW |
|---|---|---|
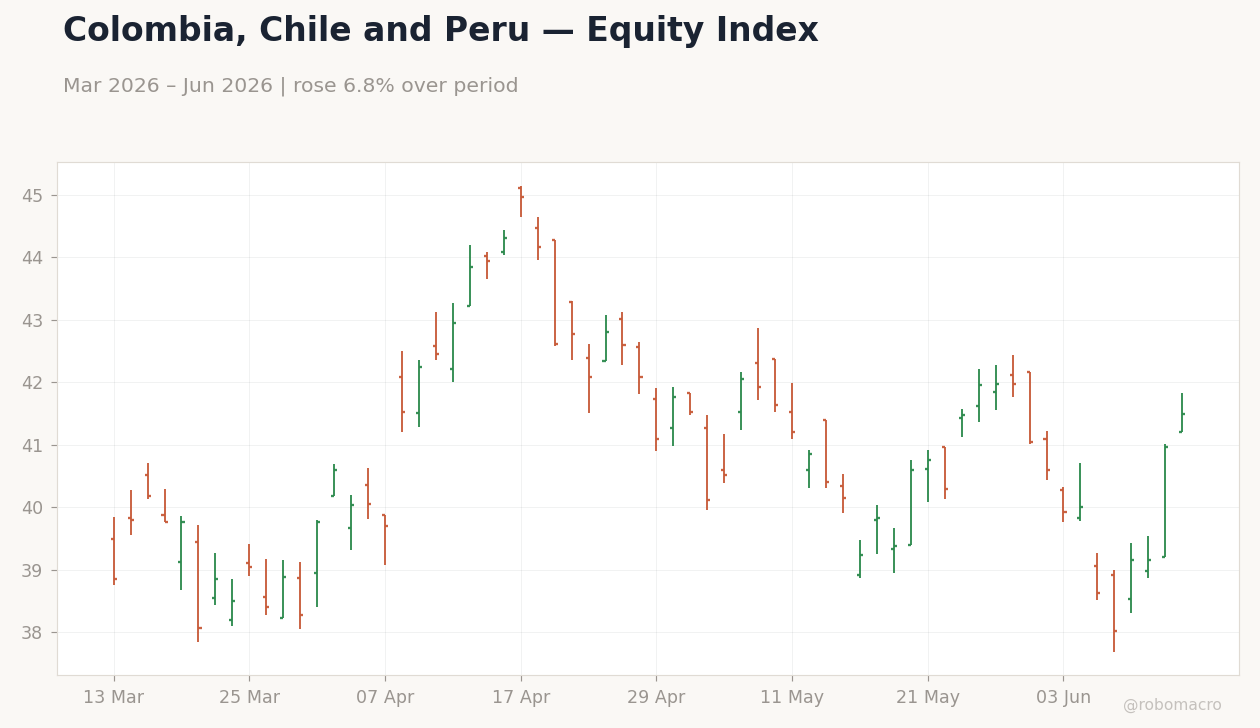
| MSCI Chile | 41.5 | +9.2% |
| MSCI Peru | 87.56 | +12.0% |
| USD/COP | 3490.08 | -3.2% |
| USD/CLP | 898.7 | -1.7% |
| USD/PEN | 3.4 | -2.0% |
| Copper | 6.45 | +1.8% |
| Gold | 4238.8 | -2.2% |
| Brent Crude | 87.33 | -7.3% |
| Bitcoin | 63775.99 | +0.8% |


Equity and FX Rebound After Early Pressure Andean equities posted a sharp reversal from the prior week’s weakness, with MSCI Peru and MSCI Chile both advancing. The move coincided with declines in USD/PEN and USD/CLP, narrowing external financing costs. MSCI Colombia remained unchanged, reflecting steadier oil-linked flows despite Brent’s decline.
Commodity Divergence Shapes Fiscal Outlooks Copper’s gain supported royalty projections for Chile and Peru, while Brent’s drop limited upside for Colombian fiscal revenues. Gold’s weekly decline offered limited offset for Peruvian producers.
Policy Rate Stability Amid Data Light Period Chile’s short-term rate stayed unchanged through the week with no BCCh adjustment. No BanRep or BCRP decisions occurred, leaving OIS pricing focused on the next meetings. Regional equity volumes remained thin outside the commodity-driven rallies.
External Drivers Dominate Sentiment The week’s arc showed commodity price volatility transmitting directly into FX and equity moves, with USD/COP declining on reduced oil pressure. No domestic data releases altered the growth or inflation baseline, confirming the data-light environment. Overall, the bloc’s performance aligned with selective EM resilience rather than broad dollar-driven pressure.
BCCh maintained the short-term rate with no forward guidance shift, while BanRep and BCRP also refrained from policy moves. The recent CPI undershoot in Chile reinforced market expectations for additional easing at the next decision, though OIS curves showed only modest repricing. Copper strength improved the fiscal backdrop for BCCh and BCRP without altering near-term rate paths. BanRep speakers offered no new signals, leaving the hawkish stance from prior weeks intact. Overall, the week’s data reinforced a cautious, data-dependent stance across the three central banks ahead of upcoming decisions.
Calendar data unavailable
Attention will turn to any follow-through in copper and Brent prices, which directly influence royalty and export receipts for Chile and Peru. Global risk sentiment and China demand indicators will likely dictate CLP and PEN direction ahead of the next BanRep, BCCh and BCRP meetings. Incoming inflation prints remain the key domestic variable that could shift OIS pricing for the upcoming decisions. Peru’s external balances will stay in focus given the recent PEN strength. No major sovereign auctions are scheduled, keeping markets sensitive to external commodity shocks. Investors will monitor any central bank speakers for incremental signals on the rate path through coming quarters. The absence of domestic releases next week heightens reliance on global data dependence already priced into regional curves.
Copper’s rebound reduces downside risk to Chile and Peru fiscal balances but leaves Colombia exposed to further Brent weakness. A stronger dollar channel from resilient US data could reverse the week’s FX gains in USD/COP and USD/CLP. Market pricing appears to underweight the possibility of delayed easing if inflation reaccelerates, particularly for BCCh. Upside scenarios center on sustained commodity strength supporting external surpluses, while downside risks include renewed equity outflows if global risk appetite fades. The week’s moves suggest markets are correctly positioned for data dependence but may be underpricing political volatility in Colombia.
| Asset | Level | WoW |
|---|---|---|
| FTSE 100 | 10471.7 | +0.9% |
| FTSE 250 | 23325.7 | +1.4% |
| GBP/USD | 1.34 | +0.5% |
| GBP/EUR | 1.16 | +0.1% |
| GBP/JPY | 214.84 | +0.5% |
| Brent Crude | 87.33 | -7.3% |
| Gold | 4238.8 | -2.2% |
| UK Nat Gas | 3.12 | -0.9% |
| Bitcoin | 63775.99 | +0.8% |


Equities advance on domestic resilience. UK equity indices posted gains through the week. The FTSE 100 closed at 10471.7 for a 0.95% advance while the FTSE 250 rose 1.36% to 23325.7. Market moves aligned with firmer consumption indicators that tempered expectations for near-term policy easing.
Fixed-income markets reprice policy path. Benchmark gilt yields rose as data resilience reduced the perceived likelihood of an early Bank of England cut. Brent crude’s 7.34% decline to 87.33 eased imported price pressures and provided a partial offset in inflation-sensitive assets.
Currency markets reflect differentiated outlook. Sterling firmed against major peers, with GBP/USD advancing 0.54% to 1.34 and GBP/JPY adding 0.48% to 214.84. The moves tracked the domestic data outperformance relative to softer global energy prices.
The Bank of England maintained the policy rate amid references to core inflation persistence and energy-price risks. OIS curves now embed only limited easing through year-end. The retail-sales outturn reinforced the data-dependent stance by showing household spending withstands current borrowing costs. Markets therefore place the first 25 bp cut after the summer, consistent with observed inflation and activity prints.
Market pricing shifted during the week as activity indicators pointed to resilient household spending. This configuration supported a later first Bank of England easing step and contributed to higher gilt yields. Softer Brent crude prices at 87.33 moderated imported inflation risks. Industrial production and GDP releases did not alter the week’s market narrative, leaving equity and fixed-income moves driven by the consumption and housing signals already in view.
Calendar data unavailable
High-impact UK data releases are scheduled. Markets will assess implications for the Bank of England rate path, growth trajectory, and inflation outlook.
Positioning in gilts remains light following the recent yield increase, leaving scope for volatility on incoming inflation and labour-market prints. Upside risks centre on persistent wage growth supporting core price pressures, while downside risks stem from further commodity-price weakness amplifying disinflation. Sterling volatility stayed contained around 1.34.
Equities posted net gains, with the FTSE 100 advancing 0.95% to 10471.7 and the FTSE 250 rising 1.36% to 23325.7. Bonds sold off as yields moved higher, consistent with reduced easing probabilities. Sterling strengthened, lifting GBP/USD 0.54% to 1.34 and GBP/JPY 0.48% to 214.84. Brent crude led commodity moves lower, falling 7.34% to 87.33, while gold declined 2.24% to 4238.8 and UK natural gas eased 0.86% to 3.12. The cross-asset pattern reflected domestic resilience set against a softer global energy backdrop.
Brent crude’s 7.34% decline to 87.33 over the past seven days reduced imported inflation pressure for the United Kingdom. The dollar index remained steady amid ongoing geopolitical tensions, capping further sterling gains. Global equity rotation away from risk assets has not materially affected UK indices. Trade flows with EU partners showed no new tariff developments in the period.
| Asset | Level | WoW |
|---|---|---|
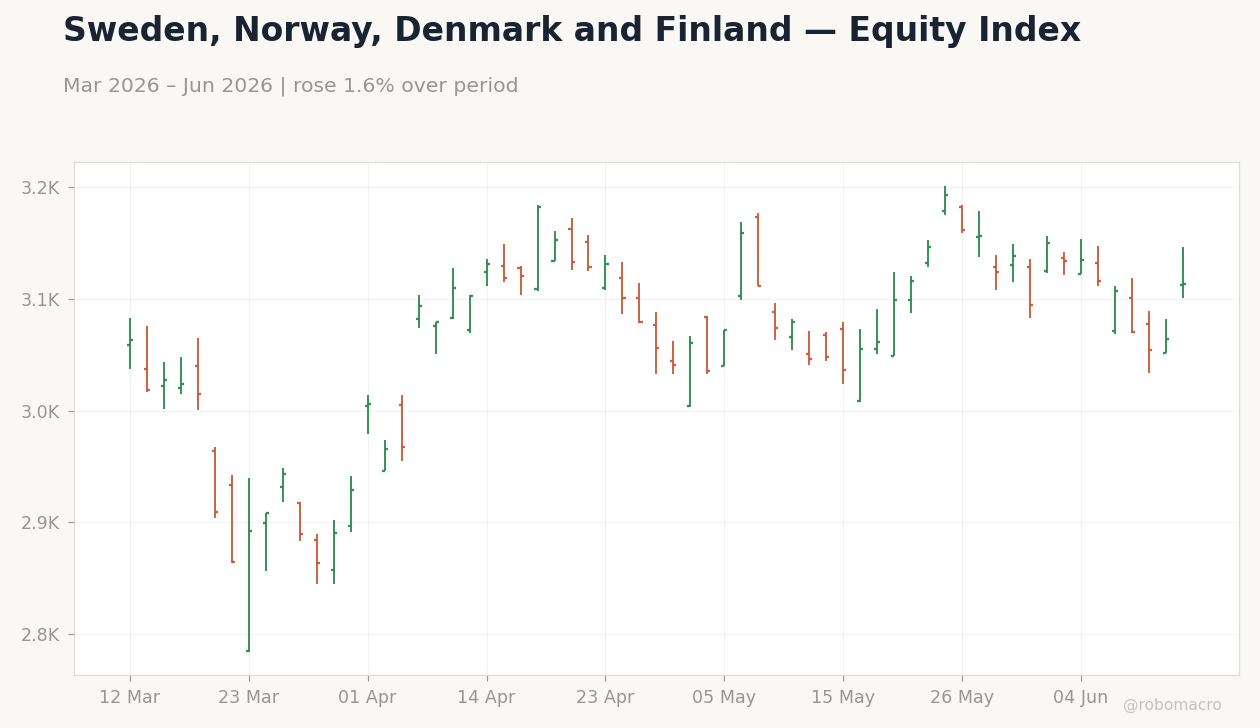
| OMX Stockholm 30 | 3113.57 | +0.2% |
| Oslo Bors | 1995.22 | +0.1% |
| OMX Copenhagen 25 | 1771.41 | +1.7% |
| OMX Helsinki 25 | 6339.05 | -1.8% |
| USD/SEK | 9.44 | -0.3% |
| USD/NOK | 9.48 | +0.3% |
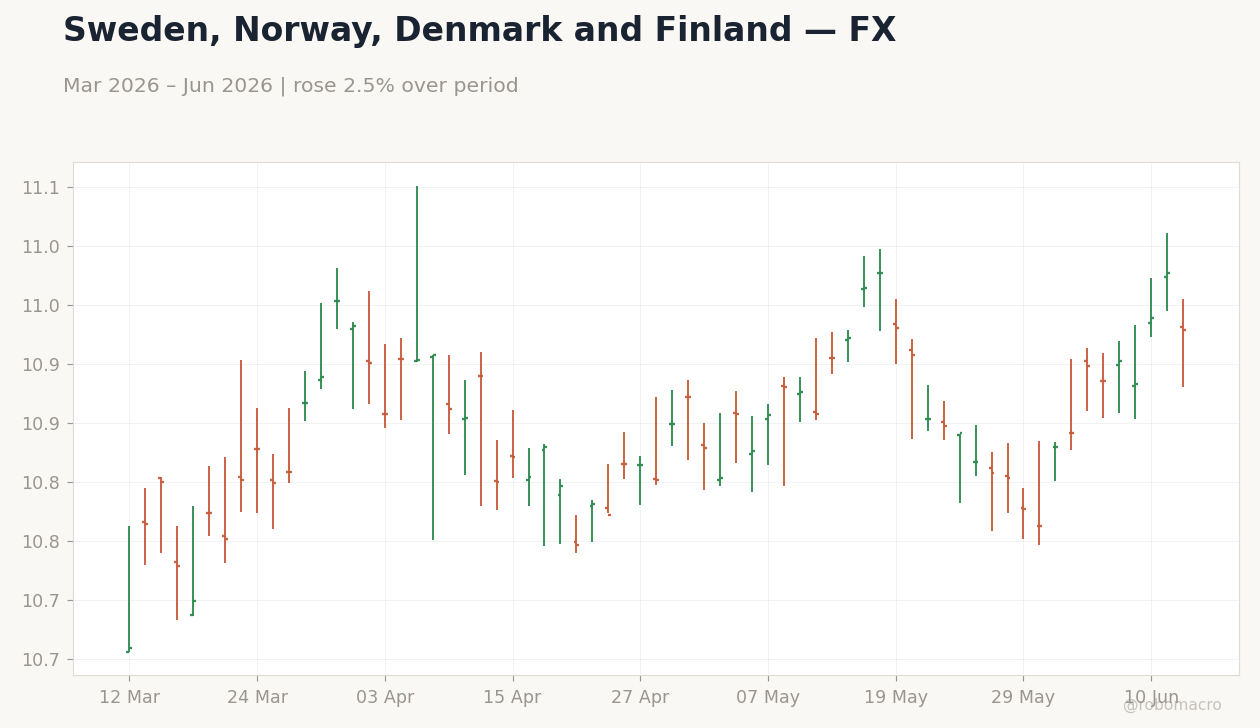
| EUR/SEK | 10.93 | +0.2% |
| EUR/NOK | 11.01 | +1.0% |
| Brent Crude | 87.33 | -7.3% |
| Gold | 4238.8 | -2.2% |
| Bitcoin | 63769.51 | +0.8% |


Equity and FX Performance Nordic equity indices closed the week mixed, with OMX Stockholm 30 rising 0.22% to 3113.57 while OMX Helsinki 25 fell 1.81% to 6339.05. OMX Copenhagen 25 advanced 1.73% to 1771.41 and Oslo Bors gained 0.10% to 1995.22. USD/SEK eased 0.27% to 9.44 and USD/NOK rose 0.32% to 9.48. EUR/NOK climbed 1.04% to 11.01 amid the oil-price decline.
Growth Data Surprises Recent Swedish activity data confirmed resilience in manufacturing that lifted equities mid-week. The data challenged earlier expectations of softer activity and reinforced the case for unchanged policy.
Commodity and Yield Moves Brent crude fell 7.34% to 87.33, a weekly decline that reduced support for the Norwegian krone. Gold declined 2.24% to 4238.8.
Policy and Sentiment Context Norges Bank’s continued hawkish stance supported NOK crosses even as Brent eased, while Danmarks Nationalbank remained focused on the EUR/DKK peg. Finland’s eurozone membership kept its outlook tied to ECB policy. The week’s arc showed data dependence prevailing over external commodity volatility.
The Riksbank is projected to hold its policy rate given the recent GDP beat and subdued growth momentum. Norges Bank is expected to leave rates unchanged, with its hawkish commentary continuing to underpin NOK despite the Brent decline to 87.33. Danmarks Nationalbank maintained its ERM II focus with no independent moves signaled. Bank of Finland policy remains anchored to the ECB deposit rate amid euro-area unemployment. OIS curves showed only limited repricing for near-term changes, consistent with the data-dependent stance reiterated by both Riksbank and Norges Bank officials.
Calendar data unavailable
The Riksbank rate decision will be the dominant event, with markets pricing no change after the recent growth surprise. Norges Bank’s decision is expected to leave rates unchanged, though any shift in oil-revenue guidance could alter NOK OIS pricing. Danish retail sales and Finnish industrial output later in the week will provide incremental color on euro-area linked demand. These releases matter for the rate path because they inform whether recent resilience extends to the broader region or remains isolated. OIS markets will watch for any forward-guidance tweaks that could steepen or flatten curves ahead of coming quarters. Thin summer liquidity may amplify moves in EUR/SEK and EUR/NOK around the decisions.
The sharp Brent decline to 87.33 introduces downside risk to Norwegian fiscal revenues and NOK strength, potentially challenging the hawkish Norges Bank stance if oil remains lower. Upside surprises in Swedish housing or orders could accelerate krona appreciation and trim easing odds further out. Markets appear to underprice the persistence of above-target inflation in the face of resilient activity prints, leaving OIS curves vulnerable to repricing if euro-area data firm. A stronger dollar channel from US outperformance could tighten Nordic financial conditions through the FX route without domestic policy changes.
| Asset | Level | WoW |
|---|---|---|
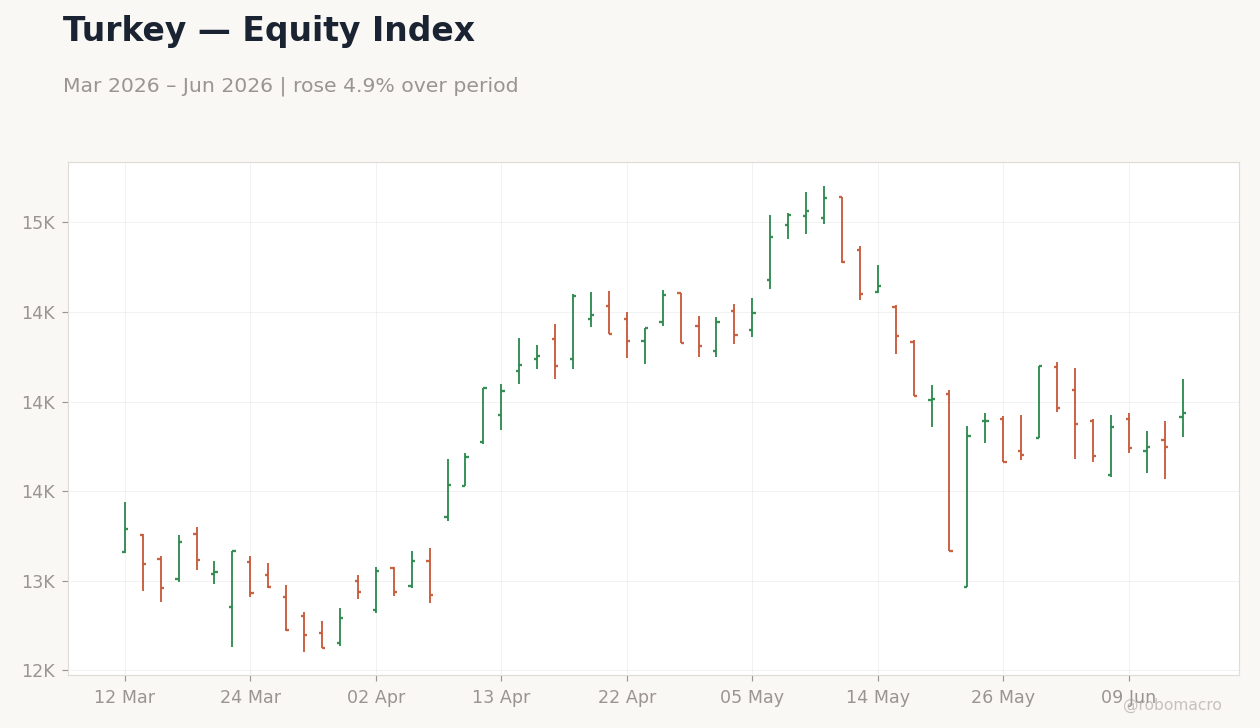
| BIST 100 | 13938.5 | +0.6% |
| iShares Poland | 40.95 | +3.9% |
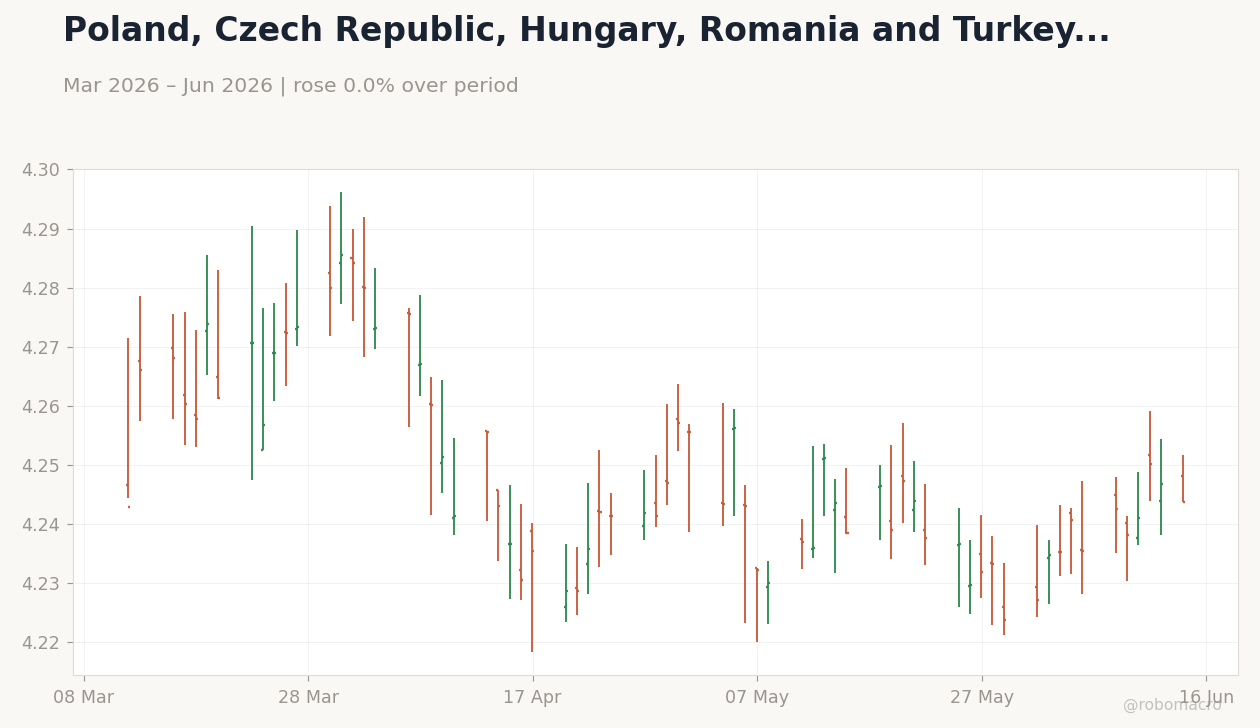
| EUR/PLN | 4.24 | +0.0% |
| EUR/HUF | 352.33 | -0.5% |
| EUR/CZK | 24.09 | -0.3% |
| USD/TRY | 46.24 | +0.3% |
| Brent Crude | 87.33 | -7.3% |
| Gold | 104697.8 | +1.5% |
| Bitcoin | 16.37 | -1.1% |

Turkey data flow dominates regional sentiment. Manufacturing indicators pointed to sequential weakness. The central bank maintained its policy stance in line with expectations. BIST 100 finished the week higher as investors focused on currency stability.
Polish external balances deteriorated. The current account deficit widened sharply from the level recorded a year earlier. Equity inflows supported the market, and iShares Poland outperformed regional peers.
Hungarian yields decoupled on fiscal optimism. Government bond yields moved lower amid renewed EU-fund expectations. The forint posted modest gains against the euro. No high-impact Hungarian data were released.
Czech and Romanian markets remained range-bound. EUR/CZK moved lower with no central bank events scheduled. Regional FX volatility stayed subdued as the decline in Brent crude reduced imported inflation concerns.
The Turkish central bank maintained its policy rate with full market consensus and offered no explicit forward guidance. Markets now price a prolonged hold.
NBP and CNB remained on hold. Poland’s medium-term growth forecast was viewed as consistent with the current stance. CNB commentary continued to flag persistent inflation risks that could delay further easing.
MNB and BNR faced no policy events. Hungary’s yield compression reflected improved EU-fund sentiment rather than any shift in forward guidance. Romania maintained its euro-adoption target despite the earlier GDP contraction. Overall, the week reinforced a stable regional policy outlook with limited near-term repricing in OIS curves.
Industrial production indicators in Turkey confirmed downside momentum in manufacturing. Markets viewed the outcome as consistent with the central bank’s recent policy decision, leaving rate expectations little changed.
Poland’s current account data showed a wider deficit than the prior year, driven by higher goods imports and a softer services surplus. The print coincided with government projections of steady medium-term GDP growth, suggesting domestic demand resilience alongside external balance pressure.
No high-frequency releases occurred in the Czech Republic, Hungary or Romania. Regional growth and inflation outlooks remained anchored to the mid-expansion narrative.
Calendar data unavailable
No high-impact data releases are scheduled for Poland, the Czech Republic, Hungary or Romania through next week. Turkey Business Confidence Index is due, with markets watching for any signal that could influence central bank timing.
Regional FX and equity trading will likely track Brent crude and ECB signals. The absence of major central-bank decisions leaves positioning sensitive to global risk sentiment.
The widening Polish current account deficit raises downside risks to PLN if euro-area demand softens further. Persistent manufacturing weakness in Turkey could prompt a revisit of reserve-management tactics if currency pressure re-emerges. Hungary’s yield decline may prove short-lived if EU-fund disbursements are delayed.
Upside scenarios center on sustained Brent weakness, which would further ease imported inflation across the region. Market positioning appears light in CEE FX after the modest weekly moves.
Equities posted selective gains, with iShares Poland rising 3.91 percent and BIST 100 advancing 0.56 percent. Hungary 10-year yields fell while Poland 10-year yields held steady, steepening the regional curve differential.
FX markets showed modest CEE currency strength against the euro. EUR/PLN closed little changed, EUR/HUF declined 0.47 percent, and EUR/CZK fell 0.34 percent. USD/TRY edged higher, reflecting limited lira pressure.
Commodities provided the clearest relief impulse. Brent crude dropped 7.34 percent while gold rose 1.53 percent. The energy price decline eased imported inflation concerns for Poland, the Czech Republic, Hungary and Romania.
Brent’s weekly decline reduced imported inflation pressure for the four EU-member economies while supporting equity rotation. Trade linkages with the euro area remain the dominant spillover mechanism. Geopolitical risks stayed contained, allowing regional assets to focus on domestic data and EU-fund developments.
| Asset | Level | WoW |
|---|---|---|
| JSE Top 40 | 4238.8 | -2.2% |
| USD/ZAR | 104697.8 | +1.5% |
| EUR/ZAR | 16.37 | -1.1% |
| Platinum | 18.92 | -0.6% |
| Gold | 63757.02 | +0.8% |
| Brent Crude | 1712.2 | -2.1% |
| Naspers | 87.33 | -7.3% |
| Bitcoin | 63757.02 | +0.8% |


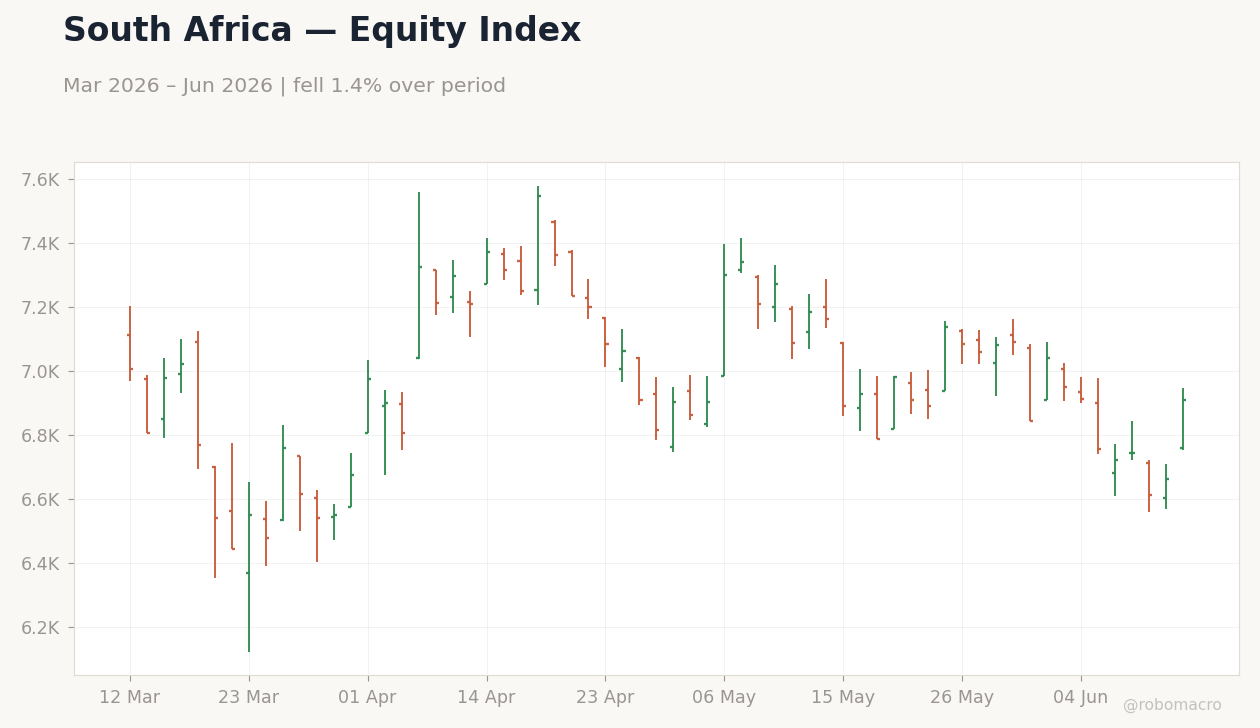
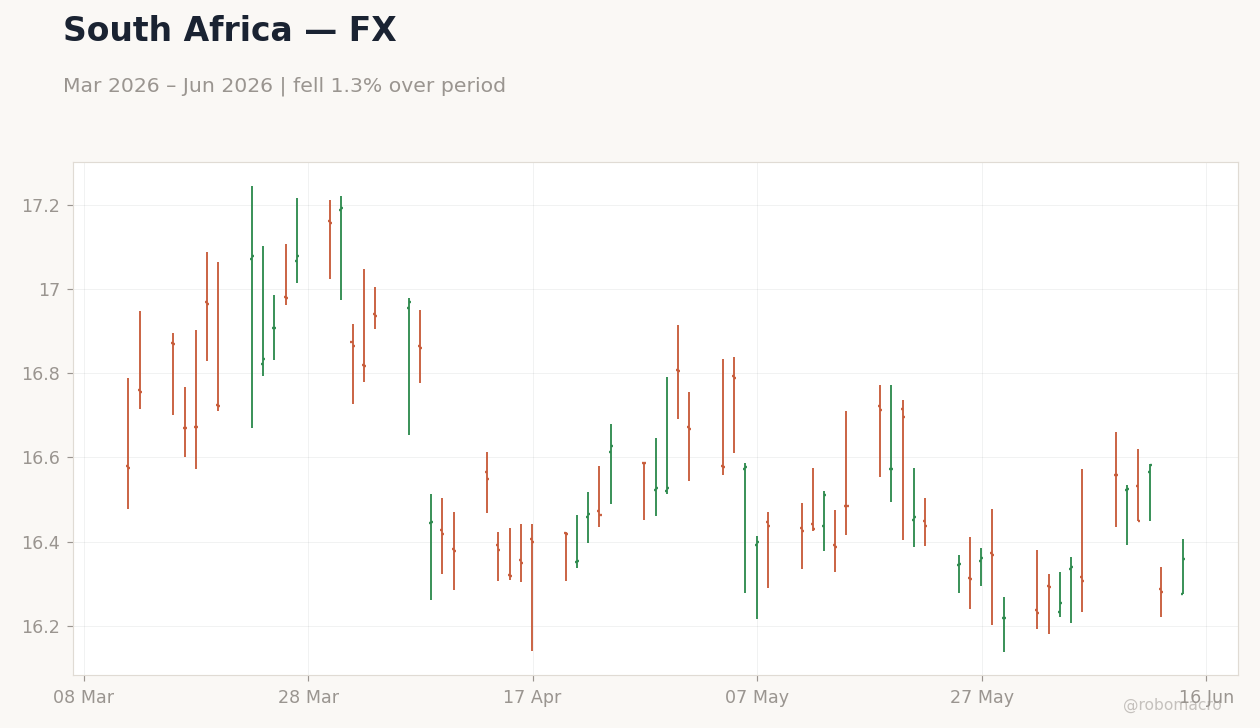
GDP Outperformance Anchors Domestic Data South Africa’s first-quarter GDP expanded quarter-over-quarter and year-over-year, beating expectations. The outcome supported modest rand consolidation, with USD/ZAR closing at 16.37 after a 1.14% weekly range. Fitch Upgrade Provides Fiscal Backdrop The rating action highlighted improved debt trajectory and fiscal discipline, coinciding with long-term government bond yield narrowing even as the policy rate stayed unchanged. Equity Markets Diverge from Macro Prints JSE Top 40 closed the week at 104697.8 after a 2.24% decline. Naspers traded at 87.33 amid commodity price swings. Commodity and External Flows Shape Rand Gold rose to 63757.02 while Brent crude fell to 1712.2, producing mixed mining equity performance. Yield Curve Signals Policy Patience Bull-flattening in the 10-year yield reflected expectations that stronger growth would not immediately alter the central bank’s data-dependent stance. Cross-Week Arc Shows Selective Resilience The combination of the rating upgrade, GDP outperformance, and contained rate volatility produced a narrative of domestic resilience.
The South African Reserve Bank left the policy rate unchanged. The GDP beat reinforced the case for a measured approach to upcoming decisions, as stronger activity reduces the urgency for near-term easing. OIS curves showed only marginal shifts, pricing limited probability of a move at the next meeting. The combination of the year-over-year GDP print and narrowing long-term yields suggests the central bank will continue to tolerate above-target inflation prints provided growth momentum persists. Forward guidance remains data-dependent, with the stronger Q1 outcome tilting risks modestly toward a later rather than earlier adjustment in the rate path.
Calendar data unavailable
South Africa will release inflation prints carrying medium market impact and serving as key inputs for the central bank’s assessment of price pressures. The data will directly inform whether recent GDP strength translates into sustained demand-side inflation. Outcomes could shift OIS pricing around the timing of the next policy decision. Stronger-than-expected inflation would reinforce a patient stance, while cooler prints could reopen discussions of earlier easing. No other high-impact domestic releases are scheduled, leaving global commodity moves and external risk sentiment as secondary drivers of rand and yield dynamics.
The GDP outcome reduces downside growth risks but leaves structural vulnerabilities around electricity supply and mining volatility unaddressed. Upside scenarios center on sustained fiscal consolidation supporting further rand stability, while downside risks include renewed social incidents that could pressure tourism and FDI flows. Commodity price swings remain a key variable, with Brent crude at 1712.2 and gold at 63757.02 capable of reversing recent rand support if global demand weakens. Markets appear to underprice the persistence of social tensions as a drag on sentiment. The combination points to a narrow window for policy patience before external or domestic shocks force a repricing of the easing trajectory.
| Asset | Level | WoW |
|---|---|---|
| ASX 200 | 8804.0 | +2.3% |
| NZX 50 | 13393.87 | +2.7% |
| AUD/USD | 0.7 | +0.1% |
| NZD/USD | 0.58 | +0.7% |
| AUD/NZD | 1.21 | -0.6% |
| BHP | 62.93 | +4.7% |
| Gold | 4238.8 | -2.2% |
| Brent Crude | 87.33 | -7.3% |
| Bitcoin | 63759.06 | +0.8% |


Consumer and business sentiment divergence Australian data releases this week highlighted a clear split between household and corporate readings. Westpac Consumer Confidence Index declined, its weakest level in months, while NAB Business Confidence Index rose. The RBA Bulletin contained no fresh policy signals. These prints followed softer Q1 GDP and retail sales outcomes, reinforcing the view that household spending is cooling faster than business conditions.
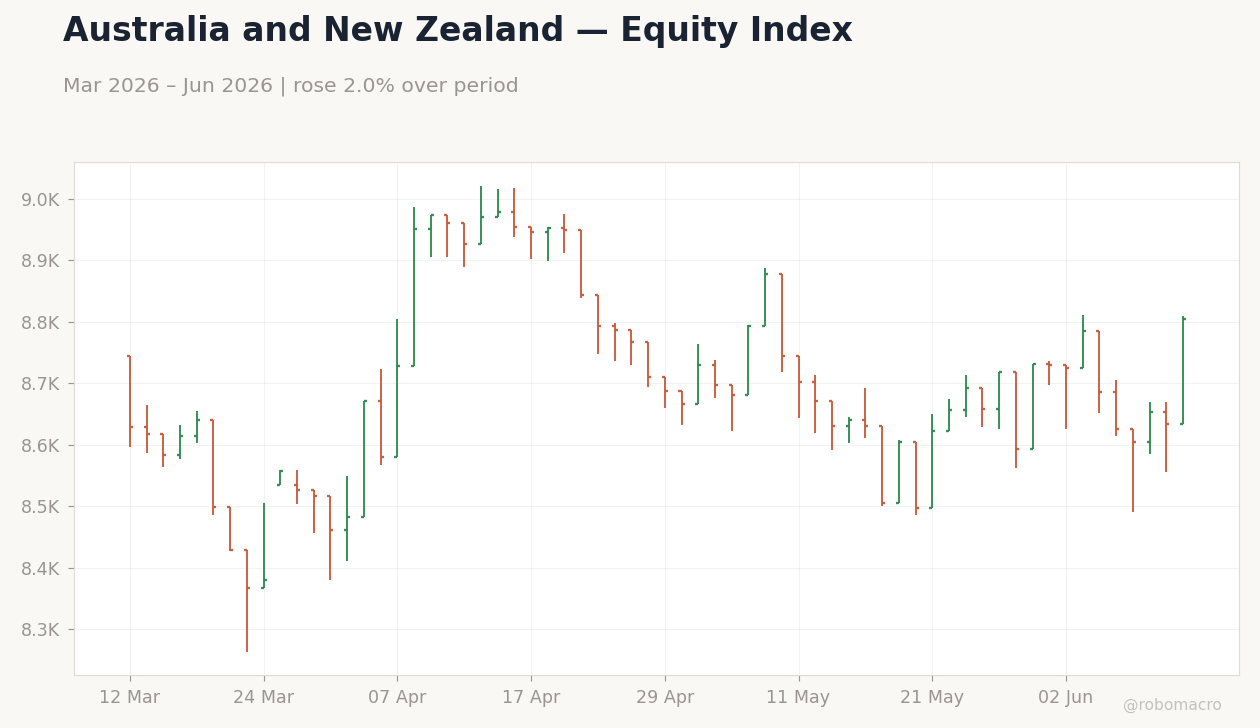
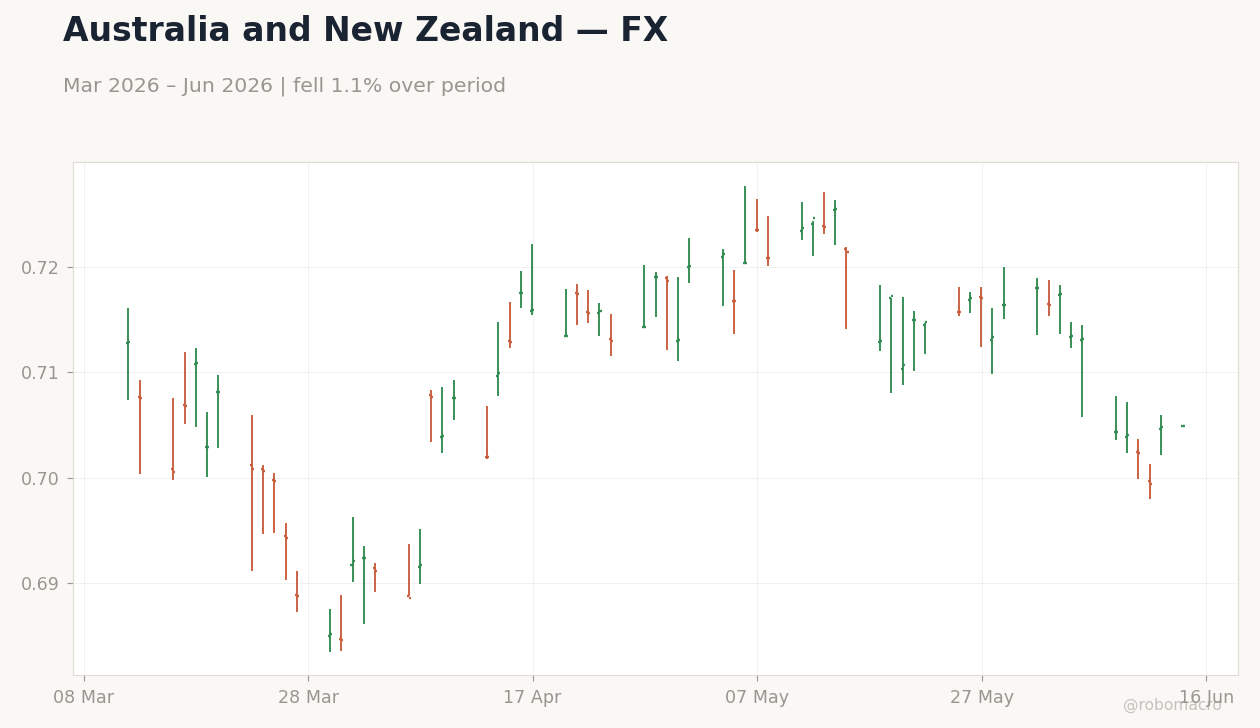
Equity and currency market response Regional equities posted net gains despite intraday volatility. The ASX 200 closed the week at 8804.0 after advancing 2.32 percent, while the NZX 50 reached 13393.87 with a 2.73 percent weekly gain. AUD/USD held at 0.70 with a net 0.07 percent move, and NZD/USD edged 0.67 percent higher to 0.58. BHP shares climbed 4.74 percent to 62.93, tracking iron-ore futures amid mixed commodity flows.
Commodity price influence Brent Crude fell 7.34 percent to 87.33, easing imported inflation pressure and supporting terms-of-trade calculations for both economies. Gold moved 2.24 percent lower to 4238.8 while Bitcoin finished 0.82 percent higher at 63759.06. These moves occurred alongside a stronger US dollar driven by resilient US labor data, which weighed on AUD and NZD early in the week before partial recovery.
Policy expectation shifts NAB joined other major banks in forecasting an RBA rate cut as the next policy move rather than additional hikes. This shift reflected cooling cost pressures and weaker household sentiment readings. New Zealand manufacturing sales strength continued to support NZD outperformance versus AUD, with AUD/NZD closing at 1.21 after a 0.63 percent weekly decline. Housing credit growth in both countries remained subdued under elevated policy rates.
External demand backdrop China demand signals stayed the dominant external driver for Australian iron-ore and coal volumes, while softer dairy prices continued to widen New Zealand’s current-account deficit. The data flow therefore confirmed a mid-expansion phase with selective domestic cooling rather than outright contraction.
The RBA maintained its cash rate through the week while the RBA Bulletin offered no incremental forward guidance. NAB’s revised forecast for a rate cut as the next move prompted markets to trim odds of further tightening in RBA OIS pricing. In New Zealand, manufacturing resilience clouded prospects for near-term RBNZ easing even as NZ short-term rates fell. The data suggest both central banks remain data-dependent, with the RBA appearing closer to the start of its easing cycle than the RBNZ given the sharper drop in Australian consumer readings. OIS curves now embed fewer hikes through year-end for the RBA than at the start of the week.
Calendar data unavailable
The RBA Interest Rate Decision and Press Conference will set the tone, with markets scrutinising any updated language on the timing of the first cut given recent consumer weakness. New Zealand’s Current Account Balance release the same day will test whether manufacturing gains can offset dairy-price pressure. GDP Growth Quarter-over-Quarter and Year-over-Year prints will update views on domestic demand momentum ahead of the next RBNZ decision. The Trade Balance release will further inform terms-of-trade trajectories for both currencies. These releases together will refine rate-path probabilities in RBA and RBNZ OIS curves for the coming quarters.
The week’s consumer-confidence miss raises downside risks to Australian growth forecasts and could accelerate RBA easing if retail sales continue to soften. Upside surprises in New Zealand GDP would support a longer RBNZ hold and widen AUD/NZD further. Markets appear to underprice the possibility of divergent policy timing between the two central banks given the clearer cooling signal in Australian sentiment. Commodity volatility, especially Brent Crude swings, remains the key external swing factor for both currencies and terms of trade.
| Asset | Level | WoW |
|---|---|---|
| Shanghai Composite | 4031.51 | +1.8% |
| CSI 300 | 4777.32 | +1.4% |
| Hang Seng | 24718.1 | +0.2% |
| TAIEX | 44169.04 | +1.5% |
| USD/CNY | 6.76 | -0.1% |
| USD/HKD | 7.84 | +0.0% |
| Copper | 6.45 | +1.8% |
| Brent Crude | 87.33 | -7.3% |
| Gold | 4238.8 | -2.2% |
| Bitcoin | 63760.13 | +0.8% |


Trade outperformance anchors external resilience. China’s May exports and imports both beat consensus, widening the surplus on AI hardware shipments that supported Taiwan semiconductor flows. Mainland equities responded with the Shanghai Composite closing the week at 4031.51 after a 1.82% gain, while CSI 300 advanced 1.35% to 4777.32. Hong Kong’s Hang Seng Index edged up 0.25% to 24718.10 amid stable USD/HKD at 7.84.
Inflation divergence signals uneven domestic momentum. CPI missed forecast and held flat month-over-month, while PPI accelerated. This gap highlighted factory price pressures from commodity inputs against soft consumer demand, consistent with weaker passenger car sales. Property sales in major cities showed only modest sequential improvement, remaining below pre-2024 levels.
Policy coordination extends across borders. The PBoC-HKMA-Bank Indonesia MoU on yuan-rupiah settlement bypassed dollar channels. HKMA advanced its tokenized bond expert group and confirmed Hong Kong dollar stablecoin launches later this year. Taiwan’s TAIEX closed at 44169.04 after a 1.53% weekly gain, supported by AI chip demand despite intraday swings.
Cross-strait and commodity linkages remain stable. No new export restrictions emerged, keeping investment flows steady, while copper rose 1.82% to 6.45 on renewed mainland smelter buying. Overall, the week reinforced external demand strength offsetting persistent domestic consumption softness.
The PBoC maintained routine 7-day reverse repo operations throughout the week and asked major banks to curb interbank lending to ease the cash glut. No rate decisions were scheduled from the HKMA or CBC. The PBoC-HKMA-Bank Indonesia MoU on direct yuan-rupiah settlement marked a concrete step toward reduced dollar dependence in regional trade.
New yuan loans rebounded in May after April’s decline, while total social financing rose on seasonal factors. These flows suggest the PBoC continues to manage liquidity without signaling an imminent shift in the OIS curve. Data showing stalled CPI and firm PPI reinforce a medium-term rate path that tolerates modest inflation undershoots to support external-led growth. Forward guidance remained data-dependent with no explicit comments on near-term easing.
China’s May trade release delivered a clear beat on both exports and imports, widening the surplus. The outperformance aligned with robust AI hardware demand and lifted near-term industrial output expectations. CPI printed below forecast and held flat month-over-month, confirming stalled consumer prices and reinforcing the view that domestic demand remains below trend. PPI accelerated, marking the fastest factory-price gain in nearly four years and pointing to pipeline cost pressures from commodities.
These prints together indicate the cycle sits in mid-expansion with external resilience supporting growth while consumer inflation stays subdued. The data lower the urgency for broad stimulus yet keep targeted support in focus for the property sector. Fixed asset investment and retail sales scheduled for next week will test whether the trade impulse feeds through to domestic activity. House price data will further clarify whether sequential stabilization is taking hold. Overall, the releases tilt the medium-term growth outlook modestly higher without altering the disinflationary consumer backdrop.
Calendar data unavailable
China’s House Price Index, Industrial Production, Retail Sales, and Fixed Asset Investment releases are due next week. These prints will clarify whether the May trade impulse is feeding into domestic activity and whether property stabilization is broadening.
PBoC liquidity operations and any State Council comments on local-government bond quotas will be monitored closely. Taiwan will track TSMC sales trends and potential updates on advanced packaging export controls. Hong Kong investors await further stablecoin issuance details. The data slate offers the first read on June activity and will shape expectations for targeted policy support ahead of the next PBoC meeting window.
The strong trade print reduces near-term downside risks to growth but highlights vulnerability to any escalation in Middle East tensions that could disrupt semiconductor supply chains. Positioning in Greater China equities remains light after the modest weekly gains, leaving room for further upside if industrial production beats. Volatility in Brent crude could transmit to PPI and complicate the inflation outlook.
Upside scenarios center on sustained AI hardware demand lifting Taiwan and mainland industrial output above consensus. Downside risks include further property sector maturity extensions without broad stimulus. Market mispricing appears most evident in the wide CPI-PPI gap, which may pressure margins if consumer demand fails to recover. Flow considerations favor selective commodity exposure given copper’s weekly advance on physical buying.
Equities posted net weekly gains led by the Shanghai Composite’s 1.82% advance to 4031.51 and CSI 300’s 1.35% rise to 4777.32. The Hang Seng Index added 0.25% to 24718.10 while TAIEX gained 1.53% to 44169.04 despite a sharp drop mid-week. Bonds saw limited movement as China 10-year yields held steady amid ample liquidity from PBoC operations.
FX markets showed USD/CNY easing 0.05% to 6.76 over the week with the peg at USD/HKD 7.84 remaining intact. Commodities diverged sharply: copper rose 1.82% to 6.45 on China demand signals while Brent crude fell 7.34% to 87.33 and gold declined 2.24% to 4238.80. Bitcoin ended 0.82% higher at 63760.13.
US data outperformance in recent weeks has kept the dollar firm, limiting further USD/CNY downside despite the trade surplus expansion. The PBoC-HKMA-Bank Indonesia MoU on yuan-rupiah settlement reflects ongoing efforts to diversify away from dollar channels amid global trade uncertainty. Brent crude’s weekly decline eased imported inflation pressure for net importers in the region.
Geopolitical risks around Middle East tensions weighed on TAIEX intraday moves and semiconductor sentiment. Cross-border spillovers from US labor resilience continue to tighten global financial conditions through the dollar, though China’s export strength provides a partial offset.
| Asset | Level | WoW |
|---|---|---|
| KOSPI | 8123.62 | +8.5% |
| KOSDAQ | 1029.05 | +12.9% |
| USD/KRW | 1517.89 | -2.4% |
| Samsung | 322500.0 | +9.1% |
| SK Hynix | 2150000.0 | +12.5% |
| Brent Crude | 87.33 | -7.3% |
| Gold | 4238.8 | -2.2% |
| Bitcoin | 63760.14 | +0.8% |


GDP revision anchors policy caution. South Korea revised Q1 GDP growth higher, exceeding prior estimates and confirming a firmer starting point for the year that immediately tempered expectations for aggressive BoK easing. The upgrade aligned with resilient external demand, as semiconductor and shipbuilding exports continued to support the trade balance despite currency volatility.
Labor market holds steady amid equity swings. The unemployment rate matched the prior reading and showed no deterioration in conditions that might otherwise have opened room for earlier rate relief. Equity markets experienced sharp daily reversals, with the KOSPI closing the week at 8,123.62, up 8.54% week-over-week.
FX measures blunt won pressure. Authorities launched FX bank inspections for the first time in 14 years and expanded won-support operations, helping USD/KRW close at 1,517.89. The won’s 2.35% weekly gain occurred alongside foreign equity outflows and stepped-up pension hedging, yet the currency avoided further breach of recent lows.
Inflation and commodity backdrop complicate timing. Headline inflation remained elevated on fuel-price surges, keeping real-rate calculations in focus and reinforcing the BoK’s data-dependent stance even as Brent crude fell 7.34% to 87.33 over the week. Short-term rates held steady while long-term yields edged higher, reflecting limited repricing for near-term policy shifts.
Semiconductor rotation offsets broader weakness. Samsung and SK Hynix posted net weekly gains of 9.14% and 12.51% respectively, providing a counterweight to broader equity moves and underscoring export resilience that the GDP revision had already highlighted.
The Bank of Korea left the base rate unchanged throughout the week while the Q1 GDP upgrade and steady unemployment reduced the likelihood of near-term cuts. Officials signaled willingness to tolerate above-target inflation to support the won, with news flow highlighting possible rate-hike considerations if fuel-driven price pressures persist. OIS curves reflected the shift, trimming cut probabilities after the growth beat and FX-stabilization measures. No MPC speakers appeared, leaving the regional economic report and foreign-reserve data as the main BoK releases. The combination of firmer activity and currency-defense actions points to a higher-for-longer policy path into the next meeting.
Calendar data unavailable
Next week’s calendar is light on hard data, directing attention to ongoing FX flows and any follow-up regulatory statements on leveraged positions. Markets will watch for updates on provincial policy-finance expansion and potential further bank inspections that could influence won volatility. The BoK regional report already released this week offered incremental insight into growth momentum, but any additional commentary on export resilience will matter for rate-path assessments. Traders will monitor semiconductor order trends and global chip demand signals, given their direct link to the Q1 GDP outcome. OIS pricing is expected to remain sensitive to any fresh inflation prints or dollar moves that could alter the balance between external-stability goals and domestic easing room. Absent major releases, focus stays on whether the won’s recent 2.35% gain sustains or requires additional support ahead of upcoming decisions.
The week’s GDP upgrade and FX interventions have shifted the outlook toward a more balanced but still cautious rate path, reducing the probability of early easing while leaving room for upside surprises in exports. Downside risks center on renewed won weakness if foreign outflows accelerate or Brent crude rebounds from 87.33, potentially widening the terms-of-trade gap and complicating inflation control. Upside scenarios include sustained semiconductor momentum that could lift 2H growth above current expectations and allow the BoK to maintain its hawkish tilt without market pushback. Markets appear to underprice the persistence of elevated inflation and the willingness of authorities to defend the currency through regulatory channels rather than rate cuts alone.
| Asset | Level | WoW |
|---|---|---|
| JCI | 6007.66 | +12.5% |
| SET | 1592.41 | +2.0% |
| KLCI | 1683.63 | +0.2% |
| PSEi | 5910.06 | +0.5% |
| STI | 5025.8 | +1.2% |
| USD/IDR | 17916.0 | -0.6% |
| USD/THB | 32.68 | -0.5% |
| USD/MYR | 4.05 | +0.2% |
| USD/PHP | 60.72 | -1.7% |
| USD/SGD | 1.28 | -0.5% |
| Brent Crude | 87.33 | -7.3% |
| Gold | 4238.8 | -2.2% |


Indonesia Policy Shock Dominates Flows Equity and currency markets recorded sharp rebounds. JCI rose 12.46% to 6007.66 while USD/IDR strengthened 0.63% to 17916. Regional FX markets also firmed, with USD/THB declining 0.52% to 32.68 and USD/PHP falling 1.67% to 60.72.
Regional Equities Diverge on Currency Defense JCI posted a 12.46% weekly gain. SET rose 1.97% to 1592.41 and STI advanced 1.25% to 5025.80. KLCI edged up 0.24% to 1683.63 while PSEi gained 0.52% to 5910.06. USD/MYR closed 0.22% higher at 4.05 and USD/SGD declined 0.51% to 1.28.
Labor Data and Commodity Relief Provide Offset Brent crude declined 7.34% to 87.33, easing imported cost pressures for Thailand, Malaysia and Vietnam. Gold fell 2.24% to 4238.8 while Bitcoin rose 0.83% to 63766.17.
External Balances and Fiscal Anchors Tested Regional equity markets showed mixed responses to external price moves, with SET and KLCI posting modest gains. Singapore's STI rose 1.25% for the week.
Cross-Asset Repricing Reflects Policy Differentiation Regional 10-year yields remained sensitive to currency moves. The data confirm that domestic asset performance aligned with external commodity and equity price shifts.
No central bank adjusted policy. BoT, BNM, BSP, MAS and SBV left rates unchanged and issued no fresh forward guidance. OIS markets priced modest tightening possibilities ahead of upcoming decisions while MAS maintained its S$NEER band without adjustment. The data suggest policy divergence persists, with limited immediate spillover to BoT or BNM rate expectations.
Calendar data unavailable
Inflation prints for Malaysia headline the period. No major data releases are scheduled for Thailand, Singapore or Vietnam. Markets will monitor follow-through capital flows and any central bank communications. The releases matter for rate path expectations because stronger inflation or weaker FX would support a tighter stance while softer prints could reopen easing discussions. MAS and SBV are expected to stay on hold absent fresh inflation surprises. Overall the calendar points to continued data dependence across the six central banks.
Currency stabilization reduced near-term depreciation pressure but raised borrowing costs where policy tightened, creating an upside scenario of faster stabilization if inflows resume. A downside path emerges if growth data disappoint and force a pause in tightening. Markets appear to underprice the persistence of external balance pressures and their implications for currency stability. Regional equity valuations remain sensitive to Brent swings, with the 7.34% weekly drop providing temporary relief that could reverse on supply shocks. The configuration suggests selective mispricing across OIS curves.
| Asset | Level | WoW |
|---|---|---|
| Nifty 50 | 23622.9 | +2.2% |
| Sensex | 75527.95 | +2.7% |
| USD/INR | 95.1 | +0.2% |
| EUR/INR | 110.04 | -0.0% |
| Reliance | 1293.0 | +2.4% |
| HDFC Bank | 772.45 | +4.6% |
| Brent Crude | 87.33 | -7.3% |
| Gold | 4238.8 | -2.2% |
| Bitcoin | 63766.16 | +0.8% |


External balance turnaround India recorded a current account surplus for the quarter ending March, reversing the prior deficit and exceeding the consensus shortfall. The print reflected stronger services exports and lower gold imports, reducing immediate pressure on reserves. RBI responded with a support package that included forex swaps and incentives for NRI deposits, aiming to attract additional inflows.
Equity and currency stabilization Nifty 50 rose 2.16% to 23622.9 and Sensex gained 2.73% to 75527.95 over the seven days, with banking stocks leading. USD/INR ended at 95.1 after closing higher mid-week, showing modest net depreciation of 0.16%. Brent crude fell 7.34% to 87.33, easing import costs.
Inflation and growth signals May CPI accelerated, landing just below the 4.0% consensus and remaining inside the RBI’s tolerance band. FY26 GDP growth was projected by the RBI at a level consistent with resilient domestic demand. The data flow confirmed that external resilience offset portfolio outflow pressures without requiring immediate policy rate adjustment.
Policy response and market pricing RBI liquidity operations and expanded FPI access provided the dominant support for sentiment. Gold declined on the week while Bitcoin rose modestly, underscoring selective risk-on flows into domestic assets. The week’s arc therefore centered on external-balance improvement and targeted RBI intervention rather than broad-based monetary easing.
The Reserve Bank of India maintained the repo rate and focused on balance-sheet tools rather than rate guidance. The support package and forex-swap facility were presented as measures to anchor the rupee and support the balance of payments, with no change signaled to the current stance. May inflation kept the rate path on hold, consistent with the RBI’s growth projection. OIS curves showed limited repricing for near-term cuts, reflecting the central bank’s emphasis on attracting long-term inflows over short-term rate relief. Minutes scheduled for next week will likely reiterate data dependence ahead of upcoming decisions.
Calendar data unavailable
The Monetary Policy Meeting Minutes on June 19 will provide the primary domestic signal, with markets focused on any commentary regarding the inflow framework. No other high-impact releases are scheduled, leaving attention on FPI flows and oil-price developments that could affect the import bill. The minutes are expected to reinforce the RBI’s preference for liquidity operations over rate changes at the next meeting. Global risk sentiment and Brent crude movements will continue to influence USD/INR. Any further extension of the forex-swap window could support reserve accumulation into coming quarters. The absence of fresh activity data keeps the focus squarely on external financing conditions and their implications for the rate path.
The current account surplus reduces near-term external vulnerability, yet sustained portfolio outflows could still pressure reserves if global risk aversion intensifies. Brent’s weekly decline lowers imported inflation risks, but renewed geopolitical supply concerns could reverse that relief and push inflation above the midpoint. RBI measures have stabilized USD/INR at 95.1, yet the weekly net weakening suggests markets continue to price modest depreciation pressure. Upside growth surprises in coming quarters could delay any easing at upcoming decisions, while downside oil-price spikes remain the clearest threat to the inflation trajectory. The data suggest markets are correctly pricing a prolonged hold at the current policy rate, with limited scope for near-term OIS repricing.
| Asset | Level | WoW |
|---|---|---|
| BIST 100 | 13938.5 | +0.6% |
| USD/TRY | 46.24 | +0.3% |
| EUR/TRY | 53.55 | +0.8% |
| GBP/TRY | 62.01 | +0.8% |
| Gold (TRY) | 4238.8 | -2.2% |
| Brent Crude | 87.33 | -7.3% |
| EUR/USD | 1.16 | +0.4% |
| Bitcoin | 63766.17 | +0.8% |


Equity and commodity linkage. The BIST 100 posted a net 0.56 percent weekly gain that coincided with Brent crude declining 7.34 percent to 87.33. The weekly drop in Brent provided the clearest relief impulse for Turkish equities.
FX stability amid global dollar moves. USD/TRY climbed 0.33 percent to 46.24 over the five trading days, a move smaller than the 0.78 percent rise in EUR/TRY to 53.55. Daily changes remained contained, indicating limited pressure on the lira despite the stronger dollar environment.
Cross-asset rotation. Gold priced in TRY fell 2.24 percent to 4238.8 while Bitcoin rose 0.83 percent to 63766.17, showing selective rotation within Turkish investor portfolios.
Data dependence confirmed. With no major releases completing this week, market moves were driven by external commodity and global risk factors rather than domestic surprises. The absence of consensus misses on growth or inflation prints left the narrative anchored to the oil-relief channel.
Through-line from prior weeks. The modest equity recovery and contained currency depreciation extend the pattern of selective domestic resilience amid dollar-driven external conditions. Brent’s sharp weekly decline reversed part of the earlier volatility and aligned with the disinflationary impulse.
The Central Bank of the Republic of Turkey received no new policy signals this week, leaving the OIS curve focused on the timing of the next decision. Incoming activity and sentiment prints will feed directly into assessments of demand momentum ahead of that meeting. Prior-week data showing Q1 GDP missing consensus and May inflation reaccelerating continue to anchor expectations for a cautious stance. CBRT OIS pricing shifted only marginally, reflecting limited conviction for near-term easing or tightening. Forward guidance remains data-dependent, with the Bank likely to weigh the oil-relief impulse against persistent price pressures when updating its rate path.
Calendar data unavailable
Incoming activity and sentiment data will provide the first hard read on second-quarter momentum and its implications for the Central Bank of the Republic of Turkey’s growth assessment. The prints matter for the rate path because they inform the balance between demand resilience and inflation persistence ahead of upcoming decisions. Markets will parse the data for any sequential improvement that could support a hold or any renewed softening that might reopen easing discussions in coming quarters. The releases arrive against a backdrop of lower Brent levels that could ease imported price pressures over subsequent months. OIS curves will likely adjust only modestly unless the figures deviate sharply from the recent trend of mixed activity data. Overall, the week’s information will help refine probabilities around the next policy meeting without altering the medium-term data-dependent framework.
A sharper-than-expected rebound in activity data could reinforce the view that domestic demand remains resilient, potentially delaying any CBRT easing and supporting higher OIS rates. Conversely, a weak sentiment print might revive concerns about growth momentum and increase the probability of earlier policy adjustment. The market appears to underprice the persistence of inflation reacceleration noted in prior weeks, leaving room for upside surprises in price data to push terminal-rate expectations higher. External risks center on any reversal in Brent’s recent decline, which could quickly transmit to TRY and force a reassessment of external-balance pressures. Overall, the data flow next week will test whether the oil-relief narrative can coexist with still-elevated domestic inflation without prompting a shift in the CBRT’s forward guidance.
| Asset | Level | WoW |
|---|---|---|
| Saudi Aramco | 26.88 | -0.4% |
| MSCI Saudi | 39.38 | +2.9% |
| MSCI UAE | 19.62 | +4.9% |
| DFM General | 5954.04 | +3.8% |
| MSCI Qatar | 18.6 | +1.9% |
| MSCI Kuwait | 38.23 | +2.6% |
| Brent Crude | 87.33 | -7.3% |
| WTI Crude | 84.88 | -7.0% |
| Gold | 4238.8 | -2.2% |
| USD/SAR | 3.75 | +1.5% |
| USD/AED | 3.67 | +0.0% |
| USD/KWD | 0.31 | -0.5% |


Equity markets advance. MSCI Saudi rose 2.85% to 39.38 while MSCI UAE gained 4.92% to 19.62 and DFM General climbed 3.82% to 5954.04. MSCI Qatar added 1.92% to 18.60 and MSCI Kuwait increased 2.56% to 38.23.
Oil prices decline sharply. Brent crude fell 7.34% to 87.33 and WTI declined 7.03% to 84.88. Gold moved 2.24% lower to 4238.8.
Currency pegs hold steady. USD/SAR ended at 3.75 and USD/AED at 3.67, confirming unchanged GCC central bank OIS pricing and limited pressure on interbank rates. Saudi Aramco closed at 26.88.
GCC Central Banks maintained unchanged policy settings through the week with no speeches, minutes, or decisions released. USD/SAR at 3.75 and USD/AED at 3.67 showed zero deviation from peg levels, leaving GCC central bank OIS curves flat and pricing no near-term rate adjustments. Lower Brent realizations reduce imported inflation risks and reinforce the case for steady forward guidance ahead of upcoming decisions. Regional banks continue to monitor interbank liquidity signals but report no material shifts in reserve or OIS metrics.
Calendar data unavailable
Attention will center on any OPEC+ compliance updates and late-June ministerial signals that could influence the next policy-relevant oil-price path. Markets will also track follow-through on Saudi-Türkiye railway agreements and QatarEnergy North Field LNG timelines for their impact on non-oil growth in coming quarters. Equity volumes on Tadawul and DFM are expected to respond to any fresh oil-price direction given its direct link to fiscal balances. Broader sentiment hinges on global crude demand indicators and Red Sea shipping developments that could alter energy supply risk premia ahead of the next meeting. No major macroeconomic releases appear on calendars for Saudi Arabia, UAE, Qatar, Kuwait, Oman or Bahrain.
The sharp Brent decline introduces downside risk to fiscal revenues and could pressure project financing if the move extends. Regional security headlines, including Iran-related developments and Hormuz closure references, raise the possibility of renewed oil-price spikes that markets currently appear to underprice. Upside scenarios center on continued equity market momentum and stable reserve metrics, which would further validate the current GCC central bank OIS curve.
| Time | Country | Event | Consensus | Prior | Impact |
|---|
AI-Generated Content: This publication is 100% generated by artificial intelligence systems (xAI Grok) and should not be considered as financial advice, investment recommendation, or professional research. All analysis, forecasts, and commentary are algorithmically produced.
Data Sources: Market data sourced from Yahoo Finance, CBOE, FinanceFlow API, FRED, and national statistics offices. Economic calendar data from RoboMacro Economic Calendar. Forecast data based on IMF WEO, OECD Economic Outlook, and consensus surveys. All data subject to revision and may be delayed.
No Warranty: RoboMacro makes no warranty, express or implied, regarding the accuracy, completeness, or reliability of the information contained in this publication. Data may be delayed, incomplete, or contain errors. Past performance is not indicative of future results.
Not Financial Advice: Nothing in this publication constitutes investment advice, tax advice, legal advice, or any other form of professional advice. Any opinions expressed are AI-generated and do not represent the views of any individual or organisation. Readers should consult qualified professionals before making investment decisions.
Forecast Methodology: GDP and CPI forecasts are derived from IMF World Economic Outlook projections, OECD estimates, and real-time consensus surveys. Central bank rate paths incorporate OIS market pricing, forward guidance analysis, and Taylor rule estimates. All forecasts are point estimates and carry significant uncertainty.
Contact: [email protected] | robomacro.com
Publication: Global Macro Watch is published weekly on Fridays. © 2026 RoboMacro. All rights reserved.