Mid-Cycle Expansion Persists Amid Renewed Energy Impulse
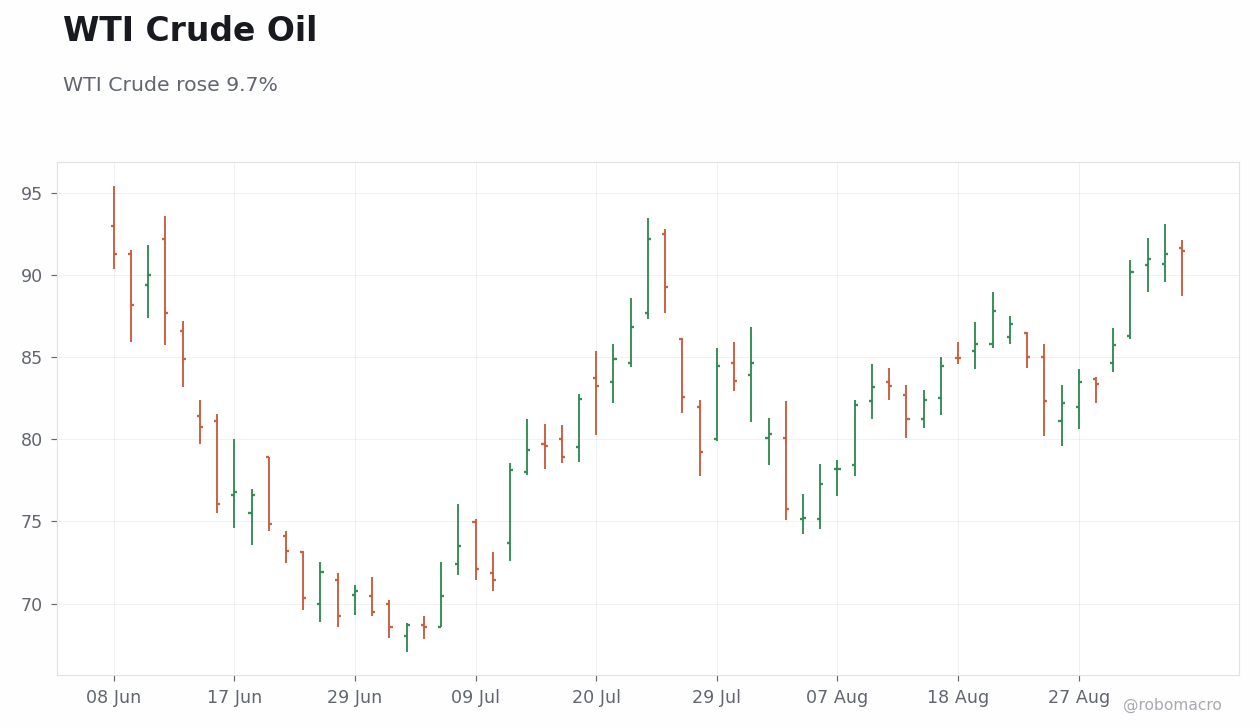
The week of August 31 to September 4 placed the global expansion in its mid-phase, where a sharp commodity price impulse interacted with moderating activity data to sustain a data-dependent policy equilibrium. Brent crude settled at 96.28 after a 6.4 percent advance, while WTI reached 91.48, up 6.67 percent. These moves occurred against a backdrop of mixed growth prints that failed to shift any major central bank from its stated stance. The configuration leaves policymakers absorbing the energy-driven price pressure through the second half of 2026 without immediate recalibration of forward guidance.
US data illustrated the point on September 2 and September 3. The ISM Manufacturing PMI missed consensus and pulled the employment sub-index lower, while ADP private payrolls rose less than expected. Factory orders advanced more than forecast, providing a modest offset, yet the broader tone remained one of gradual labor-market easing. Dallas Fed Manufacturing Index rose sharply on the same week, underscoring regional divergence within the national slowdown. These releases reinforced the Federal Reserve’s data-dependent path without altering near-term expectations.
DM Theme: Selective Resilience Meets Shared Refusal to Shift Parameters
Published every Sunday afternoon 100% AI-generated — not financial advice
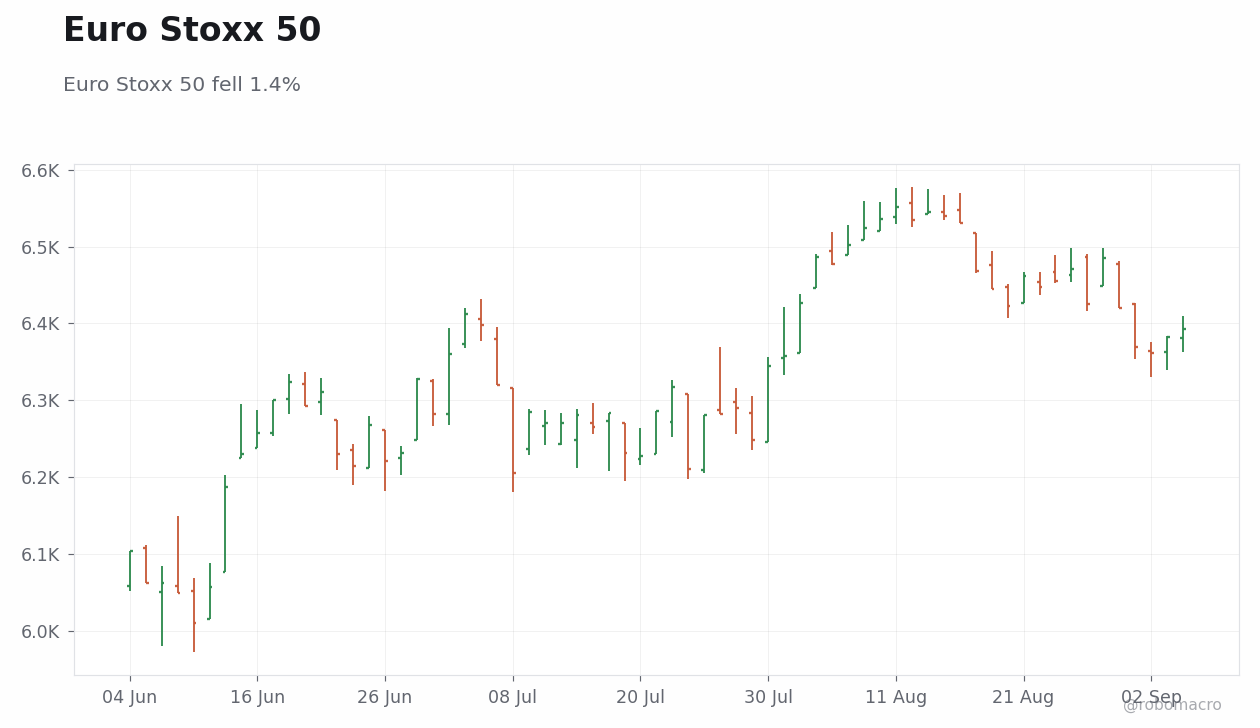
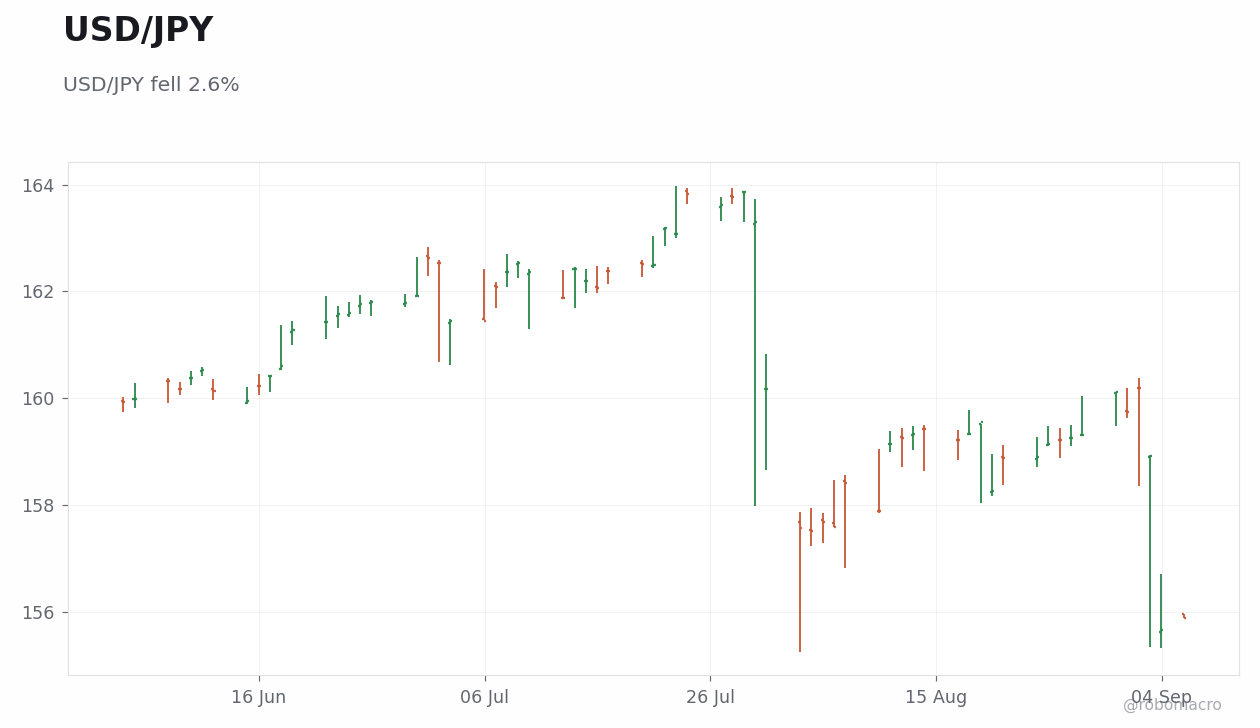
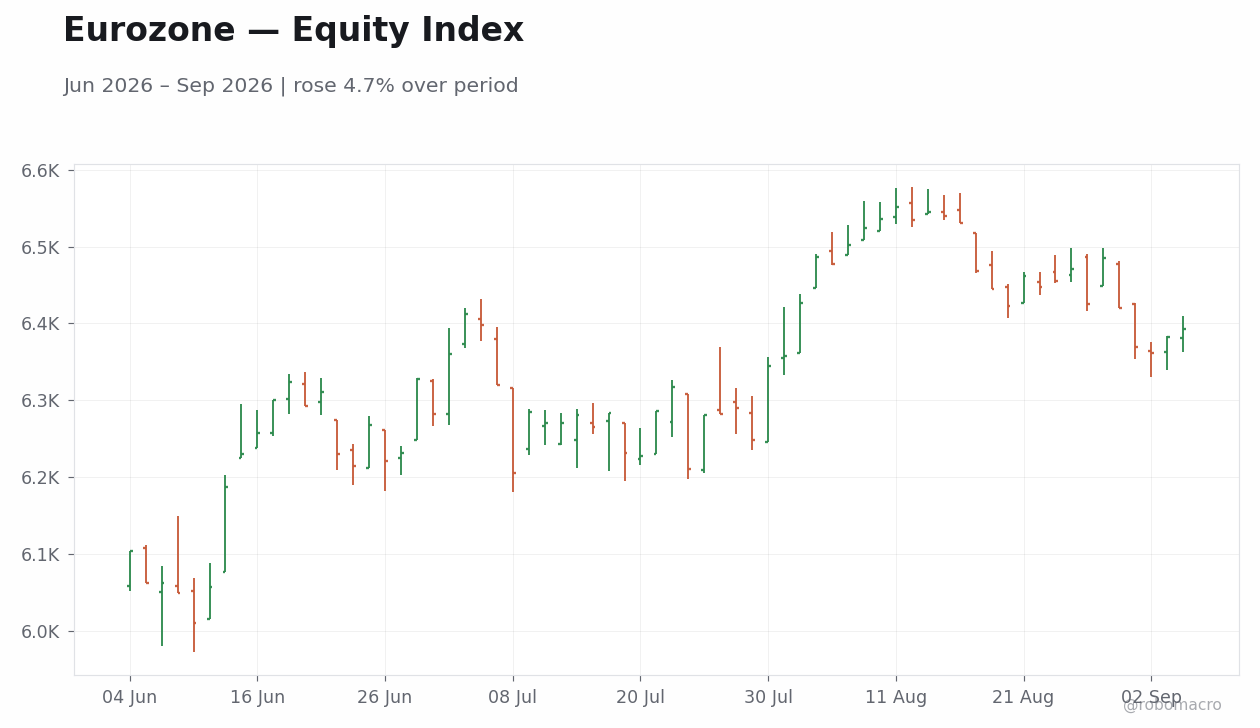
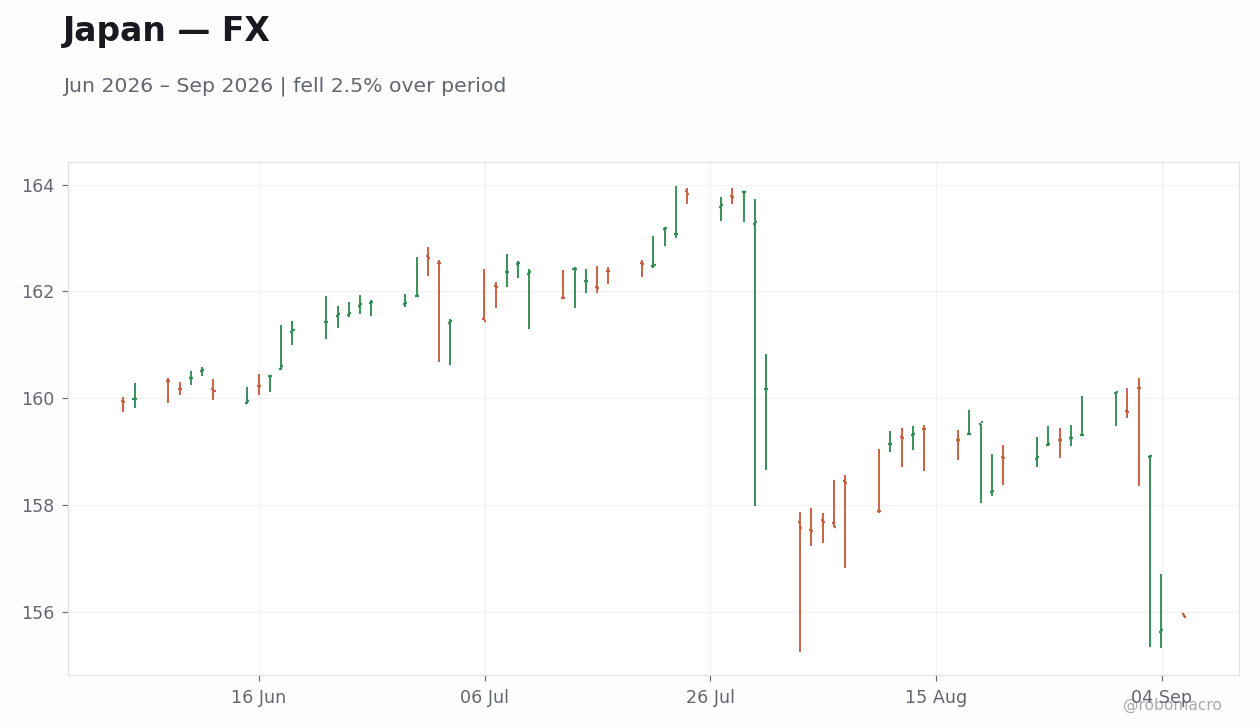
Developed-market outcomes clustered around selective resilience and a common refusal to recalibrate policy on mixed prints. German preliminary August CPI rose year-over-year while retail sales declined sharply month-over-month, highlighting divergent price and demand signals. Euro Stoxx 50 closed at 6392.93, down 0.42 percent. ECB speakers maintained data dependence around the deposit rate after inflation prints showed stability near target levels. In Japan, weak July industrial production tempered near-term Bank of Japan tightening expectations early in the week, yet board member Takada’s September 2 remarks stressed the need for a broad range of policy options. USD/JPY declined 2.62 percent to 155.93 as intervention warnings combined with hawkish BoJ signals. The United Kingdom recorded mortgage approvals at their lowest level since January 2024, while Nationwide house prices rose month-over-month in August. BoE Governor Bailey highlighted AI-driven downturn risks in G20 remarks on the same week that the Bank’s mandate expanded to stablecoin oversight.
EM Theme: Commodity Strength Supports Selective Carry and Fiscal Prospects
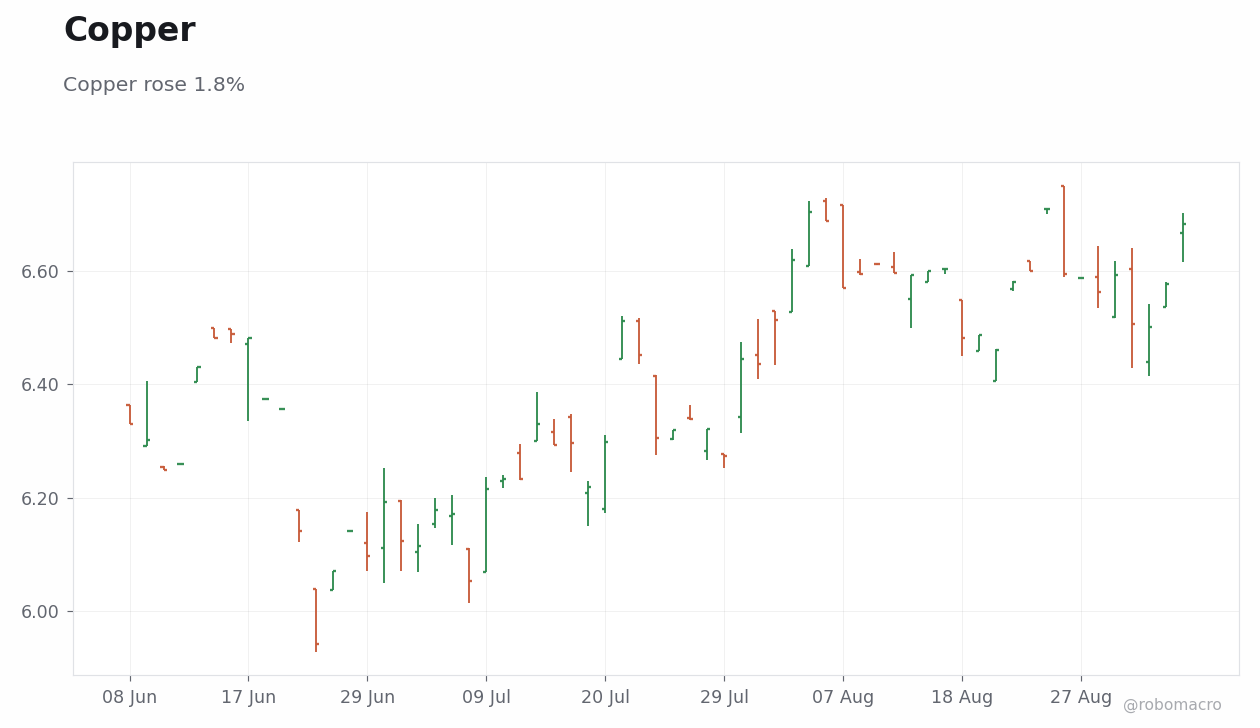
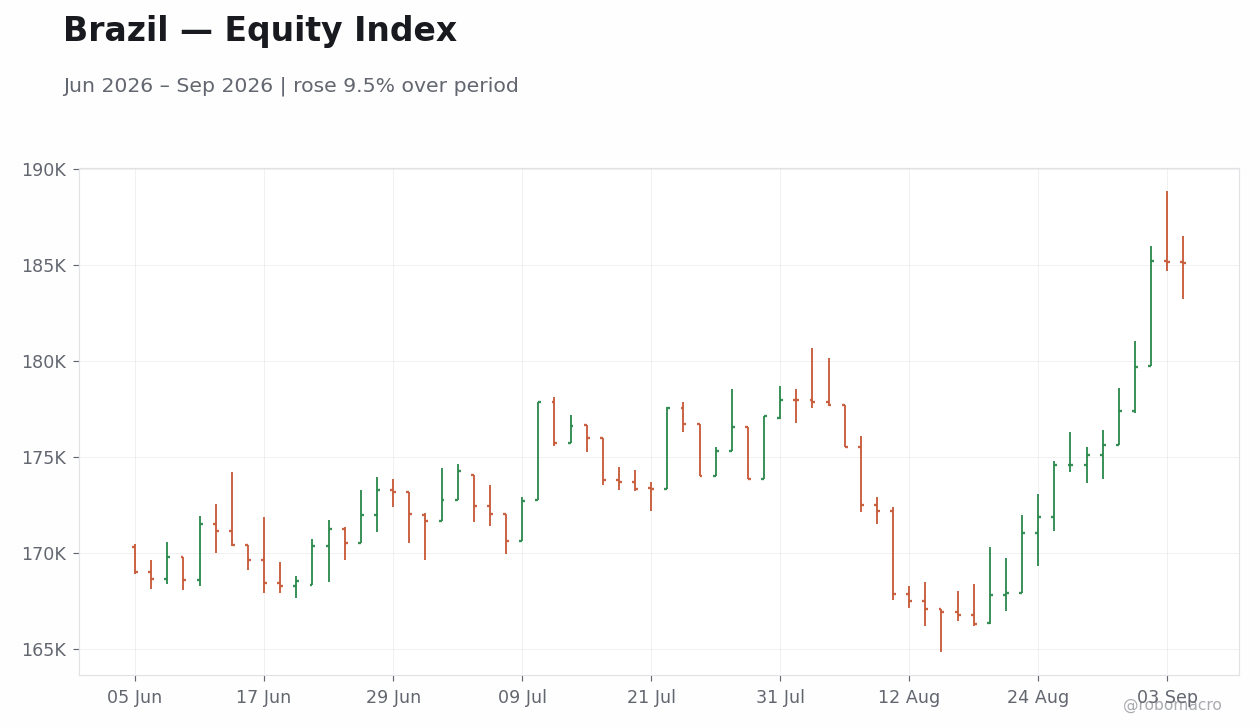
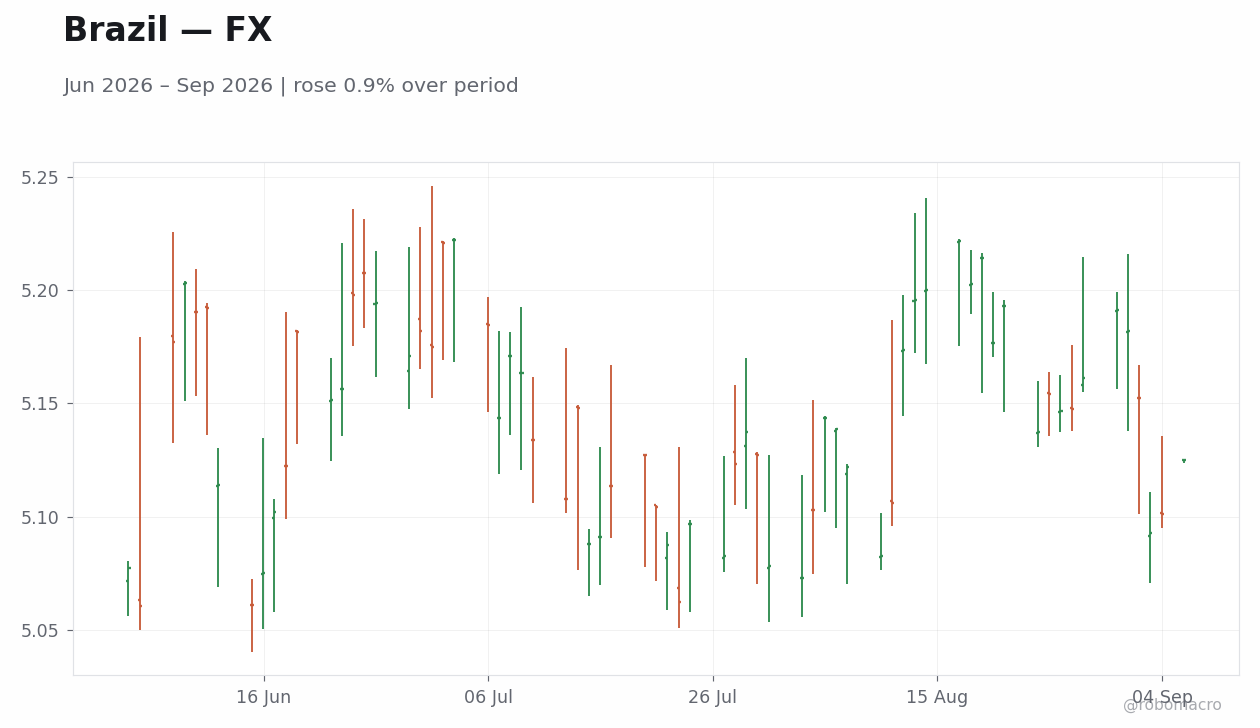
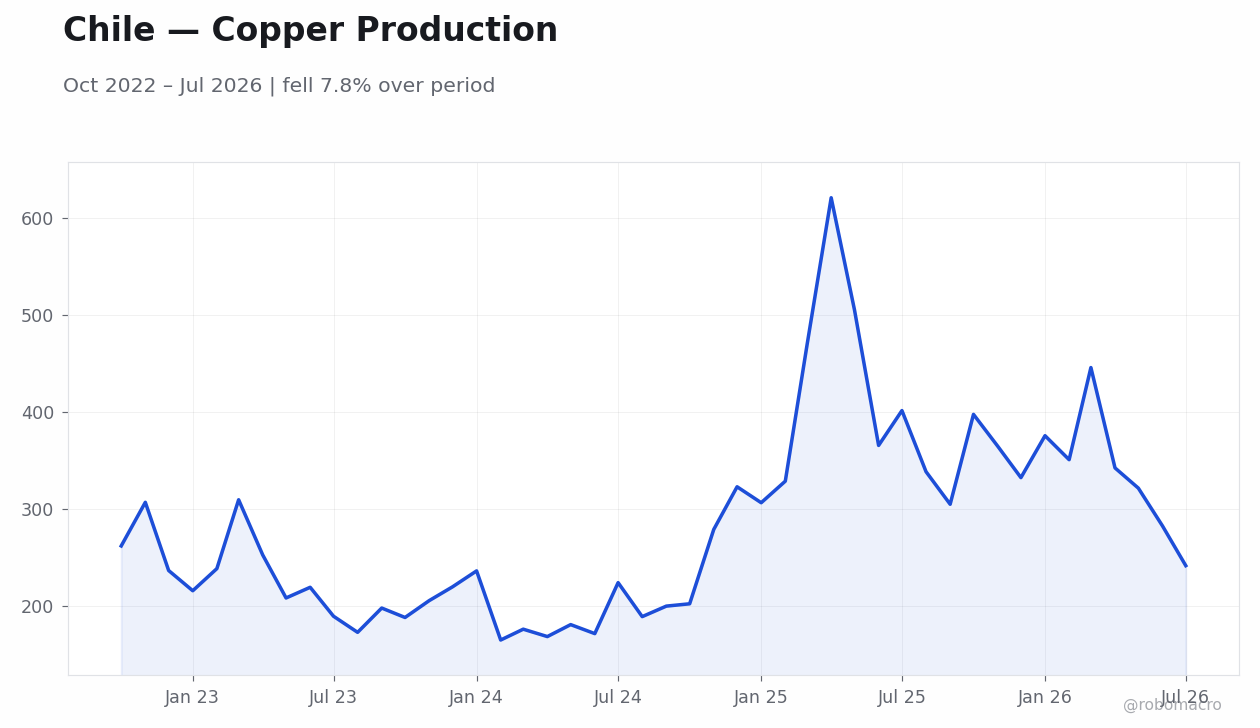
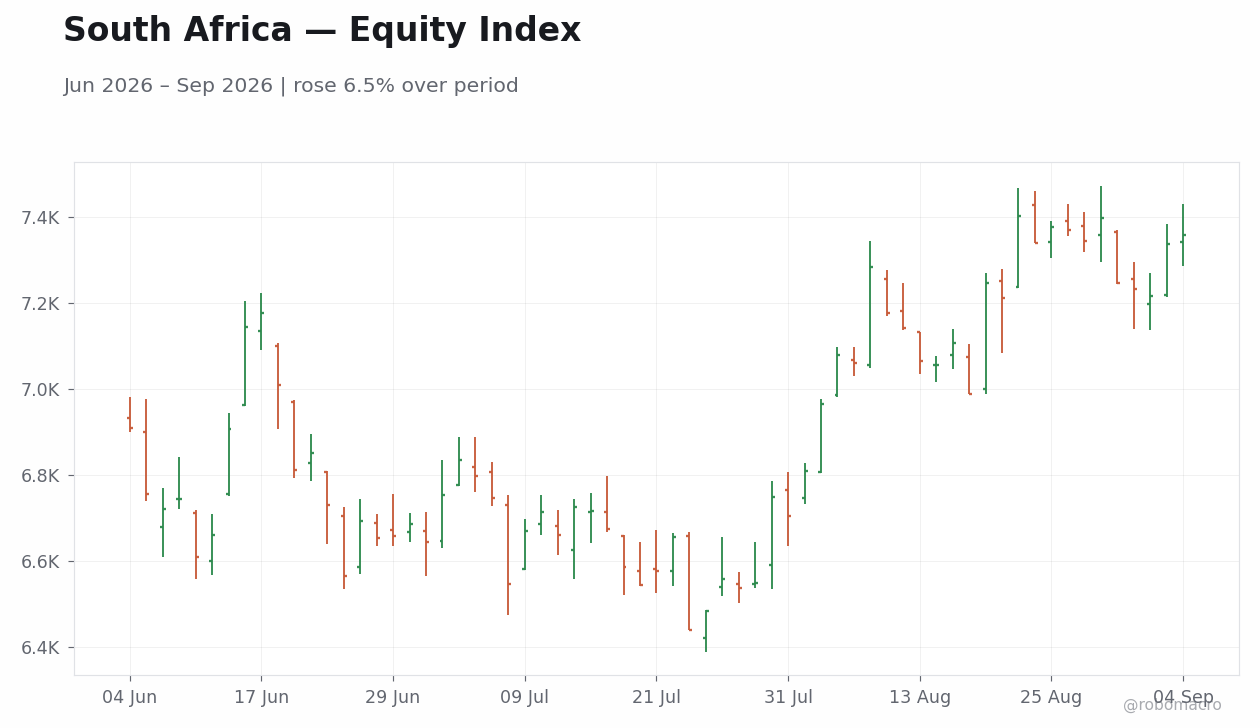
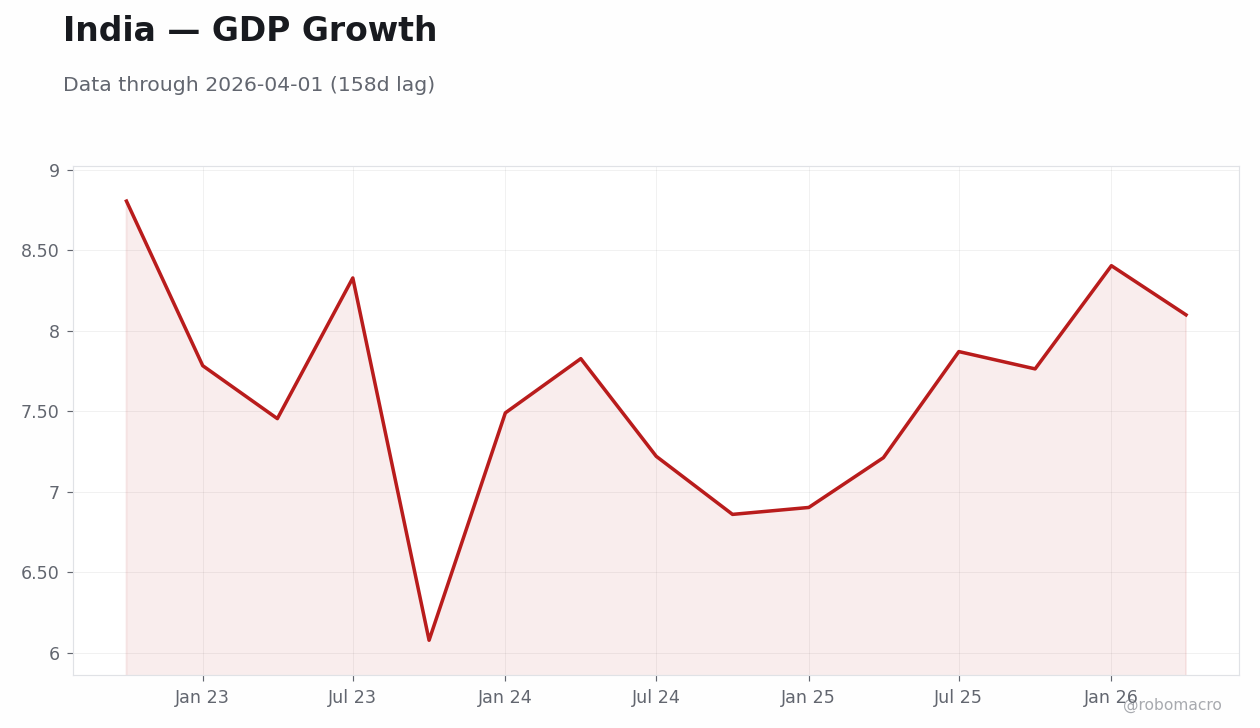
Emerging-market data flows split along commodity and domestic-demand lines. Brazil Q2 GDP expanded quarter-over-quarter, beating consensus though decelerating from the prior print, while Bovespa advanced 4.36 percent to 185147 and USD/BRL declined 1.28 percent to 5.12. Mexico business confidence improved modestly in August as the peso strengthened, with USD/MXN falling 0.92 percent to 16.87. South Africa’s August trade surplus widened amid firmer mineral exports, supporting the JSE Top 40 close at 109270.1, up 0.47 percent. India Q1 FY27 GDP growth beat consensus amid services and investment strength, while forex reserves reached a record high. Indonesia inflation and trade balance data surprised to the upside, yet Bank Negara Malaysia and Bank Indonesia left policy rates unchanged. Copper rose 1.35 percent to 6.68, driving selective equity gains in Chile and Peru.
Cross-Asset Theme: Higher Yields and Stronger Yen Reflect Energy-Driven Repricing
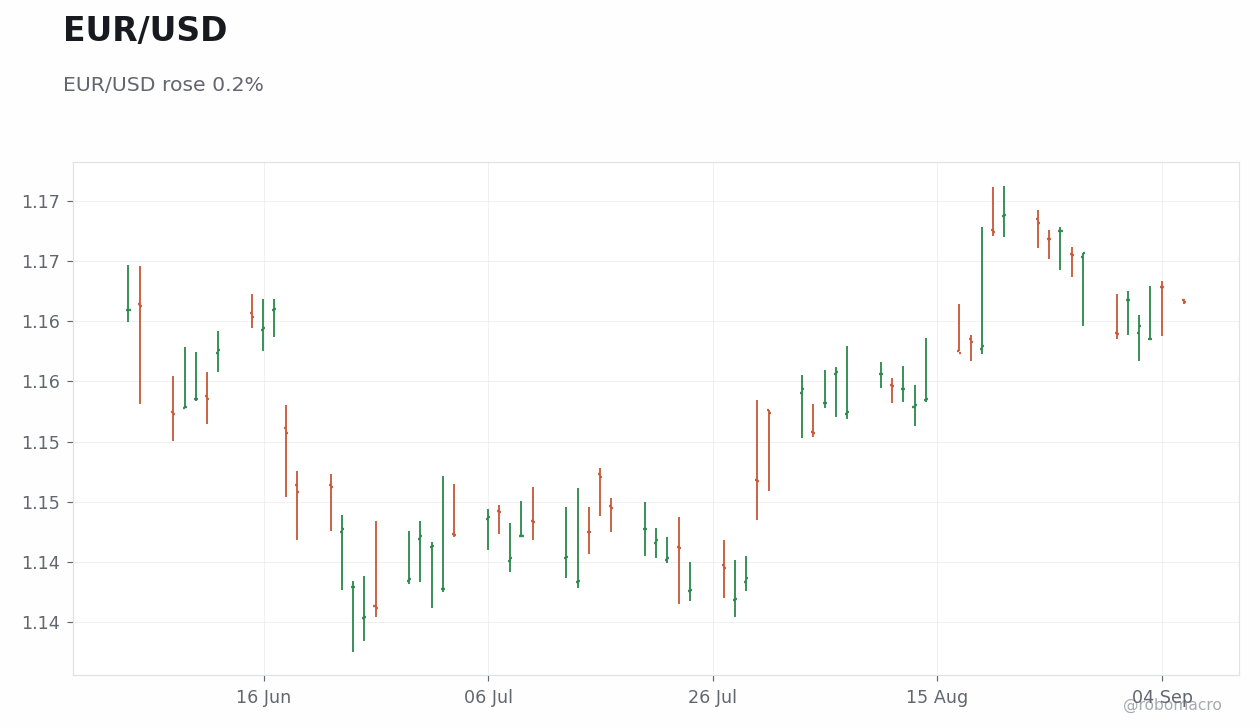
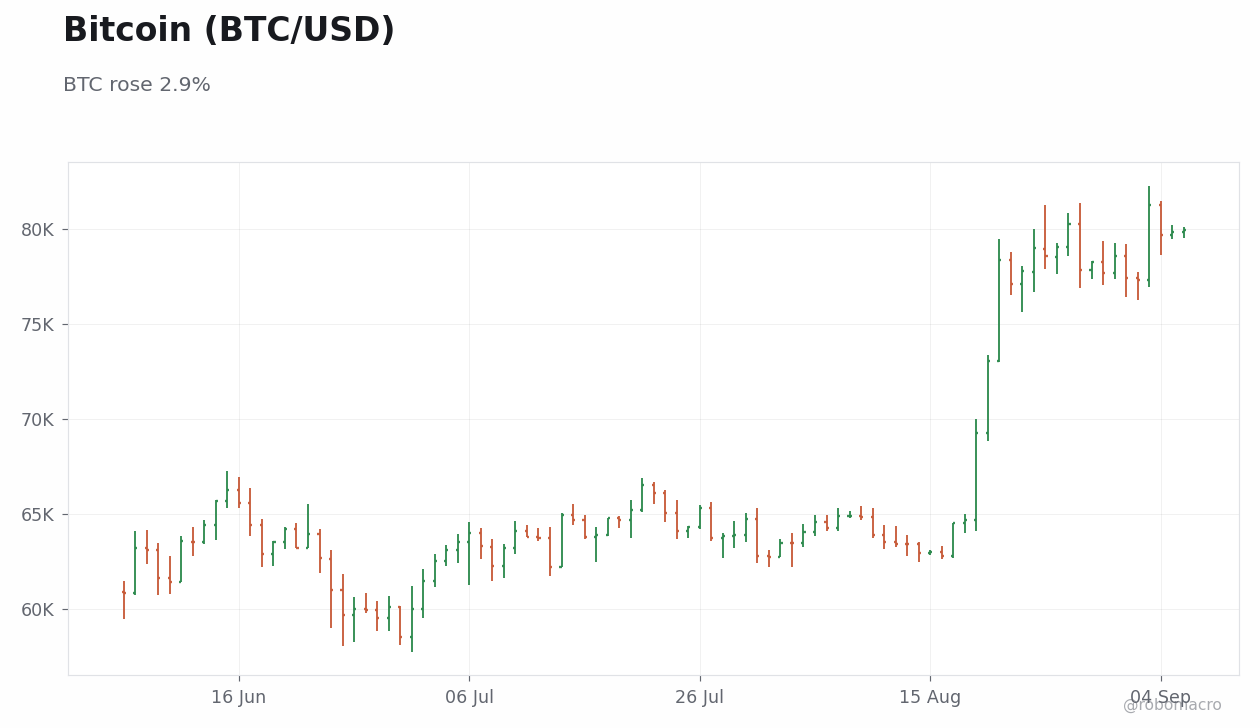
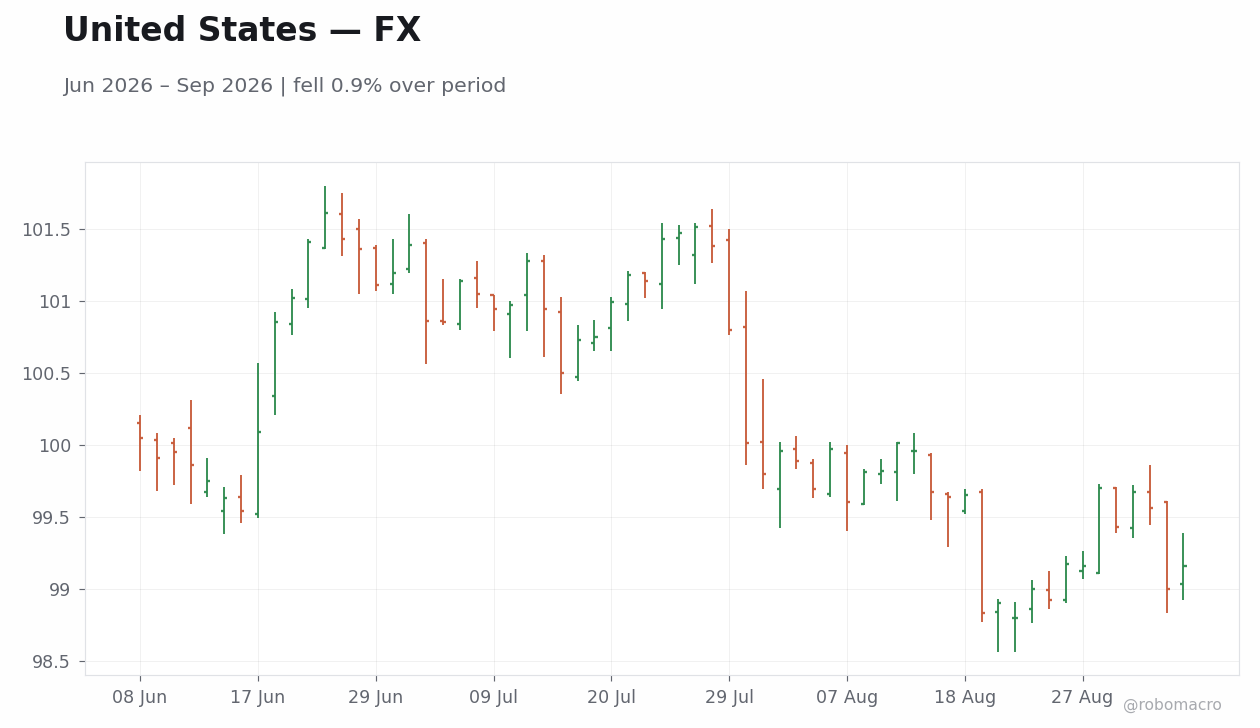
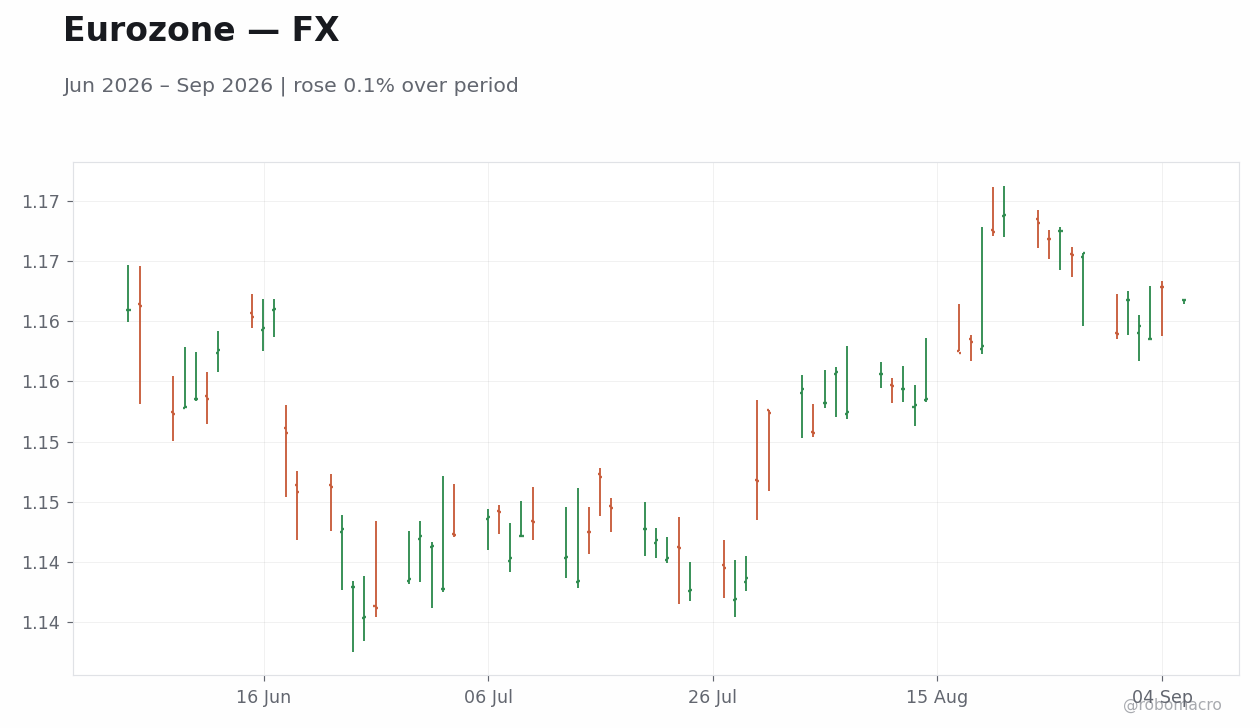
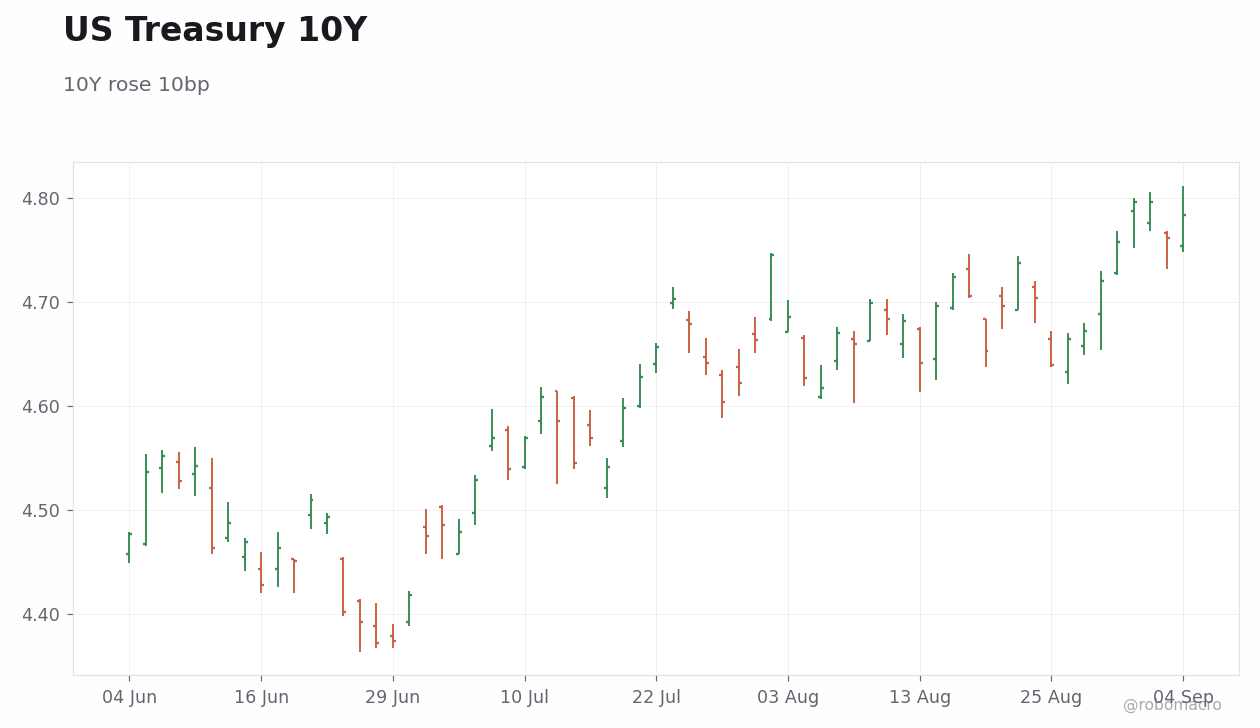
Cross-asset pricing reflected these divergences. The 10-year Treasury yield climbed 10 basis points while the 2-year yield rose 14 basis points. In the United Kingdom the 10-year gilt yield moved 7 basis points higher. German 10-year Bund yields rose 7 basis points. Equities posted modest net advances in the United States, with the S&P 500 closing at 7718.6, up 0.42 percent, while the Nasdaq 100 rose 0.30 percent to 29544.15. Euro Stoxx 50 and DAX declined 0.42 percent and 0.81 percent respectively. The yen’s 2.62 percent appreciation to 155.93 stood out as the largest weekly move, while EUR/USD edged 0.24 percent higher to 1.16. Gold advanced 1.03 percent to 4476.6. Bitcoin gained 2.90 percent to 79921.55. Brent crude’s 6.4 percent advance to 96.28 supported commodity-linked flows across Brazil, South Africa, and the Gulf Cooperation Council.
Policy Outlook: Data Dependence Remains the Common Anchor
Central banks across developed and emerging markets maintained unchanged forward guidance. Federal Reserve speakers reiterated that decisions rest solely on incoming figures. The ECB, BoJ, Bank of Canada, Banco Central do Brasil, and South African Reserve Bank all held parameters steady. Norges Bank shifted to net NOK sales in September amid oil-fund flows. Nordea revised its Riksbank call to include 25 basis point hikes in November and February 2027. The configuration leaves the global rate path on hold until subsequent inflation and employment prints alter the balance between activity and price risks.
Forward Look: Elections and Inflation Prints Shape Next Week’s Narrative
Next week opens with ADP Employment Change Weekly on September 8, followed by the Producer Price Index and core PPI on September 10. Core CPI and headline CPI print on September 11. Russian State Duma and Swedish general elections both occur on September 13, seven days from the end of the current week. A sustained state-led model in Russia would imply modest welfare expansions with limited structural reform, while a leftward shift in Sweden could raise taxes and welfare spending. These political outcomes will interact with September inflation releases to test whether the energy impulse sustains vigilance or allows further easing expectations.
| Economy | Real GDP (% y/y) | Consumer Prices (% y/y) | ||||
|---|---|---|---|---|---|---|
| 2026E | 2027E | 2028E | 2026E | 2027E | 2028E | |
| Americas | ||||||
| United States | 2.3 | 2.1 | 2.1 | 3.2 | 2.1 | 2.2 |
| Canada | 1.5 | 1.9 | 1.7 | 2.5 | 2.1 | 2.0 |
| Mexico | 1.6 | 2.2 | 2.1 | 3.9 | 3.4 | 3.0 |
| Brazil | 1.9 | 2.0 | 2.4 | 4.0 | 3.4 | 3.0 |
| Argentina | 3.5 | 4.0 | 3.8 | 30.4 | 15.7 | 9.6 |
| Colombia | 2.3 | 2.5 | 2.6 | 5.9 | 5.2 | 3.4 |
| Chile | 2.4 | 2.6 | 2.3 | 2.9 | 3.3 | 3.0 |
| Peru | 2.8 | 2.8 | 2.8 | 2.5 | 1.8 | 2.0 |
| Asia / Pacific | ||||||
| Japan | 0.7 | 0.6 | 0.6 | 2.2 | 2.3 | 2.0 |
| China | 4.4 | 4.0 | 4.0 | 1.2 | 1.5 | 1.8 |
| India | 6.5 | 6.5 | 6.5 | 4.7 | 4.0 | 4.0 |
| Australia | 2.0 | 1.7 | 1.9 | 4.0 | 3.2 | 2.6 |
| New Zealand | 2.1 | 2.4 | 2.4 | 3.1 | 2.3 | 2.1 |
| South Korea | 1.9 | 2.1 | 2.2 | 2.5 | 1.9 | 2.0 |
| Indonesia | 5.0 | 5.1 | 5.2 | 3.0 | 2.6 | 2.5 |
| Malaysia | 4.7 | 4.3 | 4.3 | 1.9 | 2.0 | 2.0 |
| Philippines | 4.1 | 5.8 | 6.1 | 4.3 | 3.2 | 3.0 |
| Singapore | 3.5 | 2.7 | 2.5 | 2.3 | 1.9 | 2.0 |
| Thailand | 1.5 | 2.1 | 2.3 | 0.9 | 1.0 | 1.2 |
| Taiwan | 5.2 | 3.0 | 2.4 | 1.5 | 1.6 | 1.6 |
| Vietnam | 7.1 | 6.7 | 6.2 | 4.9 | 4.6 | 3.7 |
| Western Europe | ||||||
| Euro area | 1.1 | 1.2 | 1.4 | 2.6 | 2.2 | 2.1 |
| Germany | 0.8 | 1.2 | 1.2 | 2.7 | 2.3 | 2.0 |
| France | 0.9 | 0.9 | 1.2 | 1.8 | 1.7 | 1.9 |
| Italy | 0.5 | 0.5 | 0.8 | 2.6 | 2.4 | 2.3 |
| Spain | 2.1 | 1.8 | 1.8 | 3.0 | 2.3 | 2.5 |
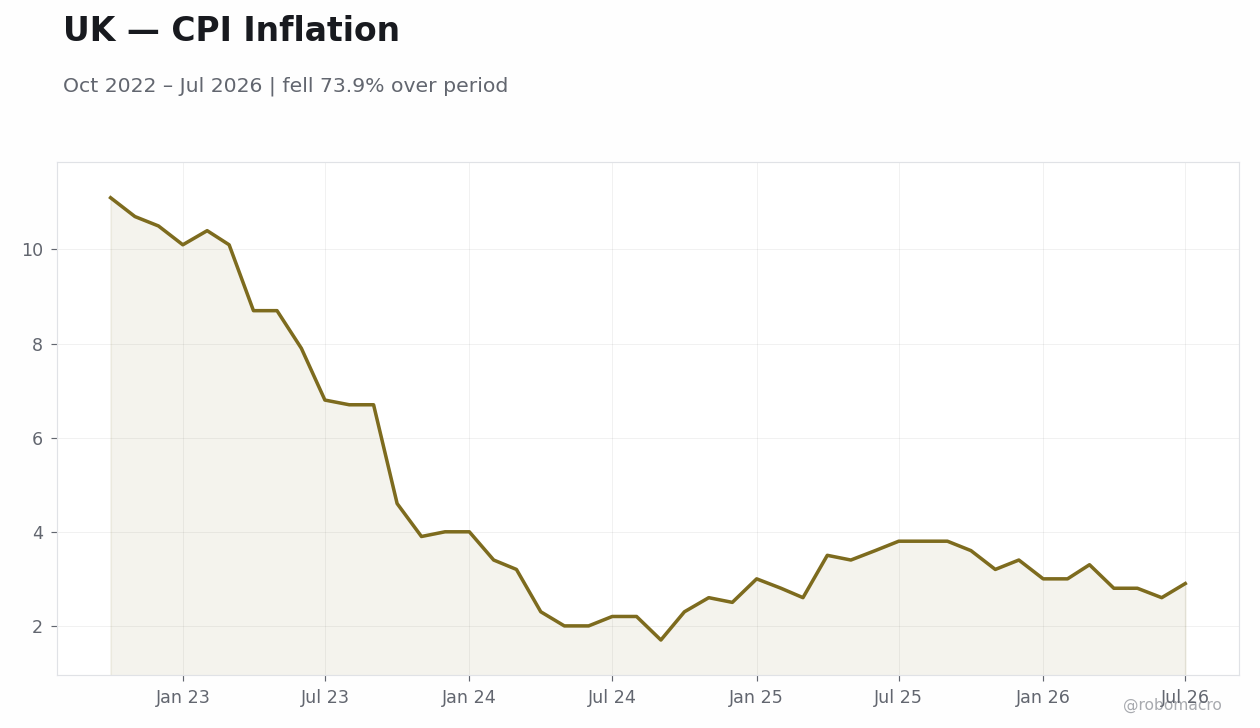
| United Kingdom | 0.8 | 1.3 | 1.6 | 3.2 | 2.4 | 2.0 |
| Sweden | 2.0 | 1.9 | 2.1 | 1.5 | 1.8 | 2.6 |
| Norway | 1.5 | 1.3 | 1.1 | 3.3 | 2.6 | 2.2 |
| Denmark | 2.0 | 1.6 | 1.6 | 2.0 | 2.2 | 2.2 |
| Switzerland | 1.3 | 1.3 | 1.8 | 0.5 | 0.5 | 0.6 |
| Netherlands | 1.2 | 1.4 | 1.4 | 2.7 | 2.4 | 2.3 |
| Poland | 3.3 | 2.4 | 2.6 | 3.3 | 3.3 | 3.9 |
| Czech Republic | 2.2 | 2.2 | 2.1 | 2.4 | 2.2 | 2.5 |
| Hungary | 1.7 | 2.0 | 2.3 | 3.8 | 3.5 | 3.1 |
| Romania | 0.7 | 2.5 | 2.7 | 7.8 | 3.9 | 4.3 |
| EMEA Emerging | ||||||
| Turkey | 3.4 | 3.5 | 3.8 | 28.6 | 21.4 | 17.0 |
| South Africa | 1.0 | 1.3 | 1.5 | 3.9 | 3.4 | 3.0 |
| Israel | 3.5 | 4.4 | 3.7 | 2.3 | 2.1 | 2.0 |
| Saudi Arabia | 3.1 | 4.5 | 3.6 | 2.3 | 2.1 | 2.0 |
| UAE | 3.1 | 5.3 | 4.6 | 2.5 | 2.0 | 2.0 |
| Egypt | 4.2 | 4.8 | 5.5 | 13.2 | 11.1 | 8.1 |
| Nigeria | 4.1 | 4.3 | 4.1 | 16.0 | 15.9 | 12.7 |
| Kenya | 4.5 | 4.7 | 5.1 | 5.9 | 5.9 | 5.7 |
| Global Aggregates | ||||||
| Global | 3.1 | 3.2 | 3.2 | 4.4 | 3.7 | 3.4 |
| Developed markets | 1.8 | 1.7 | 1.7 | 2.8 | 2.2 | 2.1 |
| Emerging markets | 3.9 | 4.2 | 4.2 | 5.5 | 4.6 | 4.1 |
| Central Bank | Instrument | Current Rate |
Last Change |
bp | Next Meeting |
Q1 2026 |
Q2 2026 |
Q3 2026 |
Q4 2026 |
|---|---|---|---|---|---|---|---|---|---|
| The Americas | |||||||||
| Federal Reserve | Fed funds upper | 3.75% | Dec 2025 | -25 | Sep 16 | 3.75 | 3.75 | — | — |
| Bank of Canada | O/N rate | 2.25% | Oct 2025 | -25 | Oct 28 | 2.25 | 2.25 | — | — |
| BCB (Brazil) | SELIC | 14.00% | Aug 2026 | -25 | Sep 16 | 14.75 | 14.25 | — | — |
| Banxico | O/N rate | 6.50% | May 2026 | -25 | Sep 24 | 6.75 | 6.50 | — | — |
| BCRA (Argentina) | Aggregates regime | — | Jul 2025 | — | — | — | — | — | — |
| BanRep (Colombia) | Repo | 12.00% | Jul 2026 | +75 | — | 10.25 | 11.25 | — | — |
| BCCh (Chile) | MPR | 4.50% | Dec 2025 | -25 | — | 4.50 | 4.50 | — | — |
| Europe / Africa | |||||||||
| ECB | Depo rate | 2.25% | Jun 2026 | +25 | Sep 10 | 2.00 | 2.25 | — | — |
| Bank of England | Bank rate | 3.75% | Dec 2025 | -25 | Sep 17 | 3.75 | 3.75 | — | — |
| Riksbank | Repo rate | 1.75% | Oct 2025 | -25 | Sep 24 | 1.75 | 1.75 | — | — |
| Norges Bank | Dep rate | 4.25% | May 2026 | +25 | Sep 24 | 4.00 | 4.25 | — | — |
| SNB | Policy rate | 0.00% | Jun 2025 | -25 | Sep 24 | 0.00 | 0.00 | — | — |
| CNB (Czech) | 2-wk repo | 3.75% | Jun 2026 | +25 | Sep 17 | 3.50 | 3.75 | — | — |
| NBH (Hungary) | Base rate | 5.50% | Aug 2026 | -25 | Sep 22 | 6.25 | 6.25 | — | — |
| NBP (Poland) | Ref rate | 3.75% | Mar 2026 | -25 | — | 3.75 | 3.75 | — | — |
| SARB | Repo rate | 7.00% | May 2026 | +25 | Sep 23 | 6.75 | 7.00 | — | — |
| CBRT (Turkey) | 1-wk repo | 37.00% | Jan 2026 | -100 | Sep 10 | 37.00 | 37.00 | — | — |
| Asia / Pacific | |||||||||
| RBA | Cash rate | 4.35% | May 2026 | +25 | Sep 29 | 4.10 | 4.35 | — | — |
| RBNZ | OCR | 2.50% | Jul 2026 | +25 | Oct 28 | 2.25 | 2.25 | — | — |
| BoJ | Pol rate | 1.00% | Jun 2026 | +25 | Sep 18 | 0.75 | 1.00 | — | — |
| PBoC | 1-yr LPR | 3.00% | May 2025 | -10 | — | 3.00 | 3.00 | — | — |
| RBI (India) | Repo rate | 5.25% | Dec 2025 | -25 | — | 5.25 | 5.25 | — | — |
| BoK (Korea) | Base rate | 2.75% | Jul 2026 | +25 | — | 2.50 | 2.50 | — | — |
| BI (Indonesia) | BI-Rate | 5.75% | Jun 2026 | +25 | Sep 23 | 4.75 | 5.75 | — | — |
| BSP (Philippines) | Rev repo | 5.00% | Aug 2026 | +25 | — | 4.25 | 4.75 | — | — |
| BoT (Thailand) | 1-day repo | 1.00% | Feb 2026 | -25 | Oct 28 | 1.00 | 1.00 | — | — |
| CBC (Taiwan) | Disc rate | 2.00% | Mar 2024 | +12.5 | Sep 17 | — | — | — | — |
| MAS (Singapore) | SGD NEER | Mild appr. | Apr 2026 | slope+ | Jul 27 | — | — | — | — |
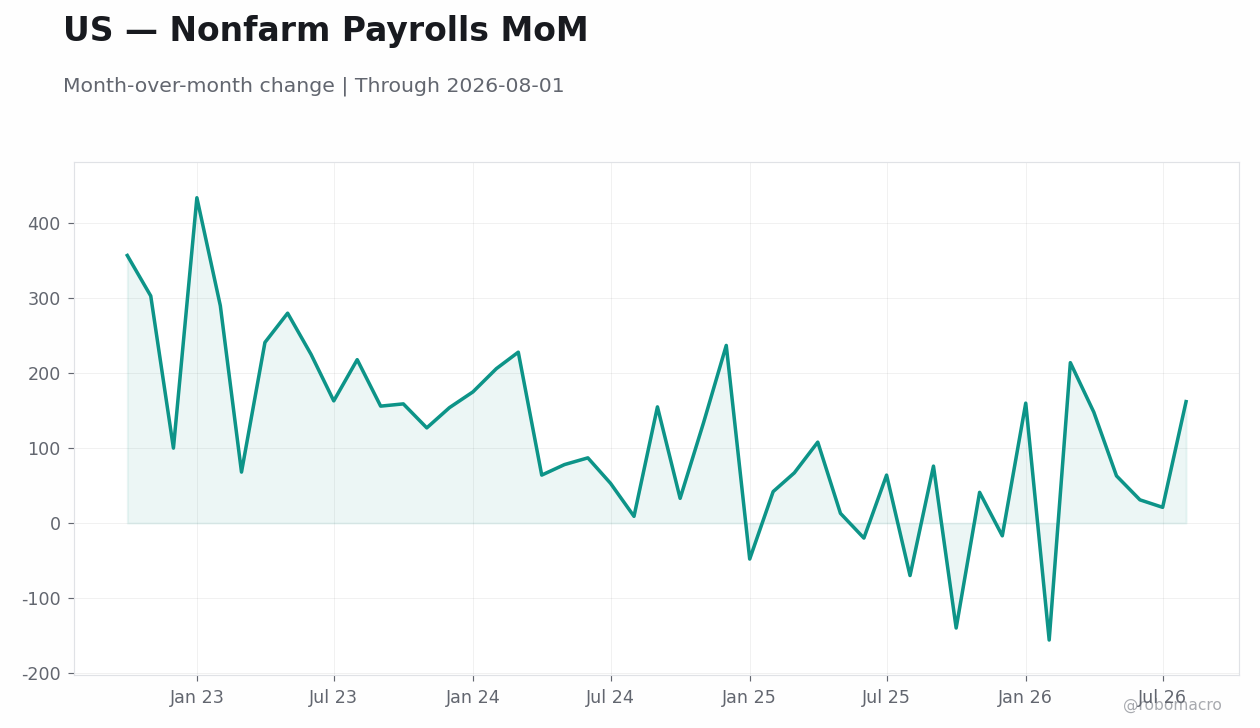
| Nonfarm Payrolls (m/m) | +96k | 80% CI +55k…+352k |
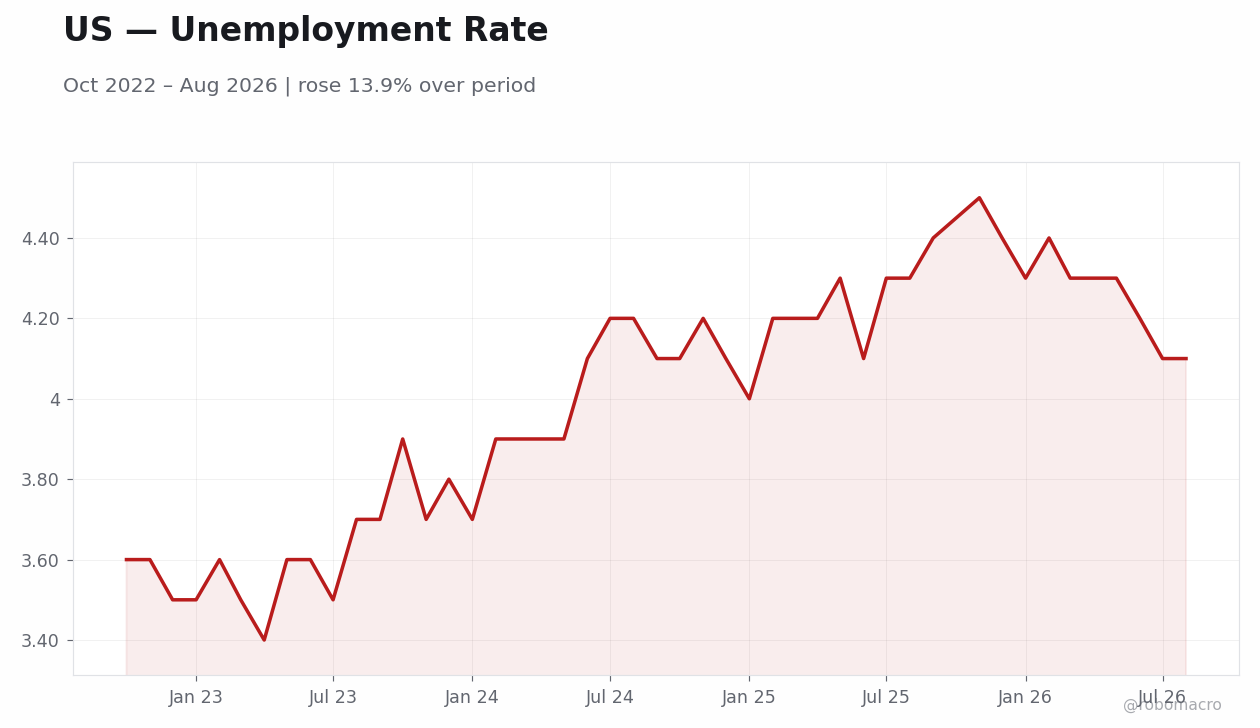
| Unemployment Rate | 4.1% | |
| Avg Hourly Earnings (y/y) | 3.3% |
| Economy | Activity Index | 4-wk Δ | 13-wk Δ | Week ending | Indicators | Signal |
|---|---|---|---|---|---|---|
| Japan | 67.9 | +2.3 | -6.4 | 2026-08-28 | 5/5 | Expanding · Advancing |
| Italy | 60.6 | -3.2 | +1.7 | 2026-08-28 | 5/5 | Expanding · Retreating |
| Brazil | 60.5 | +3.7 | +13.7 | 2026-09-04 | 3/4 | Expanding · Advancing |
| United States | 55.2 | +2.6 | -4.9 | 2026-08-28 | 7/7 | Expanding · Advancing |
| Australia | 52.3 | +10.7 | +6.7 | 2026-08-28 | 3/3 | Expanding · Advancing |
| Canada | 51.7 | -6.3 | -5.3 | 2026-08-28 | 6/8 | Expanding · Retreating |
| New Zealand | 48.1 | — | — | 2026-08-28 | 4/5 | Contracting |
| Poland | 47.8 | -1.5 | +3.0 | 2026-09-04 | 3/4 | Contracting · Retreating |
| Euro Area | 47.2 | -4.6 | -4.5 | 2026-08-28 | 5/5 | Contracting · Retreating |
| Germany | 45.4 | -1.8 | +4.6 | 2026-09-04 | 5/6 | Contracting · Retreating |
| Spain | 44.9 | -6.6 | -11.4 | 2026-08-28 | 5/5 | Contracting · Retreating |
| France | 44.2 | -6.2 | -6.9 | 2026-08-28 | 4/5 | Contracting · Retreating |
Activity remains in expansion in United States, Italy, Japan, Canada, Brazil, Australia; while high-frequency trackers point to sub-trend activity in Euro Area, Germany, France, Spain, New Zealand, Poland. On a 4-week basis, momentum is improving in United States, Japan, Brazil, Australia and cooling in Euro Area, Germany, France, Italy, Spain, Canada, Poland. RoboMacro's labor ensemble nowcasts the next US payrolls print at +96k.


Week in Review
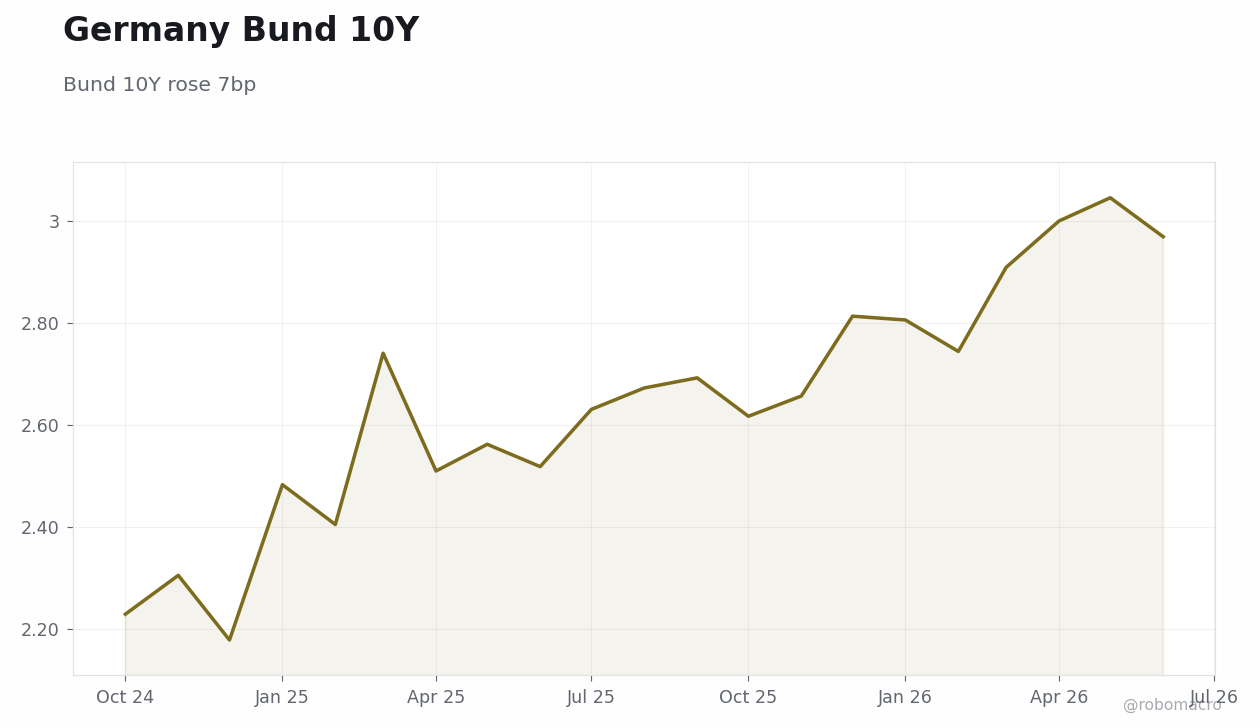
U.S. Treasury yields rose notably, with the 10-year climbing to 4.77% (+10bp). The 2-year reached 4.34% (+14bp) and the 30-year 5.25% (+6bp). Using daily closes, the U.S. 10-year yield moved from 4.7580 on Monday to 4.7960 on Tuesday, held at 4.7960 on Wednesday, fell to 4.7620 on Thursday and closed at 4.7840 on Friday. German 10-year Bund yields rose to 3.34% (+7bp), UK 10-year gilt yields increased to 5.14% (+7bp), and Japanese 10-year JGB yields declined to 2.91% (-2bp) with the 30-year falling to 3.97% (-16bp). Softer ISM Manufacturing PMI and ADP private payrolls reinforced factory-sector cooling and labor-market softening, while WTI crude strength accompanied the rise in yields.
Curve & Spreads
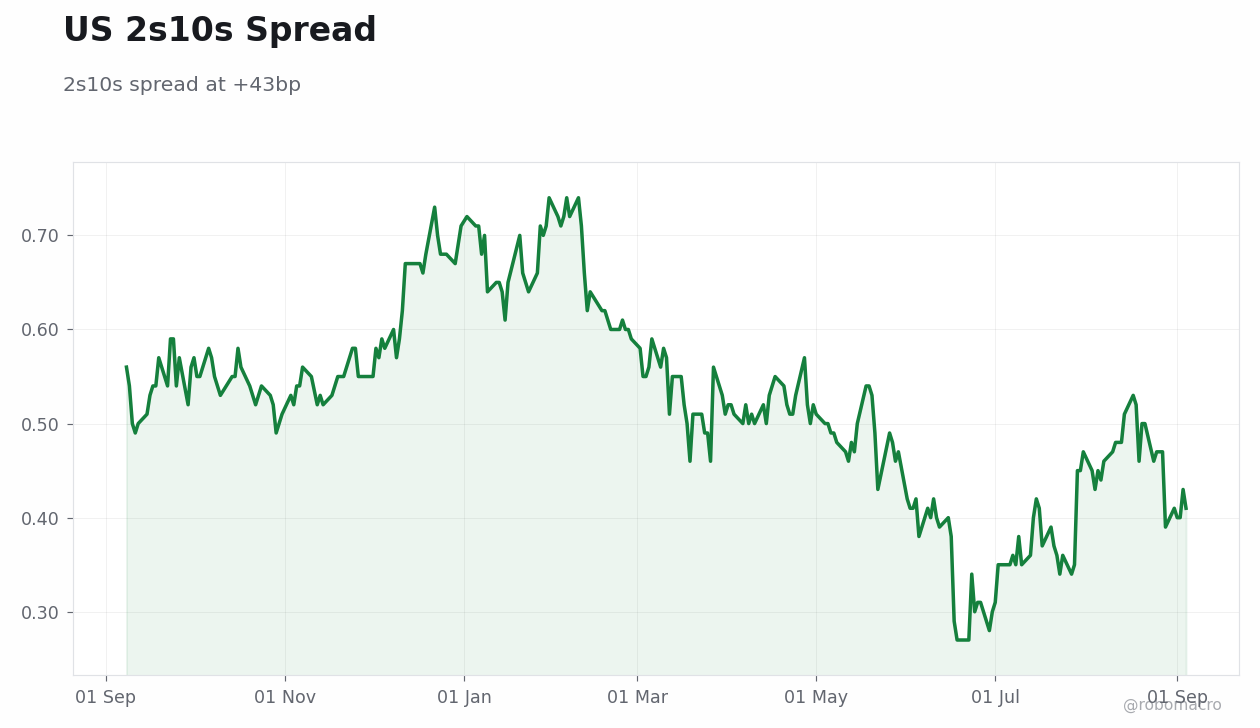
The U.S. 2s10s spread stands at +43bp, compared with +41bp in Germany and +72bp in the UK. The U.S. and German curves are modestly positively sloped while the UK curve is steeper. This shape across major DM markets implies expectations of moderate growth ahead rather than sharp deceleration. The configuration leaves room for gradual policy adjustment without signaling imminent recessionary pressure.
EM Bonds
Turkish 10-year yields stand at 34.37% while the 2-year is at 39.77% with 2s10s at -541bp. Brazilian 10-year yields are at 14.35%, South African 10-year at 8.70%, and Indonesian 10-year at 7.10%. Several EM curves moved lower on the week, though Turkey's yields moved significantly lower. These EM yield levels remain substantially higher than DM counterparts such as the U.S. 4.77% or German 3.34%, underscoring persistent risk premia and the spread differential between emerging and developed markets.
Central Bank Read
The U.S. 2s10s spread at +43bp, with the 2-year rising more than the 10-year, implies an easing bias consistent with softening manufacturing and labor data. German front-end yields rose 4bp while the 10-year rose 7bp, producing a +41bp 2s10s spread that similarly implies an easing bias. In Japan the 2-year rose 13bp to 1.83% while the 30-year fell 16bp, driving further steepening and reinforcing an easing bias. UK front-end yields were little changed while longer maturities rose, leaving the +72bp 2s10s spread to imply a modest easing bias. Central banks remain data-dependent, with yield moves reflecting gradual labor-market cooling and regional manufacturing divergence.
Week Ahead
U.S. inflation data will be the primary focus for duration risk given its potential to shift policy expectations. The ECB policy decision also matters for European duration. These releases matter most because they will test whether recent softening in ISM and ADP data alters the balance between inflation and activity risks. Any Treasury auctions will be watched for demand indications in the current higher-yield environment.
| Country | 2Y | 2Y WoW | 10Y | 10Y WoW | 30Y | 30Y WoW | 2s10s |
|---|---|---|---|---|---|---|---|
| United States | 4.34% | +14bp | 4.77% | +10bp | 5.25% | +6bp | +43bp |
| United Kingdom | 4.42% | +1bp | 5.14% | +7bp | 5.79% | +1bp | +72bp |
| Germany | 2.93% | +4bp | 3.34% | +7bp | 3.81% | +4bp | +41bp |
| France | 3.13% | +4bp | 4.21% | +9bp | 4.96% | +6bp | +107bp |
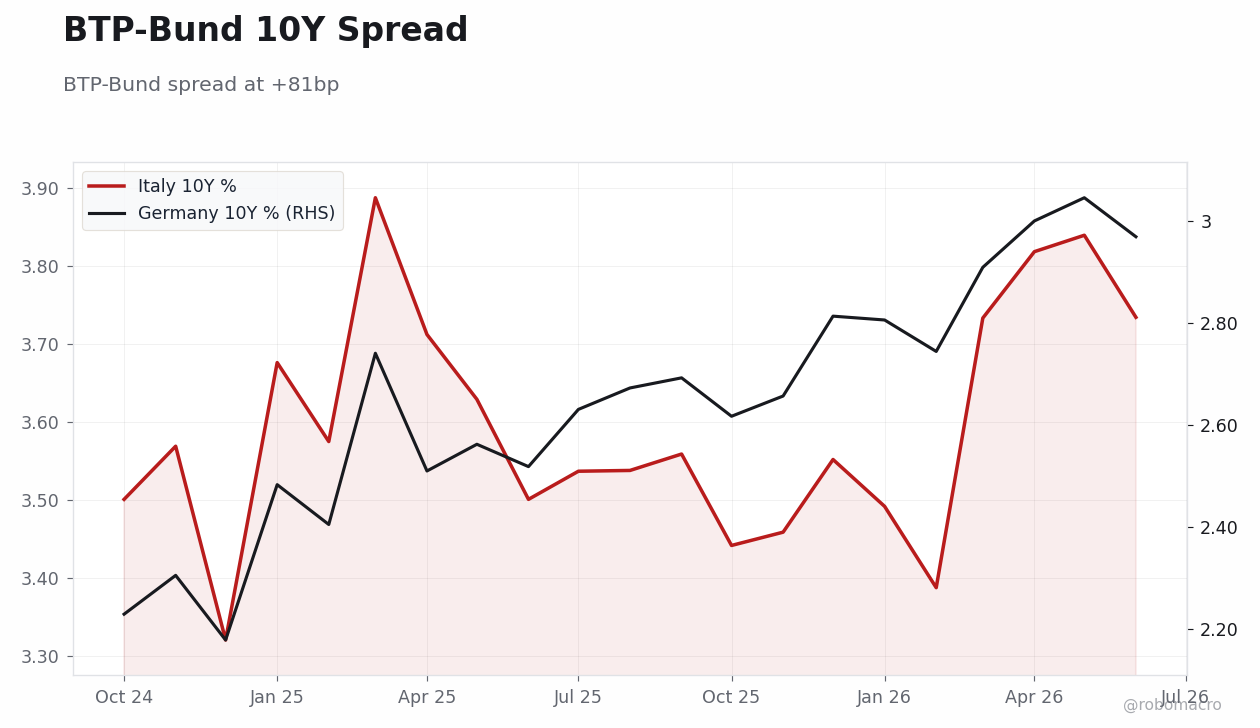
| Italy | 3.13% | +1bp | 4.15% | +3bp | 4.91% | +3bp | +102bp |
| Spain | 2.99% | +2bp | 3.77% | +4bp | 4.45% | +3bp | +78bp |
| Japan | 1.83% | +13bp | 2.91% | -2bp | 3.97% | -16bp | +108bp |
| Canada | 3.10% | +10bp | 3.78% | +5bp | 4.16% | +3bp | +68bp |
| Australia | 4.82% | +10bp | 5.20% | +11bp | 5.67% | +6bp | +38bp |
| China | 1.25% | -1bp | 1.68% | -2bp | 2.16% | -3bp | +43bp |
| India | 6.12% | +3bp | 6.97% | +6bp | 7.58% | +5bp | +85bp |
| Brazil | 13.85% | -25bp | 14.35% | -35bp | — | — | +50bp |
| Mexico | — | — | 9.27% | +6bp | — | — | — |
| South Korea | 3.71% | +2bp | 4.35% | +5bp | 4.63% | +10bp | +64bp |
| Indonesia | — | — | 7.10% | +10bp | 7.18% | +0bp | — |
| Turkey | 39.77% | -40bp | 34.37% | -16bp | — | — | -541bp |
| South Africa | — | — | 8.70% | +2bp | 9.12% | -4bp | — |
| Poland | — | — | 6.12% | +12bp | — | — | — |
US 2-year yields led advances, rising 14bp to 4.34%, while the 10-year climbed 10bp to 4.77%. Brazil posted the steepest declines, with 10-year yields falling 35bp to 14.35% and the 2-year dropping 25bp. Turkey’s 2-year yield eased 40bp to 39.77%. Japan’s curve steepened markedly, 2s10s widening 108bp as the 30-year yield fell 16bp to 3.97%. UK 10-year yields rose 7bp to 5.14%, matching Germany’s gain while France added 9bp to 4.21%. Australia’s 10-year increased 11bp to 5.20%, outpacing Canada, as China yields slipped across the curve. Italy and France recorded the widest 2s10s spreads at 102bp and 107bp.


Week in Review
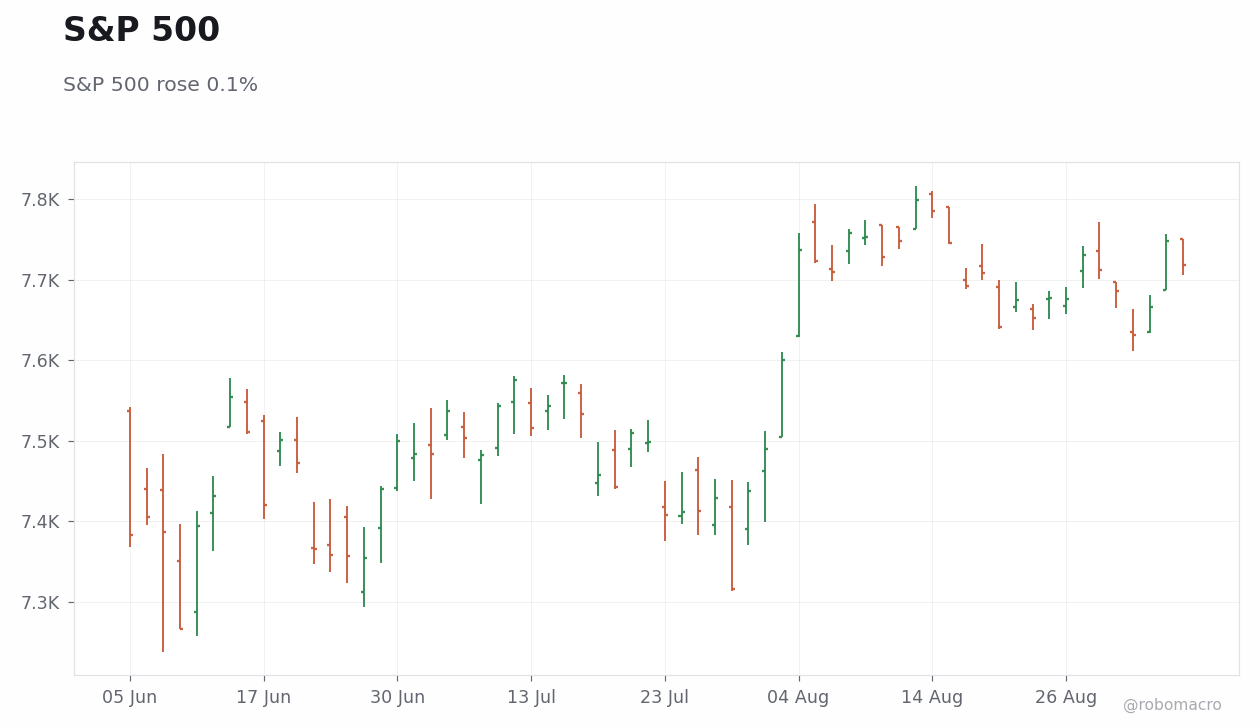
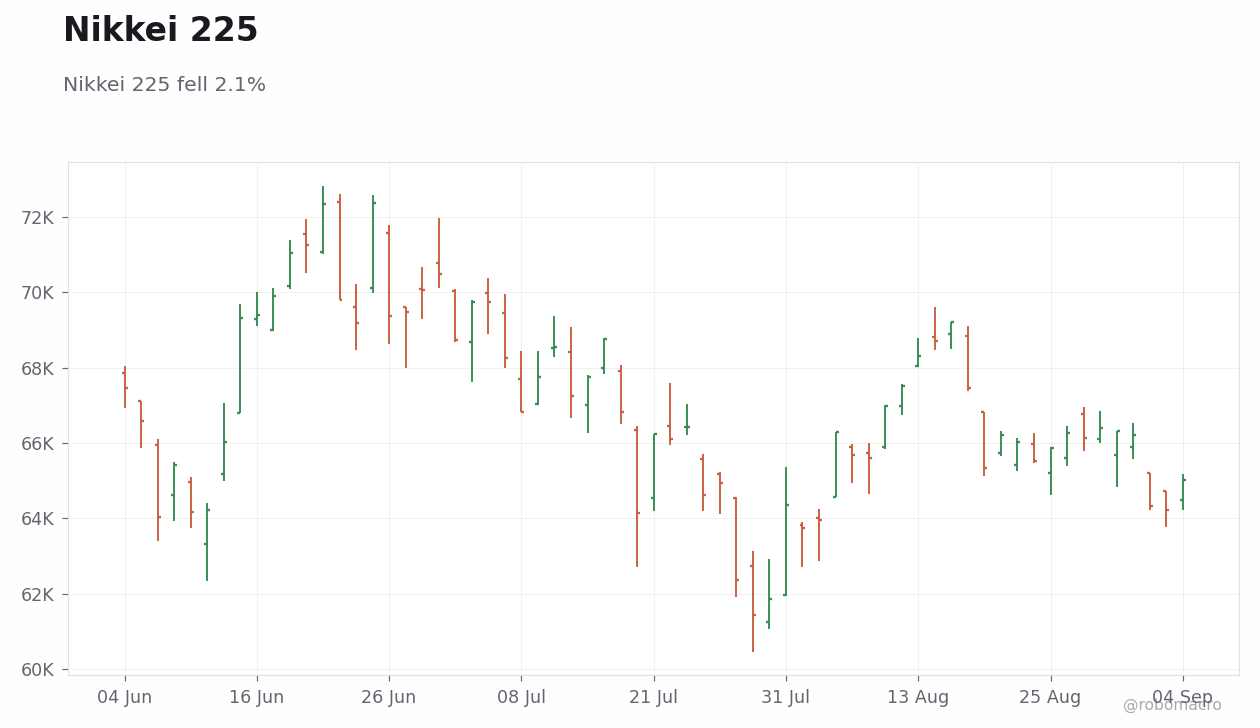
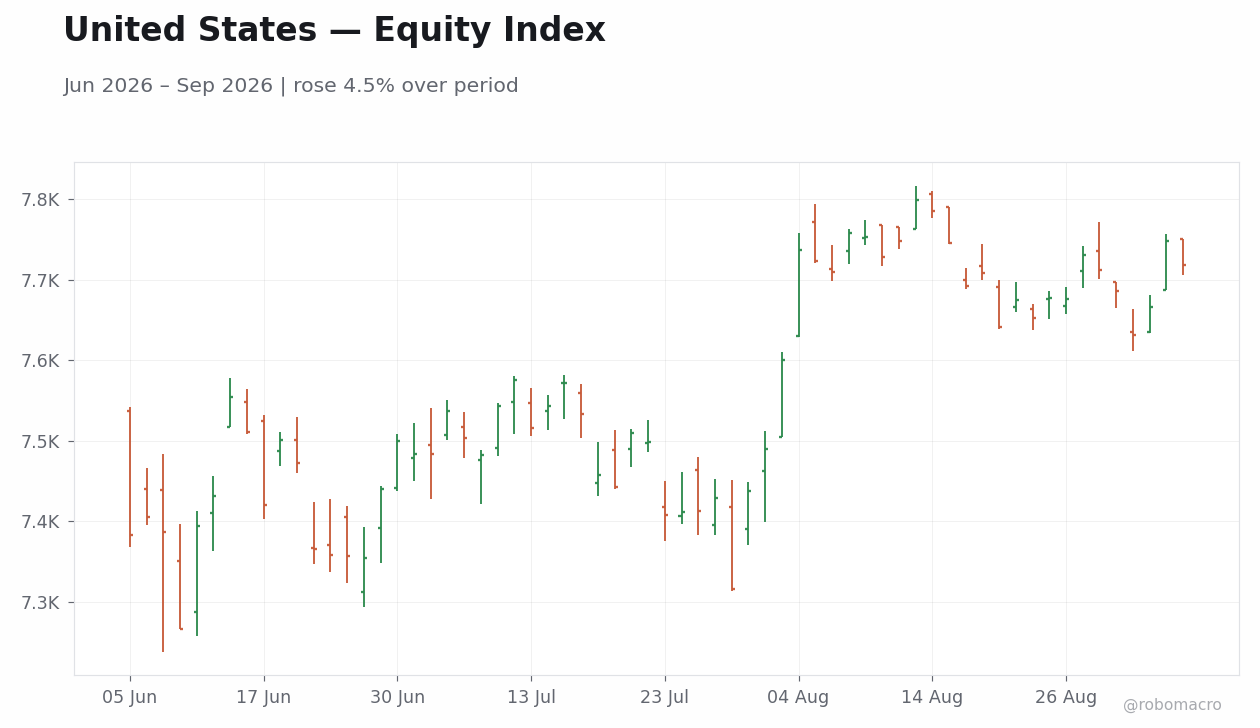
The S&P 500 rose 0.1% on the week to close at 7,719. Using daily closes, the index opened the week at 7,686 on Monday, fell to a low of 7,631 on Tuesday, recovered to 7,667 on Wednesday and 7,748 on Thursday before finishing at 7,719 on Friday. US equities were mixed, with the Nasdaq 100 gaining 0.4% to 29,544 while the Dow Jones fell 0.3% to 53,414 and the Russell 2000 rose 0.1% to 2,976. In Europe the Euro Stoxx 50 declined 1.4% to 6,393, with the DAX falling 2.0% and the CAC 40 dropping 1.5%. Asian indices showed further weakness as the Nikkei 225 fell 2.1% to 65,021, though the Hang Seng rose 0.3% to 25,651. Emerging markets diverged sharply, led by a 5.4% surge in the Ibovespa to 185,147.
Regional Divergences
US indices were essentially flat to modestly positive while European benchmarks underperformed with weekly declines ranging from 1.0% to 2.0%. Asian performance was similarly uneven, with sharp losses in the Nikkei 225 contrasting with small gains in the Hang Seng. Emerging market equities stood out, led by the Ibovespa's 5.4% advance. These regional divergences aligned with US data showing manufacturing momentum fading, as the ISM Manufacturing PMI missed consensus and ADP private payrolls rose less than expected, reinforcing labor-market softening. Offsetting regional resilience appeared in the Dallas Fed Manufacturing Index, which rose sharply and highlighted uneven factory conditions across districts.
Volatility & Risk Appetite
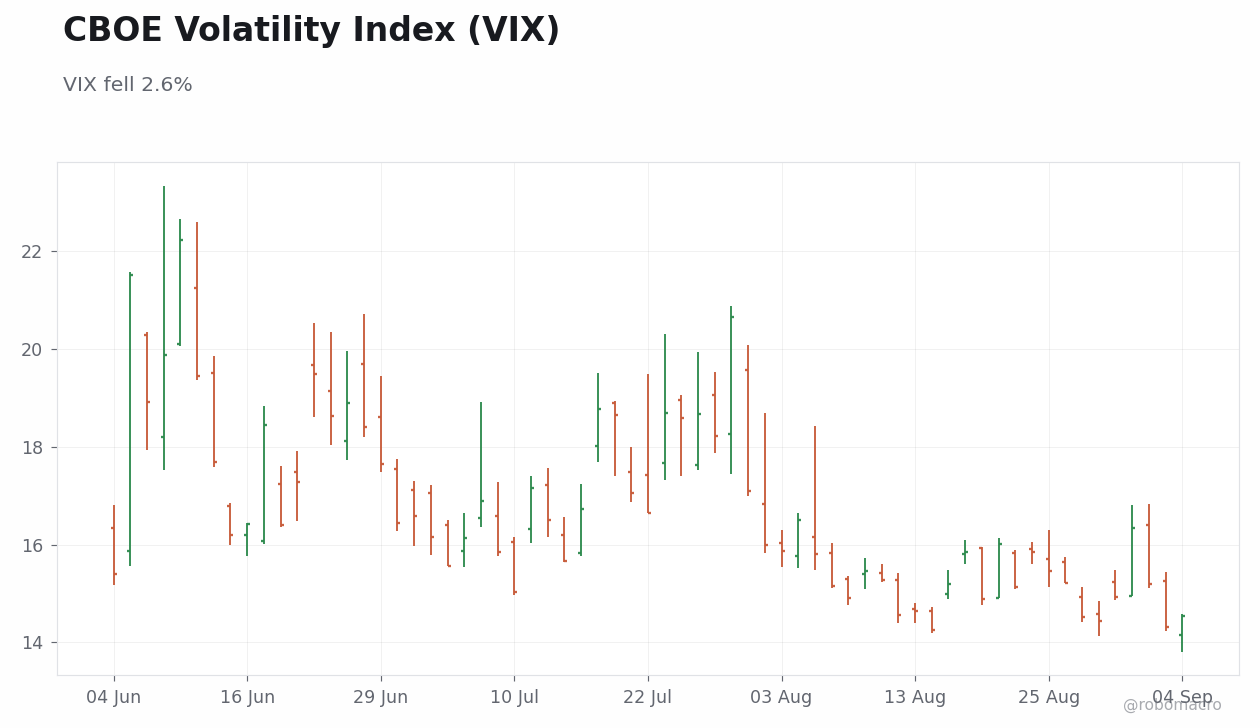
The VIX closed the week at 14.5 after reaching 16.3 on Tuesday and easing through the balance of the period. Growth outperformed value as the Nasdaq 100 rose 0.4% compared with the Dow Jones decline of 0.3%. Small versus large performance was closely aligned, with the Russell 2000 and S&P 500 both rising 0.1%. Commodity strength provided sector signals, led by WTI Crude rising 9.7% and Brent Crude rising 7.8%, pointing to upward pressure in energy while copper rose 1.8%. Gold was unchanged at 0.0% on the week. Overall risk appetite held steady amid the mixed equity moves and energy-led commodity gains.
Week Ahead
Next week the U.S. CPI release and ECB meeting will be the primary focus for global equity investors. A hot CPI print would favor risk-off positioning by raising inflation concerns, while softer figures could support risk-on sentiment. PMI releases across major economies will offer further insight into whether manufacturing cooling is broadening. These events pose the biggest risk to equity markets given their potential to shift views on the inflation and policy outlook.
| Index | Level | WoW | MTD | YTD |
|---|---|---|---|---|
| S&P 500 | 7,719 | +0.1% | +1.1% | +12.5% |
| Nasdaq 100 | 29,544 | +0.4% | +1.6% | +17.2% |
| Dow Jones | 53,414 | -0.3% | +1.2% | +10.4% |
| Russell 2000 | 2,976 | +0.1% | +1.9% | +18.6% |
| S&P/TSX | 36,514 | -0.1% | +1.9% | +14.5% |
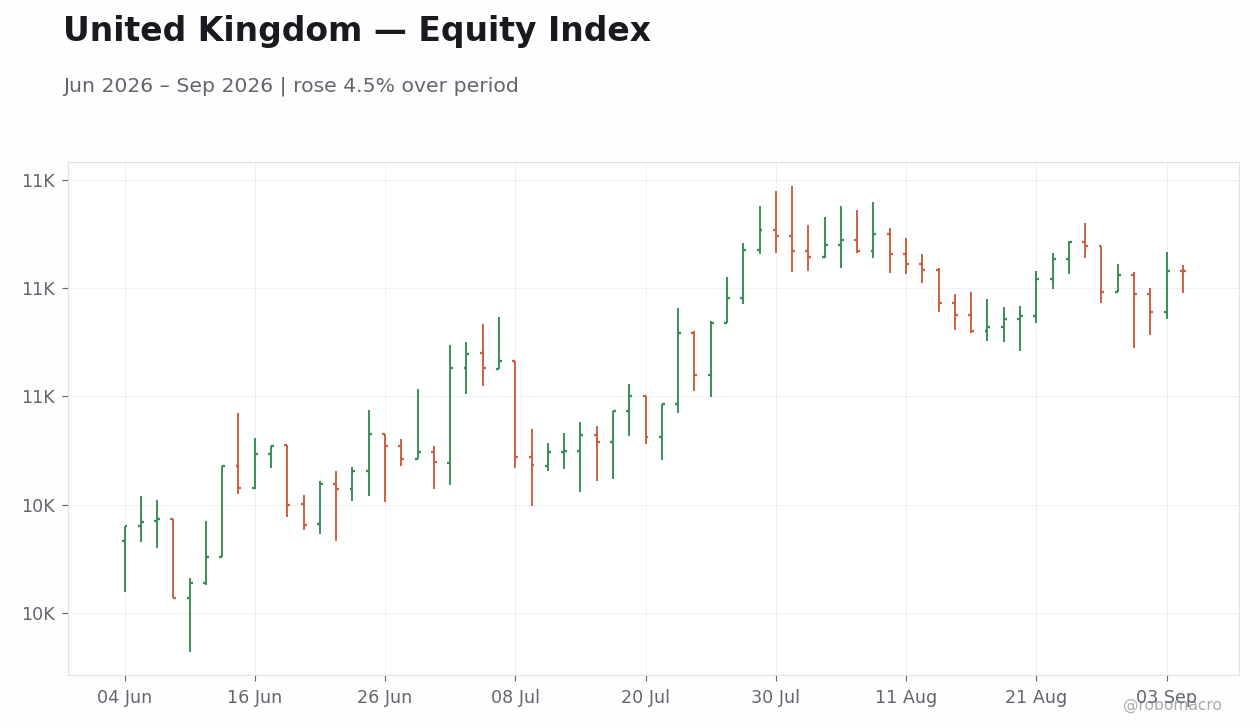
| FTSE 100 | 10,831 | +0.1% | +0.4% | +8.8% |
| Euro Stoxx 50 | 6,393 | -1.4% | +0.4% | +7.9% |
| DAX | 26,046 | -2.0% | +0.3% | +6.1% |
| CAC 40 | 8,279 | -1.5% | -0.3% | +1.0% |
| FTSE MIB | 52,100 | -1.0% | +0.4% | +14.8% |
| IBEX 35 | 20,051 | +0.0% | +1.1% | +14.6% |
| Nikkei 225 | 65,021 | -2.1% | -1.8% | +25.4% |
| Hang Seng | 25,651 | +0.3% | +1.3% | -2.6% |
| S&P/ASX 200 | 9,006 | -0.9% | -0.7% | +3.2% |
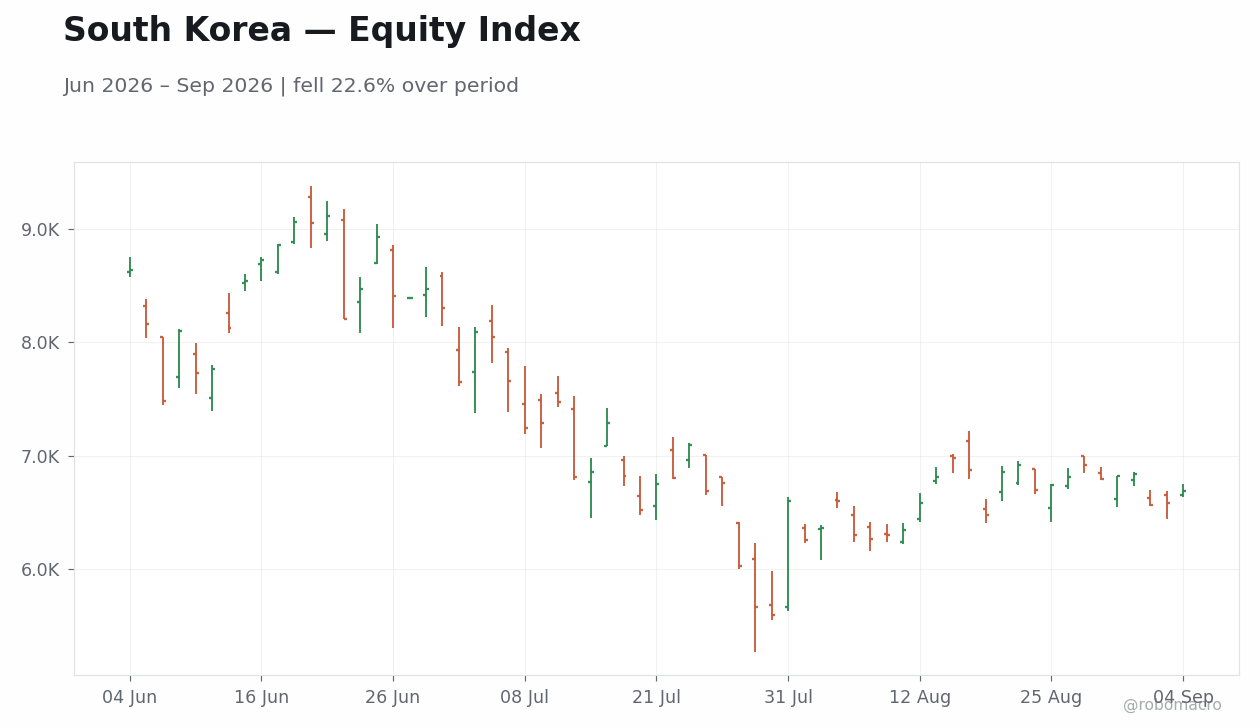
| KOSPI | 6,687 | -1.5% | -2.2% | +55.2% |
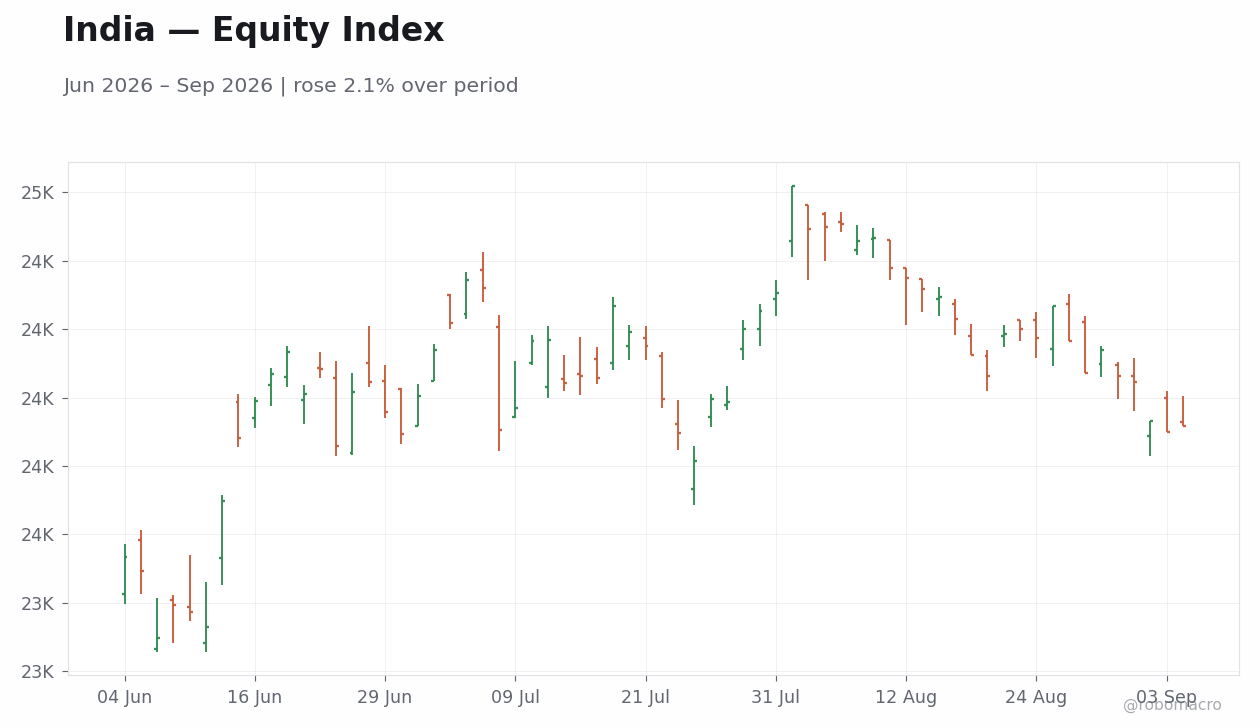
| Nifty 50 | 23,898 | -1.1% | -0.7% | -8.6% |
| Ibovespa | 185,147 | +5.4% | +3.0% | +15.3% |
| IPC Mexico | 64,867 | -0.9% | +0.6% | +1.1% |
| JSE Top 40 | 109,270 | -1.3% | +0.8% | +1.0% |
US benchmarks ended narrowly mixed as the Nasdaq 100 rose 0.4% while the Dow Jones slipped 0.3%. European bourses declined with the DAX falling 2.0% and the Euro Stoxx 50 off 1.4%. In Asia, the Nikkei 225 dropped 2.1% while the Hang Seng added 0.3%. Brazil’s Ibovespa led gains with a 5.4% advance. Small-cap outperformance continued as the Russell 2000 gained 0.1% alongside the S&P 500’s +0.1% print. Divergences widened between resilient US indices and softer European and Japanese markets. Year-to-date, the KOSPI maintained a 55.2% advance despite the weekly retreat. Next week, focus remains on sustaining MTD gains seen across most indices.
| Index | WoW | MTD | YTD |
|---|---|---|---|
| S&P 500 | +0.1% | +1.1% | +12.5% |
| Nasdaq 100 | +0.4% | +1.6% | +17.2% |
| Dow Jones | -0.3% | +1.2% | +10.4% |
| Russell 2000 | +0.1% | +1.9% | +18.6% |
| S&P/TSX | -0.1% | +1.9% | +14.5% |
| FTSE 100 | +0.1% | +0.4% | +8.8% |
| Euro Stoxx 50 | -1.4% | +0.4% | +7.9% |
| DAX | -2.0% | +0.3% | +6.1% |
| CAC 40 | -1.5% | -0.3% | +1.0% |
| FTSE MIB | -1.0% | +0.4% | +14.8% |
| IBEX 35 | +0.0% | +1.1% | +14.6% |
| Nikkei 225 | -2.1% | -1.8% | +25.4% |
| Hang Seng | +0.3% | +1.3% | -2.6% |
| S&P/ASX 200 | -0.9% | -0.7% | +3.2% |
| KOSPI | -1.5% | -2.2% | +55.2% |
| Nifty 50 | -1.1% | -0.7% | -8.6% |
| Ibovespa | +5.4% | +3.0% | +15.3% |
| IPC Mexico | -0.9% | +0.6% | +1.1% |
| JSE Top 40 | -1.3% | +0.8% | +1.0% |


Week in Review
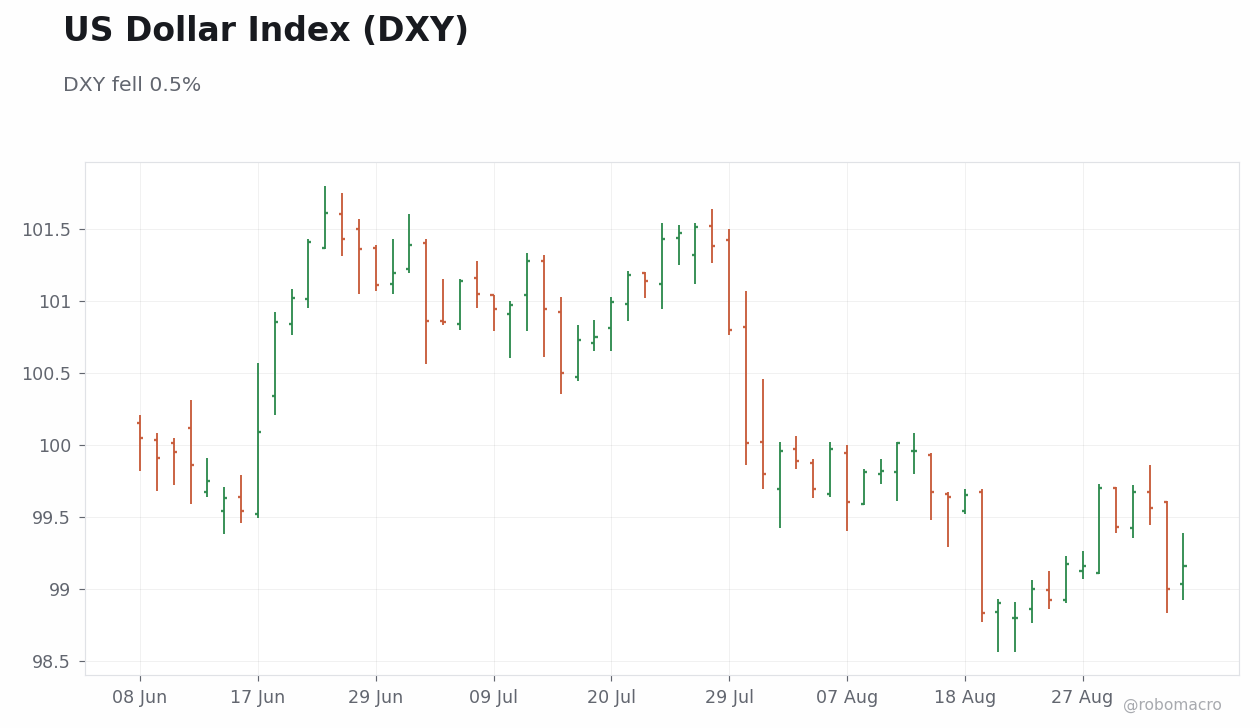
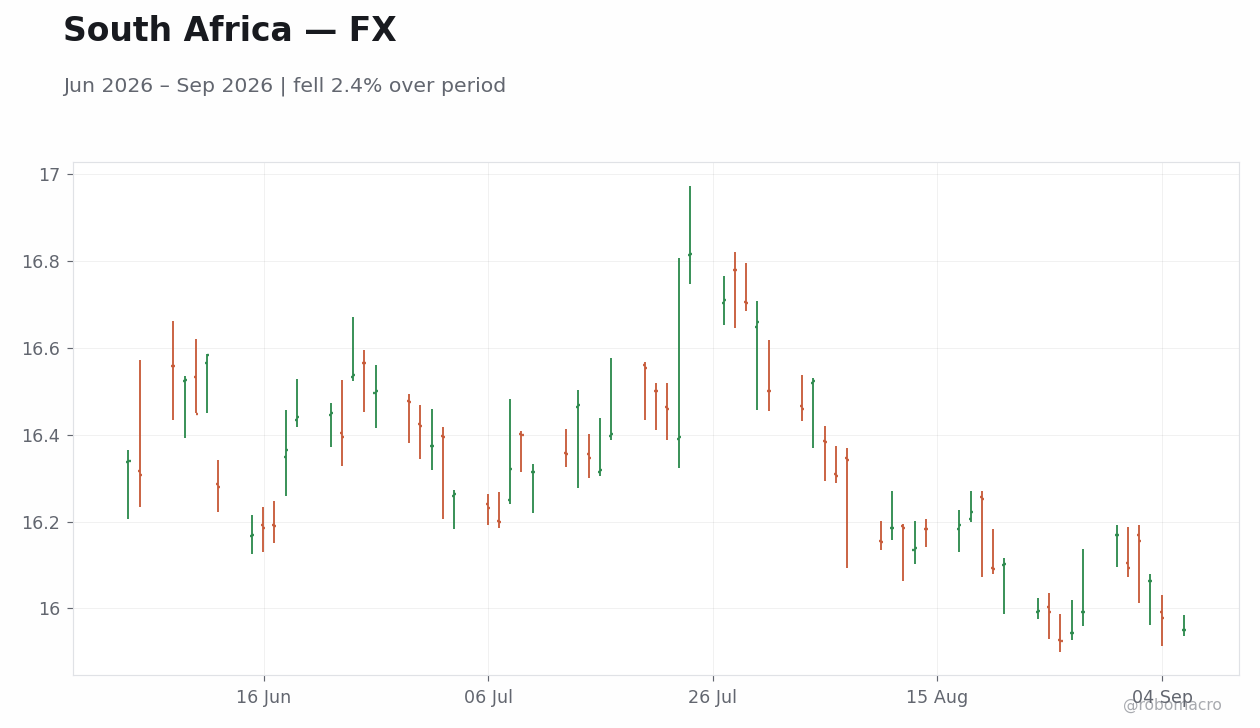
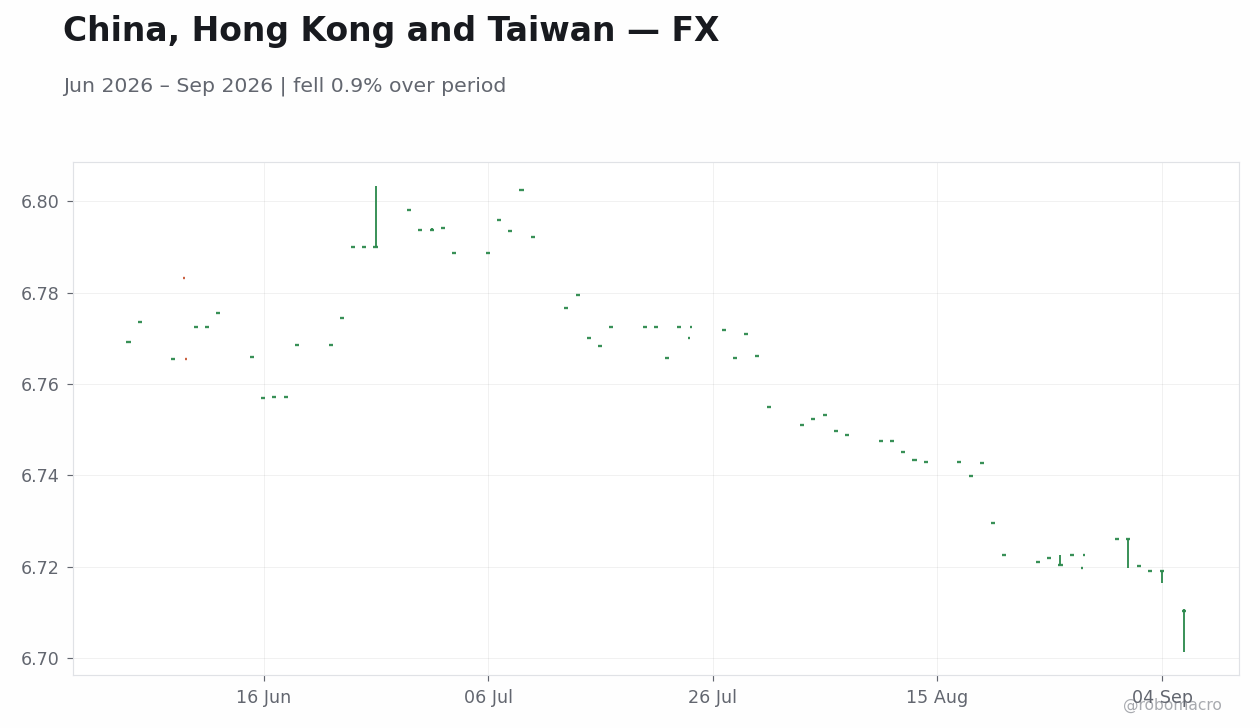
The DXY fell 0.5% on the week to 99.16. The index weakened steadily through mid-week, declining from 99.7 on Tuesday to 99.0 on Thursday before a modest rebound to 99.2 on Friday. In G10 currencies, EUR/USD rose 0.2% to 1.1618, GBP/USD declined 0.2% to 1.3518, and USD/JPY dropped 2.6% to 155.91 after holding at 160 from Monday through Wednesday before falling to 156 on Friday. AUD/USD rose 0.5% to 0.7202 while NZD/USD fell 0.6% to 0.5882. In EM FX, USD/BRL fell 1.3% to 5.1249, USD/MXN declined 0.9% to 16.87, USD/ZAR dropped 1.4% to 15.95, USD/CNY eased 0.2% to 6.7103, and USD/TRY rose 0.3% to 48.41.
Dollar & G10
U.S. rate differentials widened against several European curves while narrowing versus Japan, supporting selective dollar resilience even as the DXY posted a modest net decline. This configuration aligned with broader themes of gradual labor-market cooling and regional manufacturing divergence that left policy expectations data-dependent. EUR/USD closed the week at 1.1618 after a 0.2% gain, trading between a low of 1.1585 on Thursday and 1.1628 on Friday. GBP/USD ended at 1.3518, lower by 0.2% on the week. USD/JPY weakened sharply by 2.6% to 155.91, consistent with the yen posting its strongest weekly gain of the period.
EM FX
EM currencies generally strengthened against the dollar, led by declines in USD/BRL, USD/MXN, and USD/ZAR. USD/BRL fell 1.3% to 5.1249 and USD/MXN eased 0.9% to 16.87, supported by falling local bond yields relative to U.S. rates and firmer commodity prices. USD/ZAR dropped 1.4% to 15.95 while USD/CNY declined 0.2% to 6.7103, reflecting similar yield-differential dynamics across select EM markets. USD/TRY bucked the trend, rising 0.3% to 48.41 amid divergent local yield moves that widened its curve inversion.
Bitcoin & Crypto
Bitcoin rose 2.9% on the week to $79,946. The cryptocurrency climbed from 77,300 on Wednesday to 81,272 on Thursday before settling near 79,824 on Saturday, illustrating typical intra-week volatility around broader risk sentiment. Ethereum gained 3.2% to $2,496, outperforming the dollar’s modest decline. Solana advanced 3.7% to 106 and XRP rose 4.3% to 1, underscoring broad-based strength across major digital assets even as equity indices showed only marginal net gains.
Week Ahead
A light economic calendar limits fresh catalysts, leaving FX markets sensitive to any further signals on labor-market softening and manufacturing trends that keep policy expectations data-dependent. Central bank rate decisions, where scheduled, will be watched for direct impact on rate differentials and currency volatility. CPI and trade balance data in major economies could influence EM FX through their effect on yield differentials and commodity-linked flows. In digital assets, participants will monitor any regulatory announcements or protocol developments for potential shifts in risk positioning.


Week in Review
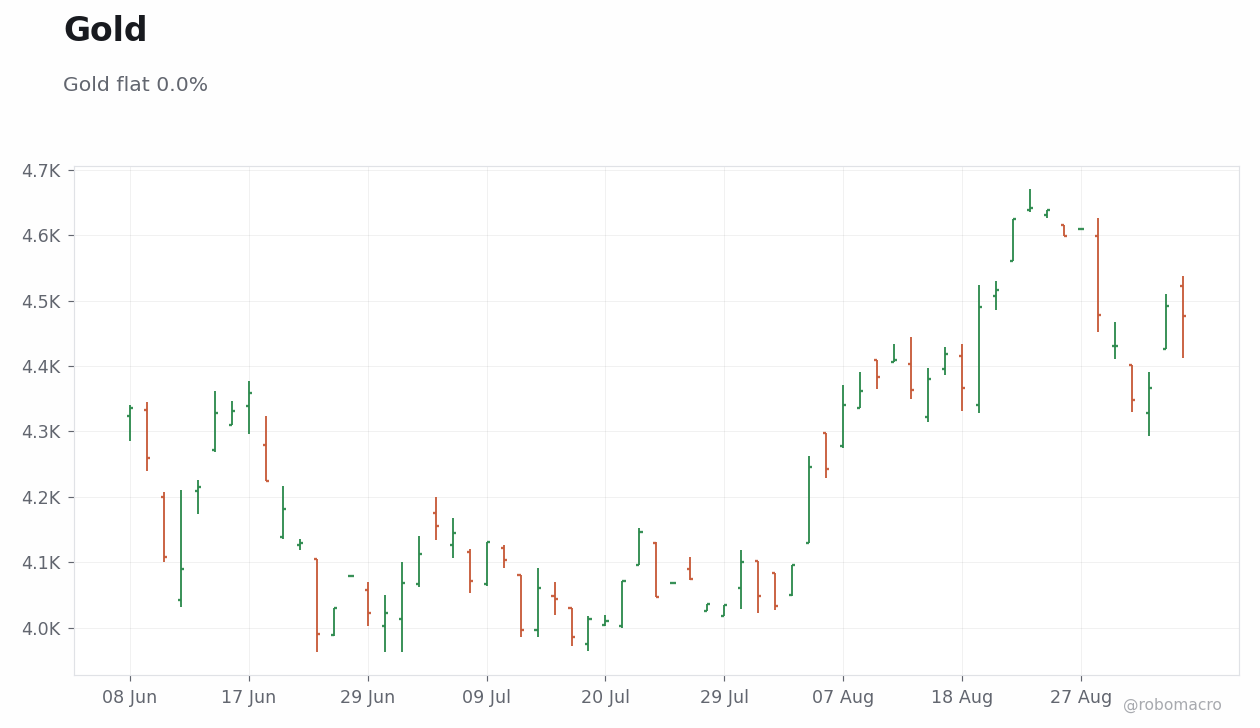
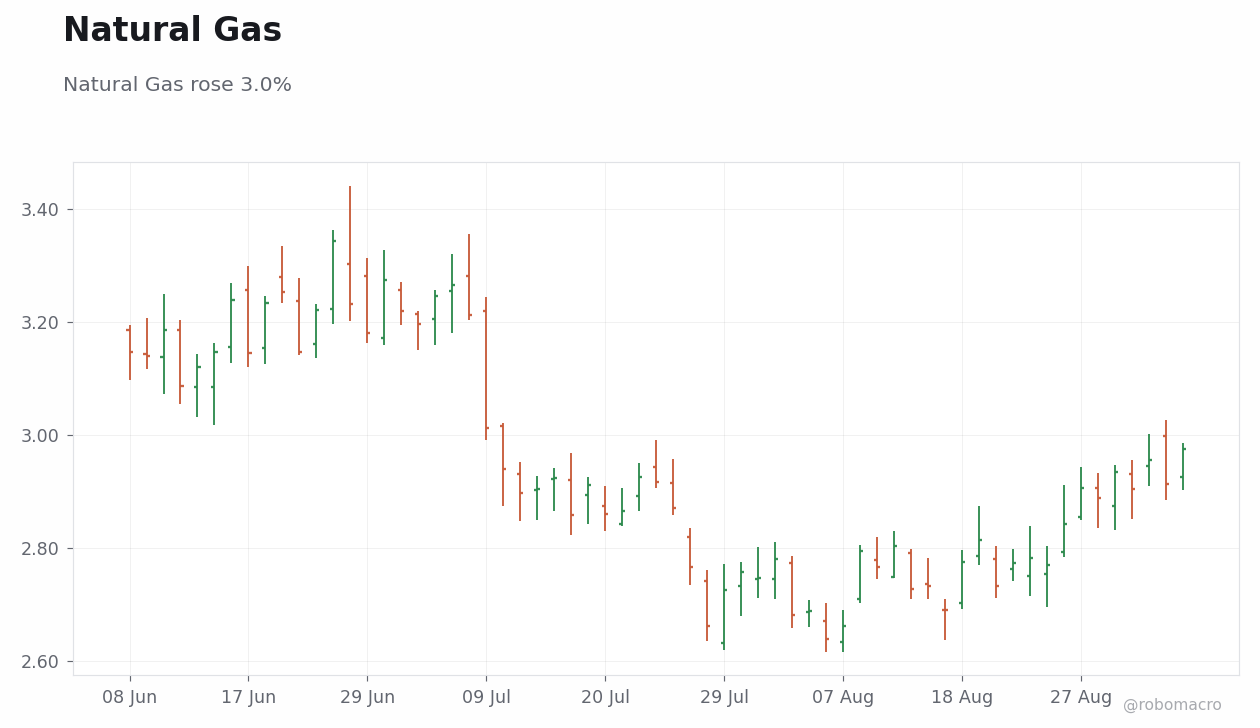
WTI Crude was the biggest mover, rising +9.7% to 91.48. Brent Crude gained +7.8% to 96.28 while Natural Gas rose +3.0% to 2.98, underscoring broad strength across the energy complex amid geopolitical supply risks. Metals were more mixed, with Gold ending at 4476.60 after a -0.0% weekly change and Silver declining -0.4% to 66.75. Copper advanced +1.8% to 6.68, offering a constructive growth signal even as manufacturing momentum showed signs of fading. Wheat fell -4.3% to 734.00, weighing on the agriculture group. Daily closes showed WTI Crude advancing from 90.2 on Tuesday to 91.0 on Wednesday, 91.3 on Thursday and 91.5 on Friday, while Gold moved from 4,348 on Tuesday to 4,366 on Wednesday, spiked to 4,492 on Thursday and closed at 4,477 on Friday.
Energy Complex
WTI Crude settled at 91.48 after a +9.7% weekly gain while Brent Crude rose +7.8% to 96.28. Natural Gas added +3.0% to finish at 2.98, participating in the broader energy uplift. The intra-week path for WTI Crude was consistently firmer, with closes recorded at 90.2 on Tuesday, 91.0 on Wednesday, 91.3 on Thursday and 91.5 on Friday. Geopolitical tensions centered on Middle East escalation and US-Iran clashes provided the dominant narrative backdrop, supporting oil futures and contributing to the steepest weekly performance in the complex since mid-July. This move occurred alongside regional divergence in manufacturing surveys, yet the price action remained anchored to supply-risk premium rather than immediate demand destruction.
Metals & Ags
Gold closed at 4476.60 with a -0.0% weekly change while Silver ended at 66.75 after a -0.4% decline, resulting in a higher gold-silver ratio. Copper rose +1.8% to 6.68, acting as a positive growth signal consistent with resilient durable-goods orders and select regional manufacturing strength. Wheat declined -4.3% to 734.00, reflecting softer agricultural price action amid an otherwise firm commodity backdrop. Gold exhibited notable daily volatility, trading at 4,348 on Tuesday, 4,366 on Wednesday, 4,492 on Thursday and 4,477 on Friday. Overall, the precious-metals complex held steady even as energy strength and selected industrial gains highlighted differentiated macro sensitivities across commodities.
Week Ahead
The economic calendar is light on commodity-relevant events next week, with no EIA crude or gas inventory releases, OPEC meetings, China PMI or industrial production data, US CPI prints, or central bank meetings affecting commodity currencies such as CAD, AUD or BRL scheduled. In the absence of major data releases, non-calendar risks will dominate, particularly ongoing geopolitical developments tied to Middle East tensions and potential OPEC diplomacy. Weather patterns remain a secondary focus for Natural Gas demand and agricultural commodities including Wheat. Market participants will therefore monitor headline geopolitical flows and any incremental shifts in growth or inflation sentiment for directional cues.
| Pair | Level | WoW | MTD | YTD |
|---|---|---|---|---|
| DXY | 99.16 | -0.5% | -0.5% | +0.8% |
| EUR/USD | 1.1618 | +0.2% | +0.0% | -1.1% |
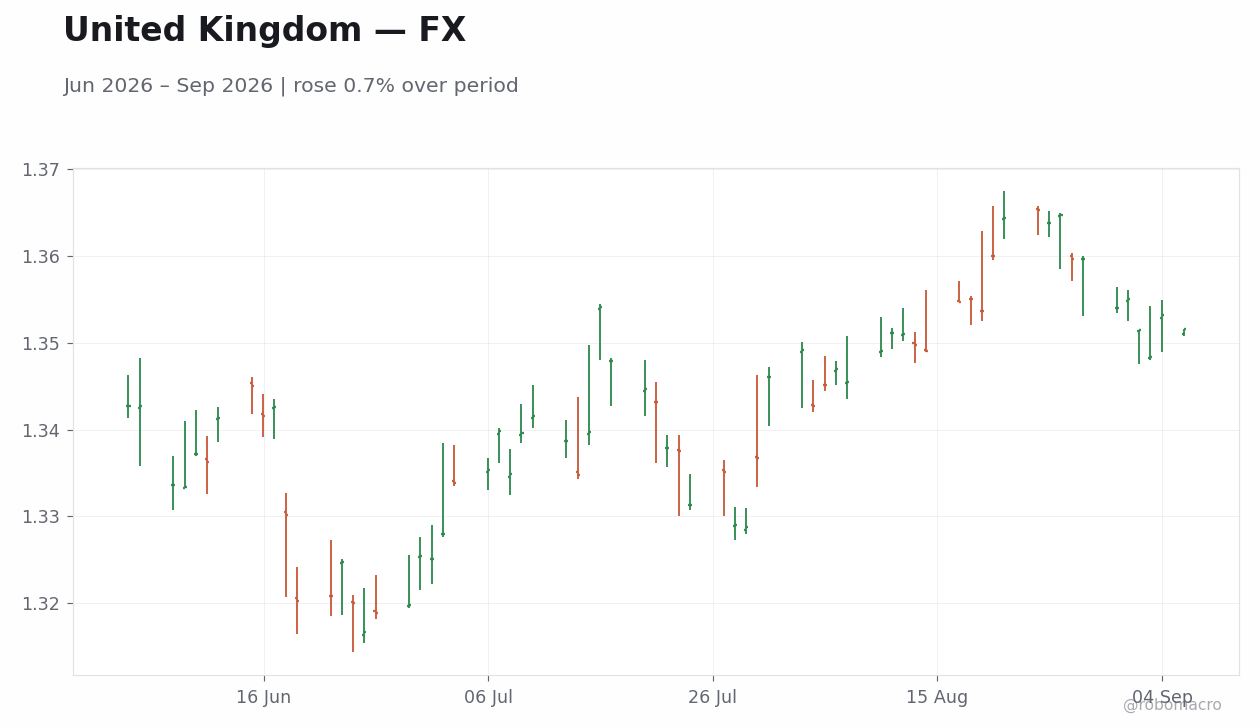
| GBP/USD | 1.3518 | -0.2% | -0.2% | +0.3% |
| USD/JPY | 155.91 | -2.6% | -2.4% | -0.5% |
| AUD/USD | 0.7202 | +0.5% | +0.4% | +7.8% |
| NZD/USD | 0.5882 | -0.6% | -0.7% | +2.2% |
| USD/CAD | 1.3825 | -0.5% | -0.2% | +0.8% |
| USD/CHF | 0.8090 | +0.7% | +0.1% | +2.1% |
| USD/CNY | 6.7103 | -0.2% | -0.2% | -4.1% |
| USD/BRL | 5.1249 | -1.3% | -1.1% | -7.1% |
| USD/MXN | 16.87 | -0.9% | -0.7% | -6.2% |
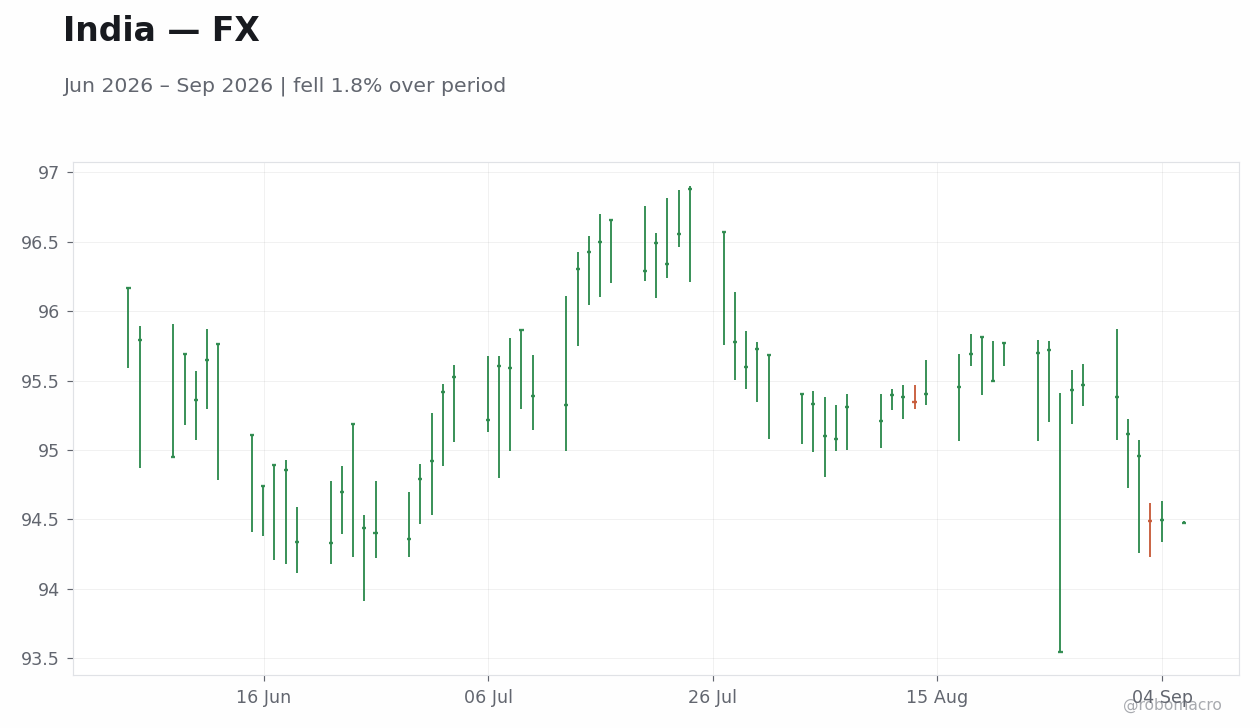
| USD/INR | 94.47 | -0.9% | -0.7% | +5.0% |
| USD/ZAR | 15.95 | -1.4% | -0.9% | -3.6% |
| USD/TRY | 48.41 | +0.3% | +0.3% | +12.6% |
| Commodity | Level | WoW | MTD | YTD |
|---|---|---|---|---|
| WTI Crude | 91.48 | +9.7% | +1.4% | +59.6% |
| Brent Crude | 96.28 | +7.8% | +1.7% | +58.5% |
| Gold | 4476.60 | -0.0% | +3.0% | +3.8% |
| Silver | 66.75 | -0.4% | +3.3% | -5.4% |
| Copper | 6.68 | +1.8% | +2.7% | +18.5% |
| Natural Gas | 2.98 | +3.0% | +2.4% | -17.8% |
| Wheat | 734.00 | -4.3% | -3.9% | +44.9% |
| Iron Ore | 99.57 | +3.9% | +0.2% | -7.1% |
| Asset | Level | WoW | MTD | YTD |
|---|---|---|---|---|
| Bitcoin | $79,946 | +2.9% | +3.3% | -9.9% |
| Ethereum | $2,496 | +3.2% | +3.2% | -16.8% |
| Solana | $106 | +3.7% | +5.7% | -16.6% |
| XRP | $1 | +4.3% | +4.9% | -24.5% |
The dollar index declined 0.5% to 99.16. USD/JPY posted the largest move, falling 2.6% to 155.91, while USD/ZAR dropped 1.4% to 15.95 and USD/BRL eased 1.3% to 5.1249. USD/CHF rose 0.7% to 0.8090 and AUD/USD gained 0.5% to 0.7202, diverging from NZD/USD which fell 0.6% to 0.5882. EUR/USD advanced 0.2% to 1.1618, contrasting with GBP/USD which slipped 0.2% to 1.3518. USD/TRY added 0.3% to 48.41 while USD/MXN and USD/INR each declined 0.9%. USD/CNY eased 0.2% to 6.7103. Next week, markets will monitor follow-through in yen and EM crosses after the sharp weekly repricing.
| Asset | Level | WoW |
|---|---|---|
| S&P 500 | 7718.6 | +0.4% |
| Nasdaq 100 | 29544.15 | +0.3% |
| Dow Jones | 53414.25 | +0.4% |
| Russell 2000 | 2975.65 | +0.7% |
| USD/JPY | 155.93 | -2.6% |
| EUR/USD | 1.16 | +0.2% |
| GBP/USD | 1.35 | -0.2% |
| Gold | 4476.6 | +1.0% |
| WTI Crude | 91.48 | +6.7% |
| Bitcoin | 79921.55 | +2.9% |


| Date | Ctry | Event | Prior | Cons. | Actual |
|---|---|---|---|---|---|
| Mon 31 | US | Dallas Fed Manufacturing I | 1.3 | - | 11.6 |
| Mon 31 | US | 3-Month Treasury Bill Auct | - | - | 3.8 |
| Mon 31 | US | 6-Month Treasury Bill Auct | - | - | 3.9 |
| Tue 1 | US | Logistics Managers Index | 68.9 | - | 66.6 |
| Tue 1 | US | Redbook Retail Sales Year- | - | - | 9.6 |
| Tue 1 | US | S&P Global Manufacturing P | 53.9 | 53.2 | 53.9 |
| Tue 1 | US | ISM Manufacturing PMI Inde | 55.6 | - | 54.6 |
| Tue 1 | US | JOLTs Job Openings Level | 7.4mn | - | 7.3mn |
| Tue 1 | US | ISM Manufacturing Employme | 52.8 | - | 51.2 |
| Tue 1 | US | Construction Spending Mont | -0.10 | - | -0.50 |
| Tue 1 | US | ISM Manufacturing New Orde | 56.7 | - | 53.7 |
| Tue 1 | US | ISM Manufacturing Prices L | 71.1 | - | 71.1 |
| Tue 1 | US | JOLTs Job Quits Level | 3.2mn | - | 3.1mn |
| Tue 1 | US | RCM/TIPP Optimism Index | 45.1 | - | - |
| Date | Release | Prior | Cons. |
|---|---|---|---|
| 2026-09-08 | ADP Employment Change Weekly | - | - |
| 2026-09-09 | MBA 30-Year Mortgage Rate | - | - |
| 2026-09-09 | API Weekly Crude Oil Stocks | - | - |
| 2026-09-10 | Producer Price Index Month-over-Mon | 0 | - |
| 2026-09-10 | Core Producer Price Index Month-ove | 0.20 | - |
| 2026-09-10 | Weekly Jobless Claims | - | - |
| 2026-09-10 | Existing Home Sales Level | 4.1mn | - |
| 2026-09-10 | Existing Home Sales Month-over-Mont | -1.7 | - |
| 2026-09-10 | EIA Weekly Crude Oil Inventory | - | - |
| 2026-09-10 | EIA Weekly Gasoline Inventory | - | - |


| Asset | Level | WoW |
|---|---|---|
| Euro Stoxx 50 | 6392.93 | -0.4% |
| DAX | 26046.4 | -0.8% |
| CAC 40 | 8278.77 | -0.7% |
| EUR/USD | 1.16 | +0.2% |
| EUR/GBP | 0.86 | +0.4% |
| EUR/JPY | 181.1 | -2.4% |
| Gold | 4476.6 | +1.0% |
| Brent Crude | 96.28 | +6.4% |
| Bitcoin | 79921.55 | +2.9% |


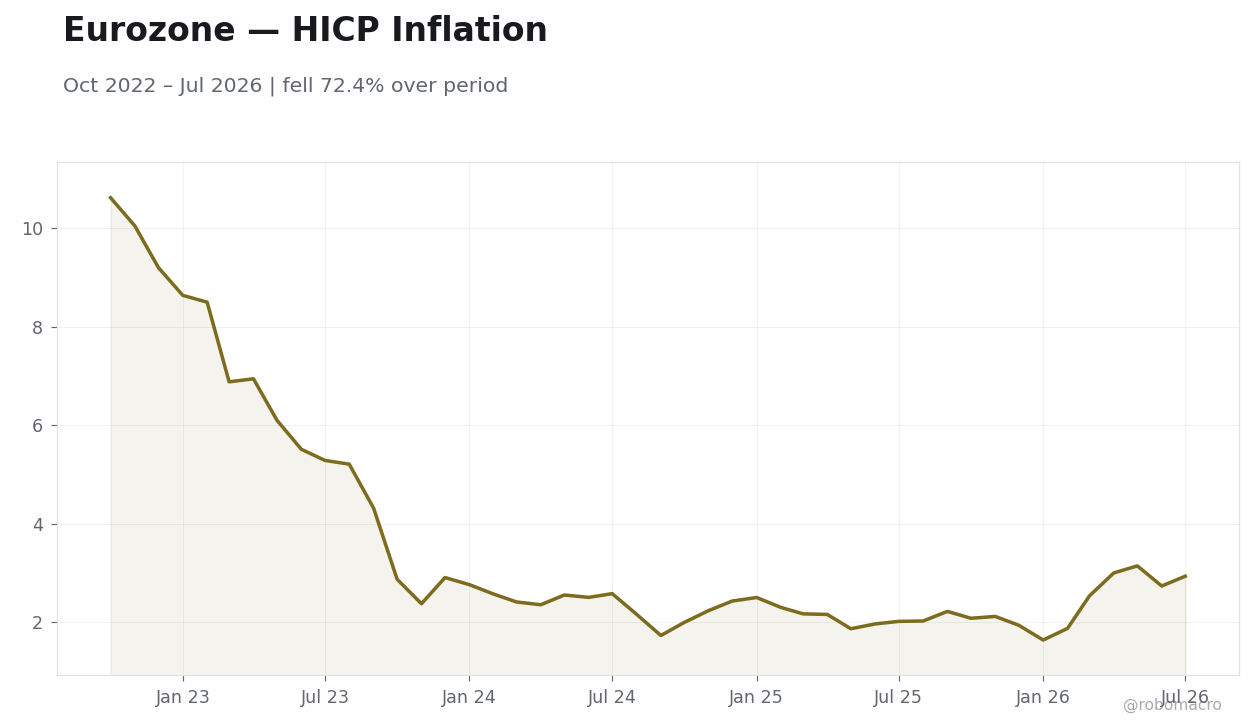
Inflation prints diverge from retail weakness. German preliminary August CPI rose y/y while the month-over-month rate printed below expectations. Dutch inflation moved higher and Italian CPI accelerated. These outcomes left the aggregate Eurozone picture little changed from the prior week’s stability.
Retail sales signal consumer softness. German retail sales contracted m/m and fell y/y. Spanish manufacturing PMI declined and Italian manufacturing PMI dropped. Italian unemployment held steady.
Equity markets absorb mixed data. The Euro Stoxx 50 closed at 6392.93 after a -0.42% weekly decline while the DAX fell 0.81% to 26046.4. The CAC 40 declined 0.67% to 8278.77. German 10-year Bund yields ended higher.
Energy prices drive commodity repricing. Brent crude settled at 96.28 after a 6.4% advance. Gold reached 4476.6 for a 1.03% gain. EUR/USD finished at 1.16 after a 0.24% rise. These moves occurred against a backdrop of selective resilience that left the ECB on its data-dependent path.
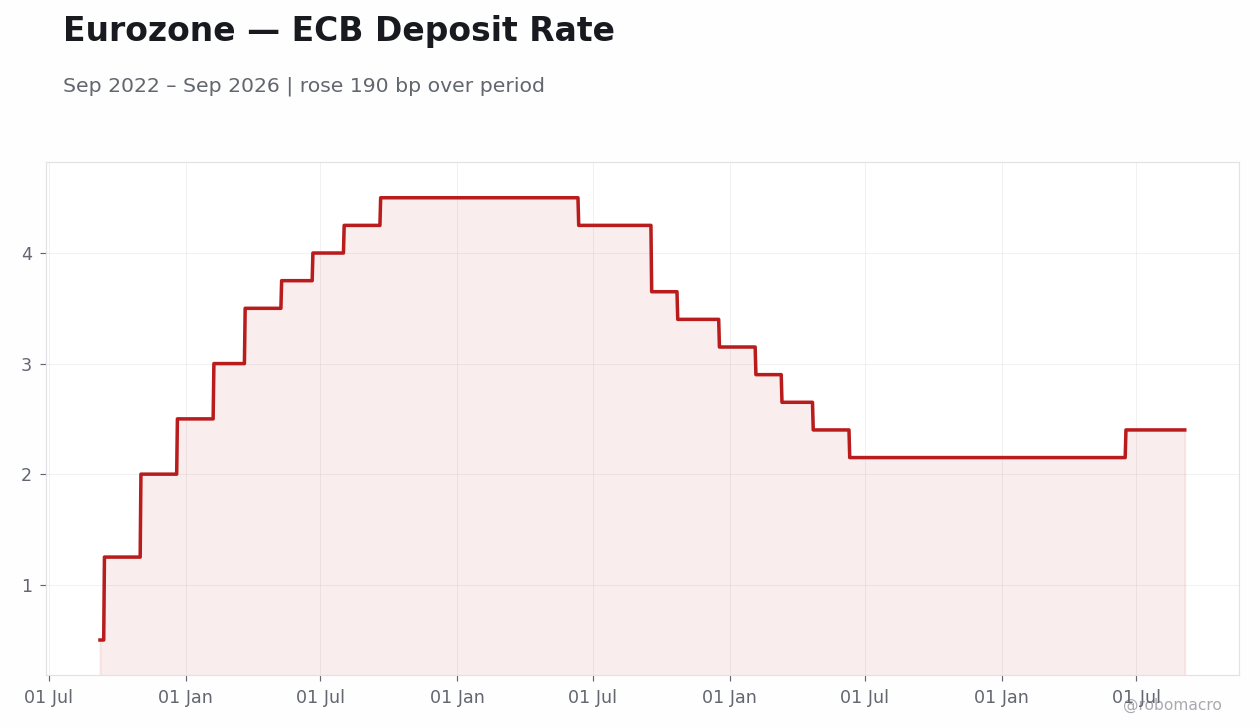
ECB speakers reiterated data dependence around the deposit rate following the week’s inflation and activity prints. German preliminary CPI and Italian CPI left the aggregate Eurozone rate near the level referenced in prior communications. The configuration reinforced the central bank’s refusal to recalibrate parameters on single-week outcomes. Retail sales weakness for Germany highlighted downside risks to growth without altering the near-term policy stance. Bank lending growth across the euro area continued to accelerate in July per recent reports. Forward guidance remained anchored to incoming figures on inflation and unemployment. No decisions altered the policy rate this week.
German preliminary August CPI came in below the consensus but above the prior print, while the month-over-month rate reached below expectations. Dutch inflation edged higher. German retail sales plunged m/m against the consensus and declined y/y. Spanish manufacturing PMI contracted. Italian manufacturing PMI fell. Italian unemployment remained steady while Italian CPI jumped. These releases point to persistent price pressures amid softening consumer demand and below-trend manufacturing momentum. The configuration supports the ECB’s data-dependent stance on the policy rate without immediate shifts in the medium-term path. Net energy importer relief from earlier Brent moves has not yet translated into uniform disinflation across core components.
| Date | Ctry | Event | Prior | Cons. | Actual |
|---|---|---|---|---|---|
| Mon 31 | DE | Import Prices Month-over-M | -0.70 | 0.20 | - |
| Mon 31 | DE | Import Prices Year-over-Ye | 6.1 | - | - |
| Mon 31 | DE | Baden Wuerttemberg Consume | 0.80 | - | 0.10 |
| Mon 31 | DE | Baden Wuerttemberg Consume | 2.5 | - | 2.6 |
| Mon 31 | DE | Bavaria Consumer Price Ind | 0.60 | - | 0.20 |
| Mon 31 | DE | Bavaria Consumer Price Ind | 2.8 | - | 2.9 |
| Mon 31 | DE | Brandenburg Consumer Price | 0.70 | - | 0.30 |
| Mon 31 | DE | Brandenburg Consumer Price | 2.7 | - | 3.1 |
| Mon 31 | DE | Hesse Consumer Price Index | 0.70 | - | 0.30 |
| Mon 31 | DE | Hesse Consumer Price Index | 2.7 | - | 3.0 |
| Mon 31 | DE | North Rhine Westphalia Con | 0.90 | - | 0.20 |
| Mon 31 | DE | North Rhine Westphalia Con | 2.7 | - | 2.9 |
| Mon 31 | DE | Saxony Consumer Price Inde | 0.70 | - | 0.10 |
| Mon 31 | DE | Saxony Consumer Price Inde | 2.8 | - | 2.9 |
| Date | Release | Prior | Cons. |
|---|---|---|---|
| 2026-09-07 | Industrial Production Month-over-Mo | 0.20 | - |
| 2026-09-08 | Trade Balance | 15.4bn | - |
| 2026-09-08 | Exports Month-over-Month | - | - |
| 2026-09-08 | Trade Balance | -5.8bn | - |
| 2026-09-09 | Industrial Production Month-over-Mo | 0.10 | - |
| 2026-09-10 | Industrial Production Month-over-Mo | -1.0 | - |
German industrial production month-over-month is scheduled for September 7. German trade balance follows on September 8. French industrial production month-over-month is due September 9. Italian industrial production month-over-month prints September 10. These releases will inform the growth outlook ahead of the next ECB meeting. Household consumption data for the Netherlands arrives September 7. Romanian GDP second estimates are also due early in the week. Markets will monitor whether manufacturing and trade figures confirm the mid-phase expansion narrative observed in prior weeks.
German retail sales contraction raises downside risks to near-term consumption while inflation prints keep upside price risks in focus. The configuration leaves the ECB data-dependent without clear signals for near-term policy adjustment. Equity positioning appears cautious after the Euro Stoxx 50’s -0.42% weekly decline. Brent’s advance to 96.28 introduces imported inflation sensitivity for net-energy importers. Volatility in EUR/JPY, which fell 2.4% to 181.1, highlights external rate differentials. Flow considerations favor selective resilience in services PMI prints.
Equities posted net weekly declines with the Euro Stoxx 50 closing at 6392.93 for a -0.42% move while the DAX fell 0.81% to 26046.4 and the CAC 40 declined 0.67% to 8278.77. German 10-year Bund yields ended higher. EUR/USD rose 0.24% to 1.16 while EUR/JPY fell 2.4% to 181.1. Brent crude advanced 6.4% to 96.28 and gold gained 1.03% to 4476.6. Daily equity moves included a drop in the Euro Stoxx 50 after the German retail sales miss. Brent rose amid the broader commodity impulse. These cross-asset shifts reflected the tension between softer German demand data and firmer energy prices.
Brent crude’s advance to 96.28 interacted with uneven activity data across developed markets. German wholesale price expectations from prior weeks showed rebound potential that could interact with the current energy impulse. US activity signals from the prior week reinforced the data-dependent equilibrium observed in the euro area. Japanese CPI and machinery orders from recent releases kept the Bank of Japan on a normalization path that supports external rate differentials versus the ECB. UK labor market data and CPI prints from the prior week showed mixed momentum without immediate policy shifts. These cross-border dynamics sustain the mid-phase expansion narrative without synchronized momentum.
| Asset | Level | WoW |
|---|---|---|
| Nikkei 225 | 65020.94 | -1.9% |
| USD/JPY | 155.93 | -2.6% |
| EUR/JPY | 181.1 | -2.4% |
| GBP/JPY | 210.62 | -2.9% |
| Gold | 4476.6 | +1.0% |
| Brent Crude | 96.28 | +6.4% |
| Bitcoin | 79921.68 | +2.9% |


Mixed production and spending prints set the tone. July industrial production missed consensus and decelerated sharply from the prior month, while capital spending exceeded forecasts. Retail sales and housing starts both beat expectations. Consumer confidence improved and exceeded consensus. These releases showed uneven momentum, with manufacturing cooling while household indicators held firmer.
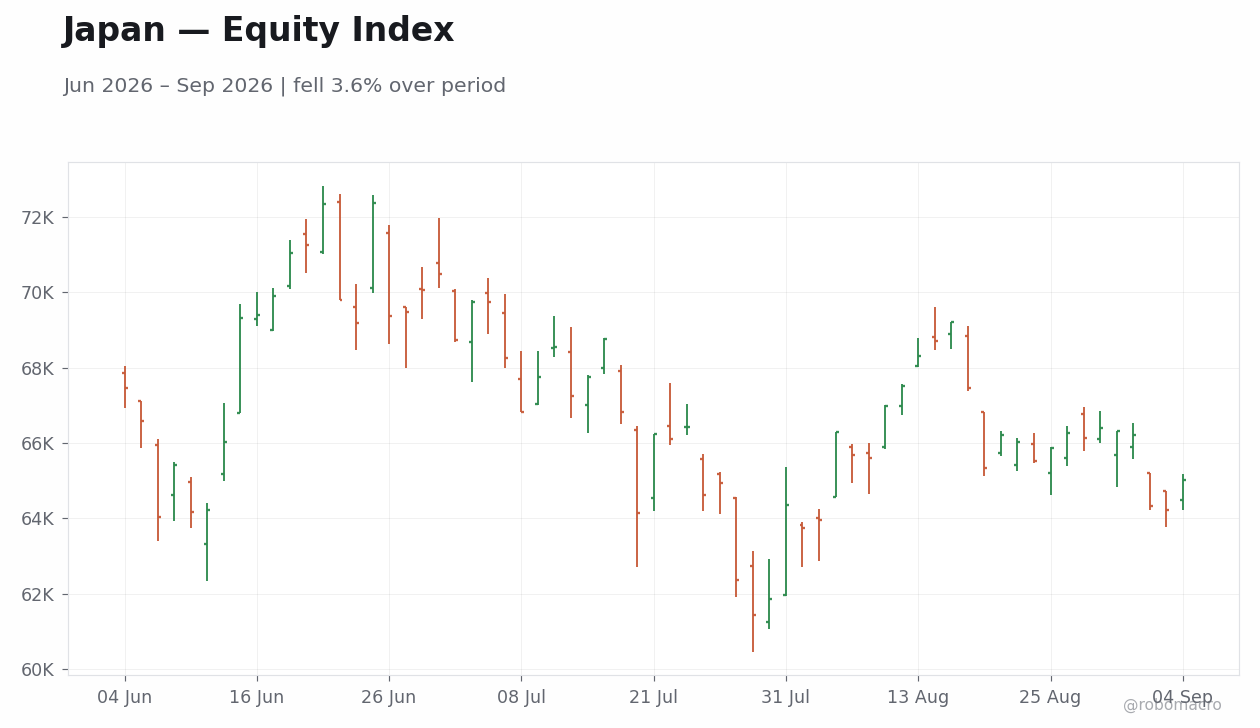
Currency and equity markets repriced external pressure. USD/JPY closed the week at 155.93 after crossing below 160 mid-week on intervention rhetoric. The Nikkei 225 fell 1.95% over the week, with the sharpest daily drop occurring on September 3 amid yen strength. Brent crude rose 6.4% while gold gained 1.03%, reflecting broader safe-haven flows tied to yen moves.
Policy signals from officials shaped the narrative arc. Takada’s September 2 comments stressed considering wide monetary policy options, following earlier data dependence language from board members. The combination of soft IP and resilient consumption data left the Bank of Japan’s next decision path unchanged but highlighted the tension between external rate differentials and domestic inflation. Japan 10-year yields remained near recent levels while the 2-year yield held steady, consistent with limited immediate repricing of the policy rate.
Overall arc confirmed data dependence without fresh guidance shifts. The week’s prints reinforced that manufacturing momentum is fading even as consumer spending and confidence provide support, aligning with the prior three weeks’ emphasis on selective resilience. No consensus-beating inflation or wage data emerged to alter the balance, leaving the Bank of Japan in its established holding pattern ahead of upcoming decisions.
BoJ board member Takada stated on September 2 that the central bank must weigh a broad range of monetary policy options, echoing earlier data-dependent messaging from Himino. The July industrial production miss and capital spending beat together illustrated the uneven growth backdrop that continues to anchor the policy rate at current levels. CPI held steady through July, keeping real rates negative and supporting the case for gradual normalisation without immediate acceleration. Officials maintained explicit focus on incoming data rather than committing to any specific timing for the next adjustment. The week’s yen appreciation and intervention warnings from finance officials added external pressure but did not prompt any shift in forward guidance language.
| Date | Ctry | Event | Prior | Cons. | Actual |
|---|---|---|---|---|---|
| Mon 31 | JP | Capital Spending Year-over | 0 | - | 1.6 |
| Mon 31 | JP | S&P Global Manufacturing P | 54.5 | - | - |
| Mon 31 | JP | 10-Year Japanese Governmen | 2.8 | - | - |
| Tue 1 | JP | Monetary Base Year-over-Ye | -13.8 | - | -15.7 |
| Tue 1 | JP | Speech by BoJ's Takada | - | - | - |
| Wed 2 | JP | Foreign Bond Investment Le | - | - | -824.0bn |
| Wed 2 | JP | Foreign Stock Investment L | - | - | 35.8bn |
| Wed 2 | JP | Composite PMI Final | 52.7 | - | - |
| Wed 2 | JP | Services PMI Final | 51.2 | - | - |
| Wed 2 | JP | 30-Year Japanese Governmen | 3.9 | - | - |
| Thu 3 | JP | Household Spending Month-o | -6.4 | - | 0.50 |
| Thu 3 | JP | Household Spending Year-ov | -3.3 | - | -3.6 |
| Thu 3 | JP | 3-Month Treasury Bill Auct | - | - | - |
| Fri 4 | JP | Coincident Index Prelimina | - | - | - |
| Date | Release | Prior | Cons. |
|---|---|---|---|
| 2026-09-07 | Current Account Balance | -923.0bn | - |
| 2026-09-07 | GDP Growth Annualized Final | 1.8 | 1.1 |
| 2026-09-07 | GDP Growth Quarter-over-Quarter Fin | 0.50 | 0.30 |

Final GDP growth annualized is scheduled for release on September 7, while the quarter-over-quarter final estimate follows. The current account balance release on the same day will clarify whether the preliminary GDP miss from earlier weeks is confirmed or revised higher, directly informing the Bank of Japan’s assessment of growth momentum ahead of upcoming decisions. Household spending data already released showed a month-over-month rebound, and any follow-through in next week’s figures will test consumption resilience. No BoJ speakers are currently scheduled, leaving markets to focus on the data flow and any further official comments on yen stability. The releases matter because they will update the balance of risks around inflation and activity that the Bank of Japan has cited as central to its data-dependent stance.
The industrial production slowdown raises downside risks to near-term growth while the capital spending and consumer confidence beats limit the scope for outright pessimism. Yen strength driven by intervention fears could ease imported inflation pressures in coming quarters but may also weigh on exporter earnings and equity valuations. Upside scenarios hinge on sustained household spending and any upward GDP revisions that would reinforce the case for further policy rate adjustments. Downside scenarios center on continued manufacturing weakness and potential escalation in external pressure that forces faster yen appreciation than domestic conditions warrant. The week’s data shift the outlook toward greater emphasis on consumption resilience as the key support for the Bank of Japan’s gradual normalisation path, while the absence of fresh inflation acceleration leaves room for the current policy rate to remain on hold longer than some earlier expectations suggested.
| Asset | Level | WoW |
|---|---|---|
| S&P/TSX | 36513.8 | +0.7% |
| USD/CAD | 1.38 | -0.5% |
| EUR/CAD | 1.61 | -0.2% |
| WTI Crude | 91.48 | +6.7% |
| Natural Gas | 2.97 | +1.4% |
| Gold | 4476.6 | +1.0% |
| Brent Crude | 96.28 | +6.4% |
| Bitcoin | 79921.55 | +2.9% |


Q2 GDP Outperformance Anchors Policy Stability Canada’s second-quarter GDP rose annualized and surpassed Bank of Canada projections. The print highlighted strength in domestic demand despite escalating trade frictions with the United States.
Manufacturing Momentum Eases The S&P Global Manufacturing PMI declined in August from the prior month, marking the first decline in several months and signaling softer export orders.
BoC Holds Amid External Risks The Bank of Canada left the policy rate unchanged, matching consensus expectations. Governor remarks stressed realism about Canada-US trade frictions and persistent energy-price pressures.
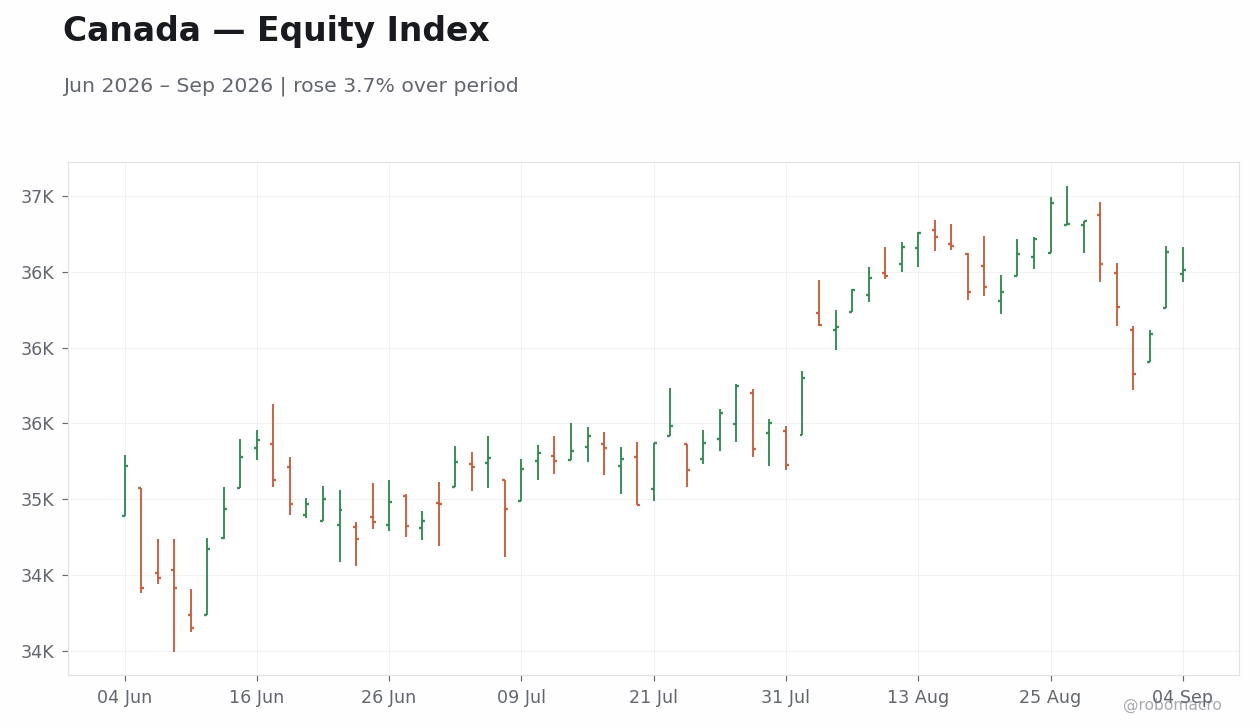
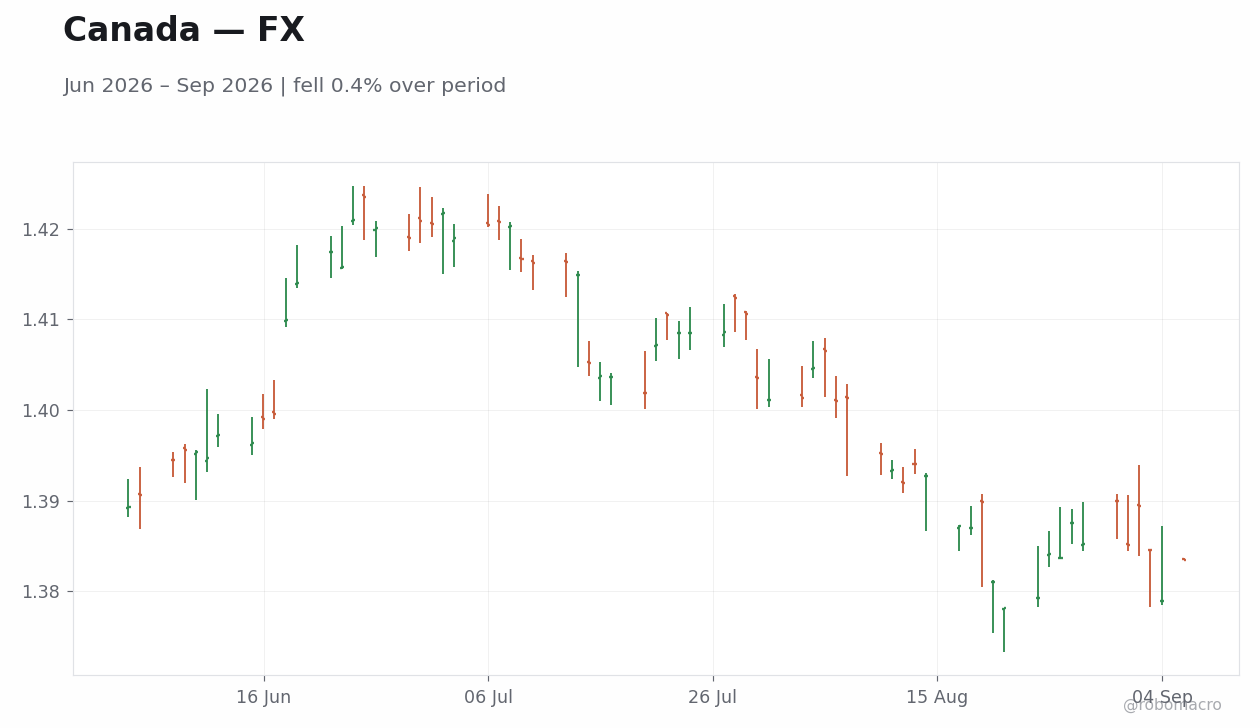
Equity and Currency Moves Reflect Mixed Sentiment The S&P/TSX Composite closed the week higher. USD/CAD eased over the same period.
Energy Prices Provide Counterbalance WTI crude advanced while Brent crude rose, supporting the resource-heavy equity index.
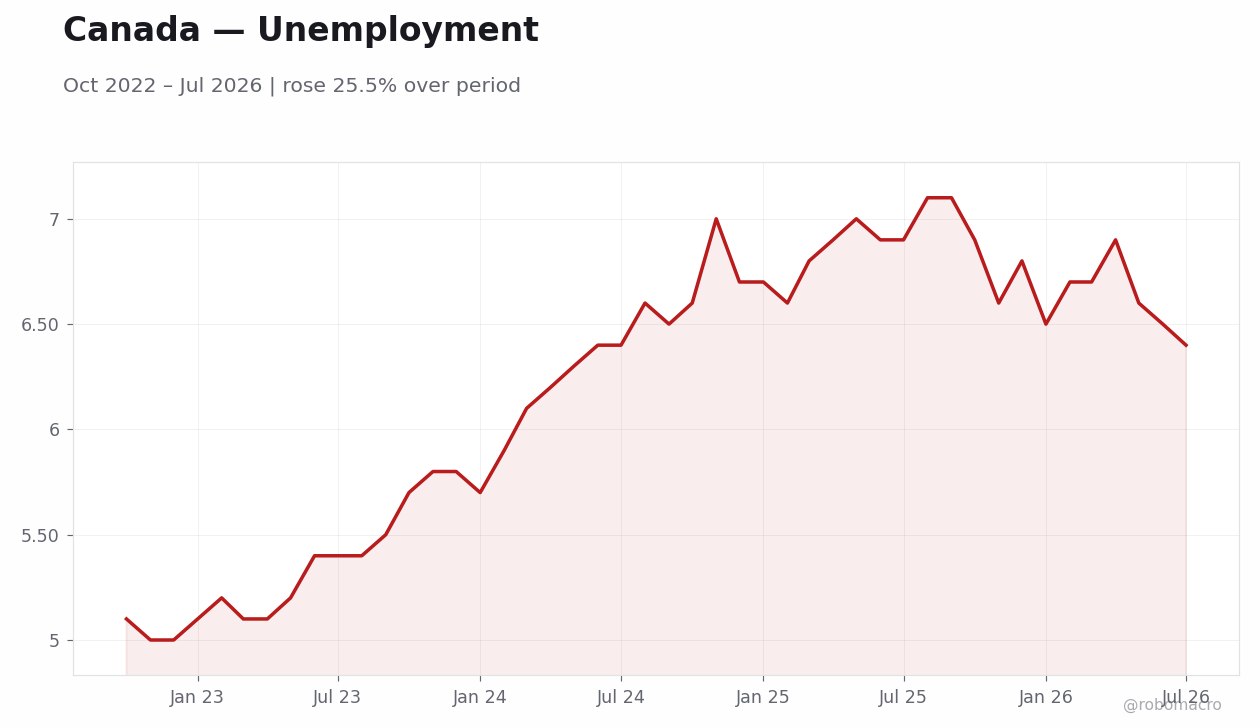
Labor Market Delivers Downside Surprise August employment declined versus the consensus, although the unemployment rate held steady. The Ivey PMI also printed below expectations.
Yield Curve Shows Limited Policy Shift The Canada 10-year government yield fell while the 2-year yield edged higher. Record foreign inflows into government bonds in the second quarter helped contain domestic yields.
Inflation and Trade Data Frame Outlook July CPI stood higher year-over-year with gasoline prices surging, keeping inflation above the 2 percent target. The July trade balance narrowed.
Overall Narrative Coheres Around Data Dependence The week’s arc showed stronger-than-expected growth prints early, followed by softer activity and labor data that reinforced the Bank of Canada’s data-dependent stance without altering the current policy rate.
The Bank of Canada held the policy rate unchanged, the seventh consecutive unchanged decision. Officials highlighted tariff-related input-cost increases for exporters and elevated fuel prices that could push inflation above the recent year-over-year level. The S&P Global Manufacturing PMI decline underscored softening factory momentum that aligns with the Governing Council’s emphasis on incoming data. No new forward guidance was issued on the timing of future adjustments. The August employment decline supplies fresh evidence of labor-market cooling that will factor into upcoming decisions. Officials continue to weigh external trade risks against contained domestic inflation trends when assessing the path ahead.
| Date | Ctry | Event | Prior | Cons. | Actual |
|---|---|---|---|---|---|
| Tue 1 | CA | S&P Global Manufacturing P | 53.5 | - | 53.0 |
| Wed 2 | CA | BoC Interest Rate Decision | 2.2 | - | 2.2 |
| Wed 2 | CA | Press Conference by BoC | - | - | - |
| Thu 3 | CA | Trade Balance | 3.9bn | - | 770.0mn |
| Thu 3 | CA | Exports Level | 77.5bn | - | 76.1bn |
| Thu 3 | CA | Imports Level | 73.6bn | - | 75.4bn |
| Thu 3 | CA | Labor Productivity Quarter | -0.50 | - | 1.0 |
| Thu 3 | CA | S&P Global Composite PMI I | 49.7 | - | 47.8 |
| Thu 3 | CA | S&P Global Services PMI In | 49.1 | - | 46.8 |
| Thu 3 | CA | 2-Year Bond Auction | 3.0 | - | 3.2 |
| Fri 4 | CA | Unemployment Rate | 6.4 | - | 6.4 |
| Fri 4 | CA | Employment Change | 75K | - | -42K |
| Fri 4 | CA | Full-Time Employment Chang | 39K | - | -36K |
| Fri 4 | CA | Labor Force Participation | 65.1 | - | 65.0 |


Attention next week centers on the absence of major Canadian data releases in the immediate days following September 6, allowing markets to digest the August labor-force survey. The July trade balance print already showed narrowing, consistent with softer export orders visible in the manufacturing PMI. Subsequent weeks will feature housing starts and retail sales that typically inform consumption trends ahead of the next Bank of Canada decision. These releases will help gauge whether the Q2 GDP rebound extends into the second half. Officials have stressed data dependence, so any further softening in employment or activity metrics could influence assessments of growth momentum. Energy-price volatility remains a key variable given its direct link to CPI components. The Ivey PMI provides a timely services-sector signal that will be monitored for consistency with the manufacturing slowdown. Overall, the data flow supports continued vigilance on tariff pass-through effects and domestic demand resilience.
The August jobs miss introduces downside risk to growth forecasts that could challenge the Bank of Canada’s current hold stance if sustained. Upside scenarios hinge on continued strength in energy prices, with WTI supporting resource revenues and the Canadian dollar near recent levels. Tariff escalation remains the dominant external uncertainty, with potential pass-through to inflation that officials explicitly flagged in the latest statement. Markets appear to underweight the persistence of CPI above target given gasoline’s surge, which could delay any future easing. The combination of softer PMI and labor weakness suggests the mid-cycle expansion may be losing momentum faster than previously anticipated.
| Asset | Level | WoW |
|---|---|---|
| IPC Bolsa | 64866.61 | -0.9% |
| USD/MXN | 16.87 | -0.9% |
| EUR/MXN | 19.59 | -0.7% |
| WTI Crude | 91.48 | +6.7% |
| Silver | 66.75 | +0.8% |
| Gold | 4476.6 | +1.0% |
| Brent Crude | 96.28 | +6.4% |
| Bitcoin | 79929.76 | +2.9% |


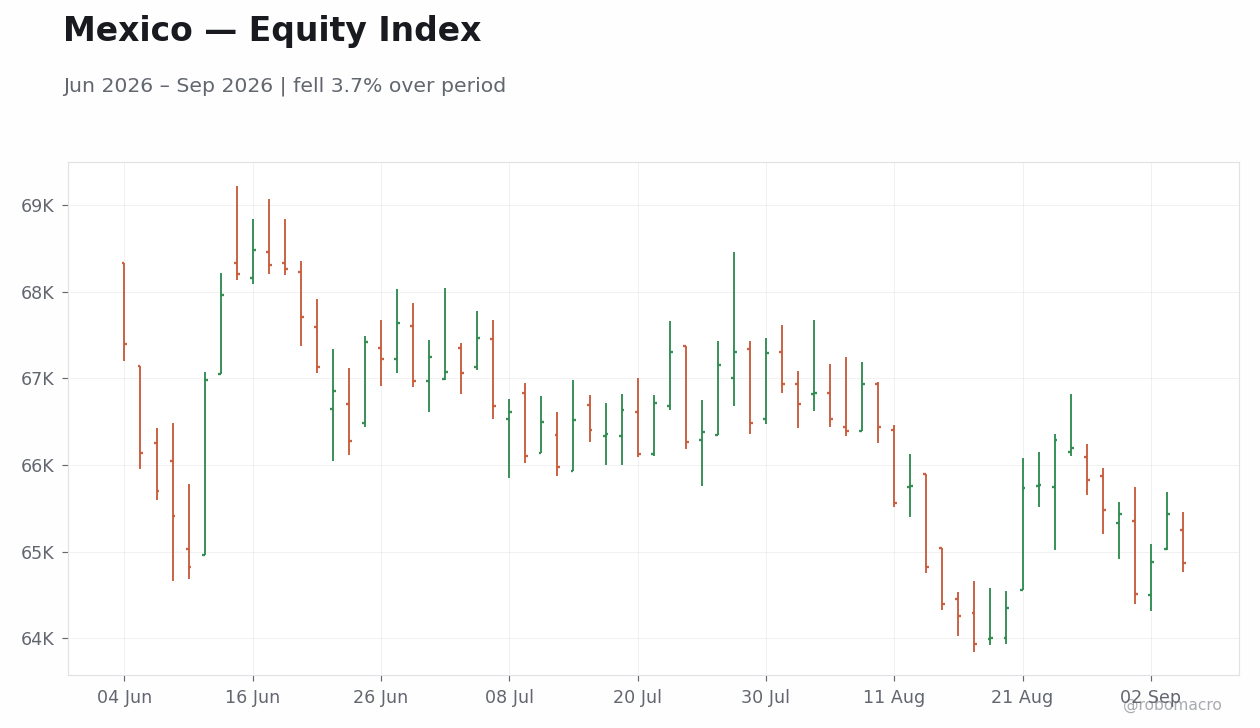
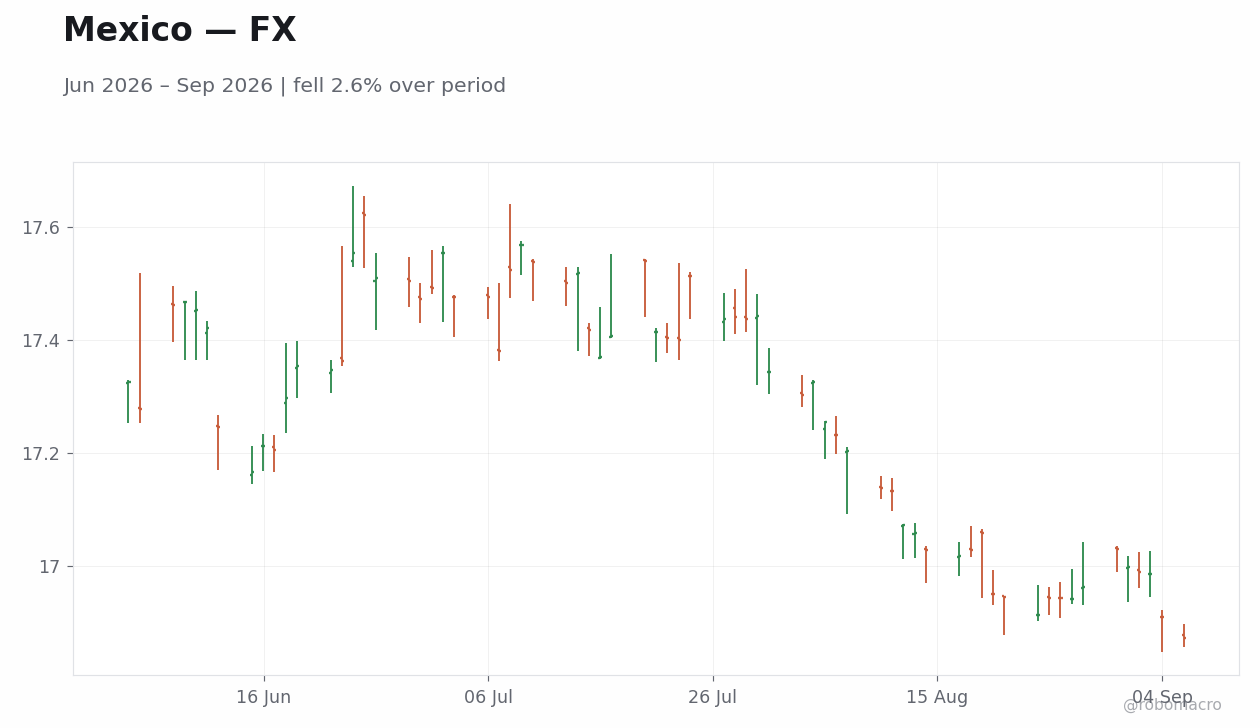
Equity and FX Performance Markets absorbed mixed commodity gains and persistent USMCA friction. The IPC Bolsa closed the week at 64866.61 after a 0.86 percent decline. USD/MXN finished at 16.87 after a 0.92 percent weekly decline, reflecting carry trade accumulation that offset trade-related caution flagged by the economy minister. EUR/MXN eased 0.73 percent to 19.59 over the same period.
Sentiment and Activity Indicators Business confidence improved modestly in August, marking stabilization in corporate views on external demand. The print aligned with ongoing nearshoring investment in northern states. No material consensus misses emerged on the limited data calendar.
Commodity and Rate Backdrop WTI Crude rose 6.67 percent to 91.48 while Brent Crude gained 6.4 percent to 96.28, supporting energy-linked assets. Mexico’s long-term rate moved higher and the short-term rate held steady, steepening the curve. These moves occurred against a backdrop of unresolved rules-of-origin talks under USMCA and an anti-dumping probe into Japanese steel sheets launched during the week.
Policy and External Context The peso’s resilience contained imported inflation pressures even as global rate differentials favored carry positions. Prior Q2 GDP expansion and steady year-over-year inflation readings continued to anchor expectations for the next Banco de Mexico decision. Overall, the week reinforced a data-dependent equilibrium without shifting the growth or inflation outlook materially.
Banco de Mexico maintained its data-dependent posture with no policy meetings or minutes released during the week. Officials continued to emphasize incoming figures on activity and prices ahead of upcoming decisions. The modest rise in business confidence and steady inflation prints from prior periods suggest limited pressure on the current policy rate path. Oil price gains to 91.48 for WTI and 96.28 for Brent could support fiscal revenues but do not alter the central bank’s focus on domestic demand and imported inflation. Forward guidance remains anchored to the next releases rather than single-week market moves.
| Date | Ctry | Event | Prior | Cons. | Actual |
|---|---|---|---|---|---|
| Tue 1 | MX | Business Confidence | 48.0 | - | 48.1 |
| Tue 1 | MX | S&P Global Manufacturing P | 51.3 | - | 49.8 |
| Tue 1 | MX | Fiscal Balance | -559.1bn | - | -731.7bn |
| Thu 3 | MX | Consumer Confidence Index | 45.0 | - | 46.1 |
| Fri 4 | MX | Gross Fixed Investment Mon | -0.40 | - | 1.3 |
| Fri 4 | MX | Gross Fixed Investment Yea | 1.1 | - | 7.7 |
| Date | Release | Prior | Cons. |
|---|---|---|---|
| 2026-09-09 | Inflation Rate Month-over-Month | 0.03 | - |
| 2026-09-09 | Inflation Rate Year-over-Year | 3.1 | - |

Inflation Rate Month-over-Month and Year-over-Year prints are scheduled for September 9 and will provide the first high-impact data point after the current week. These figures will inform assessments of price pressures entering the next Banco de Mexico decision window. No other Mexico-specific releases appear on the immediate calendar, leaving global commodity flows and USMCA updates as secondary drivers. The inflation outcome will help gauge whether recent oil advances translate into second-round effects or remain contained. Traders will also monitor any Banxico speeches for signals on the balance between growth resilience and external risks. The data should clarify whether the current policy rate remains appropriate through coming quarters.
Persistent USMCA tensions highlighted by the economy minister represent the dominant downside scenario for nearshoring and export margins. Upside risks center on further oil price strength that could bolster fiscal accounts and peso carry inflows. The market appears to underweight the potential for renewed Chinese import competition to pressure domestic producers despite the new anti-dumping investigation. A sharper-than-expected inflation print on September 9 could challenge the view of contained price pressures and reinforce vigilance at Banco de Mexico. Conversely, continued business confidence stabilization would support the baseline of gradual activity recovery without immediate policy recalibration.
| Asset | Level | WoW |
|---|---|---|
| Bovespa | 185147.0 | +4.4% |
| USD/BRL | 5.12 | -1.3% |
| EUR/BRL | 5.95 | -1.0% |
| Vale | 15.27 | +1.2% |
| Petrobras | 20.12 | +4.0% |
| WTI Crude | 91.48 | +6.7% |
| Gold | 4476.6 | +1.0% |
| Bitcoin | 79929.75 | +2.9% |


GDP Deceleration Confirmed Brazil’s second-quarter GDP rose quarter-over-quarter, above consensus yet well below the prior quarter, while year-over-year growth exceeded expectations. Private consumption contracted under the weight of elevated real borrowing costs, leaving the external sector and a farm output surge as the primary growth drivers.
Industrial Rebound and Equity Strength Industrial production rebounded month-over-month after the prior contraction, providing early evidence that manufacturing momentum may be stabilizing. Equity markets responded positively, with the Bovespa climbing for a 4.36% weekly gain while Petrobras advanced on WTI crude rising to 91.48.
Currency and Fiscal Backdrop USD/BRL eased to 5.12 over the same period as the real strengthened alongside commodity prices. The central government recorded a primary surplus in July, though state-owned enterprises posted their largest combined deficit on record, pushing public debt higher.
Demand and Rate Sensitivity High real rates at the prevailing policy rate level continued to restrain investment and household spending, confirming the transmission of prior tightening into activity. The data flow aligned with earlier official remarks that the economy is cooling faster than previously anticipated, setting the tone for policy reassessment.
External Support Remains Key The trade balance offered a modest buffer against domestic softness amid elevated commodity export prices. Overall, the week’s releases reinforced a narrative of resilient yet decelerating growth rather than outright contraction.
Banco Central do Brasil officials maintained their data-dependent stance throughout the week, with no policy rate decision scheduled. The Q2 GDP print and year-over-year outcome, together with the industrial production rebound to positive month-over-month, supplied fresh evidence that prior tightening is successfully moderating demand. Communications continued to highlight the drag from elevated real rates on consumption and state-firm balances, leaving open the possibility of an accelerated easing pace once incoming prints confirm the slowdown trajectory. The absence of any shift in forward guidance this week means the next decisions will hinge directly on the strength of subsequent activity and inflation releases. Officials have not altered their emphasis on balancing cooling growth against persistent fiscal pressures.
| Date | Ctry | Event | Prior | Cons. | Actual |
|---|---|---|---|---|---|
| Mon 31 | BR | Gross Debt to GDP | 81.9 | - | 82.5 |
| Mon 31 | BR | Nominal Budget Balance | -166.0bn | - | -97.6bn |
| Mon 31 | BR | BCB Focus Market Readout | - | - | - |
| Tue 1 | BR | GDP Growth Quarter-over-Qu | 1.1 | - | 0.50 |
| Tue 1 | BR | GDP Growth Year-over-Year | 1.8 | - | 2.0 |
| Tue 1 | BR | S&P Global Manufacturing P | 47.5 | - | 46.3 |
| Wed 2 | BR | Ipc-Fipe Inflation Month-o | -0.03 | - | 0.01 |
| Wed 2 | BR | Industrial Production Mont | -1.8 | - | 0.20 |
| Wed 2 | BR | Industrial Production Year | 1.7 | - | -0.50 |
| Thu 3 | BR | S&P Global Services PMI In | 49.7 | - | 50.5 |
| Thu 3 | BR | S&P Global Composite PMI I | 48.8 | - | 49.1 |
| Fri 4 | BR | Trade Balance | 7.1bn | - | 7.4bn |
| Date | Release | Prior | Cons. |
|---|---|---|---|
| 2026-09-11 | Inflation Rate Month-over-Month | 0.07 | - |
| 2026-09-11 | Inflation Rate Year-over-Year | 4.4 | - |

Next week’s key release is the August inflation rate month-over-month and year-over-year prints scheduled for September 11. These figures will provide the first post-GDP gauge of price pressures and directly inform the Banco Central do Brasil’s assessment of how quickly domestic demand is cooling. A softer-than-expected outcome would reinforce the case for quicker policy rate reductions at upcoming decisions by confirming that high real rates are containing inflation momentum. Conversely, any reacceleration would test the durability of the slowdown narrative already embedded in recent official remarks. No other major Brazilian data are due in the immediate period, allowing markets to focus on how the inflation path interacts with the Q2 GDP breakdown showing weak consumption. The releases will also shape expectations for the balance of growth and price stability through coming quarters.
The Q2 GDP beat on a sharply lower base raises the possibility that the economy may prove more resilient than the consensus slowdown view, potentially delaying any acceleration in the policy rate easing cycle. Fiscal deterioration via record state-enterprise deficits could add upside pressure to inflation if it feeds into higher public spending, complicating the Banco Central do Brasil’s data-dependent approach. On the downside, further weakness in private consumption and investment could push growth below the recent quarter-over-quarter pace, strengthening the argument for faster cuts. The market’s focus on commodity support for the external accounts leaves Brazil exposed to any reversal in WTI crude or iron-ore prices that would remove a key offset to domestic softness.
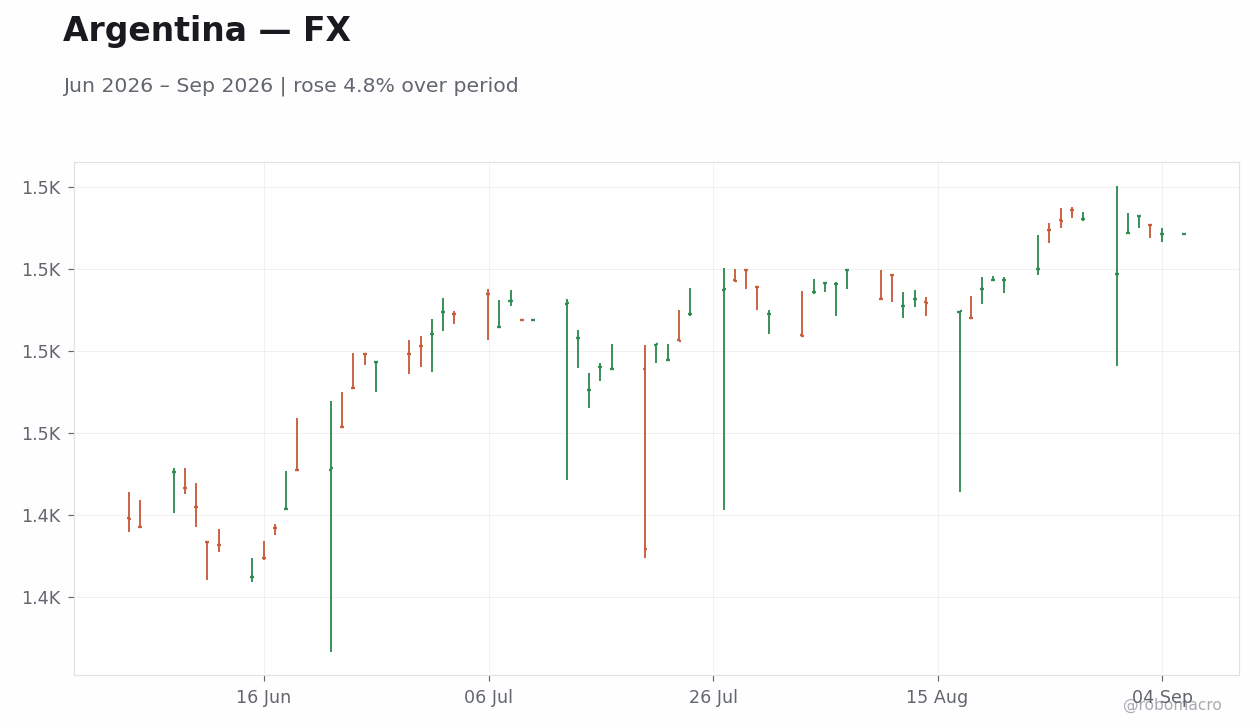
| Asset | Level | WoW |
|---|---|---|
| MERVAL | 3049122.0 | +0.5% |
| USD/ARS | 1508.5 | +0.7% |
| EUR/ARS | 1751.97 | +0.9% |
| Gold | 4476.6 | +1.0% |
| Brent Crude | 96.28 | +6.4% |
| Soybean | 1309.75 | +2.7% |
| Bitcoin | 79929.75 | +2.9% |


CPI undershoot resets the inflation trajectory. August CPI came in below consensus, driving the twelve-month rate lower as core goods inflation cooled. Services inflation stayed elevated, yet the overall print reinforced the view that price pressures are moderating faster than prior forecasts allowed.
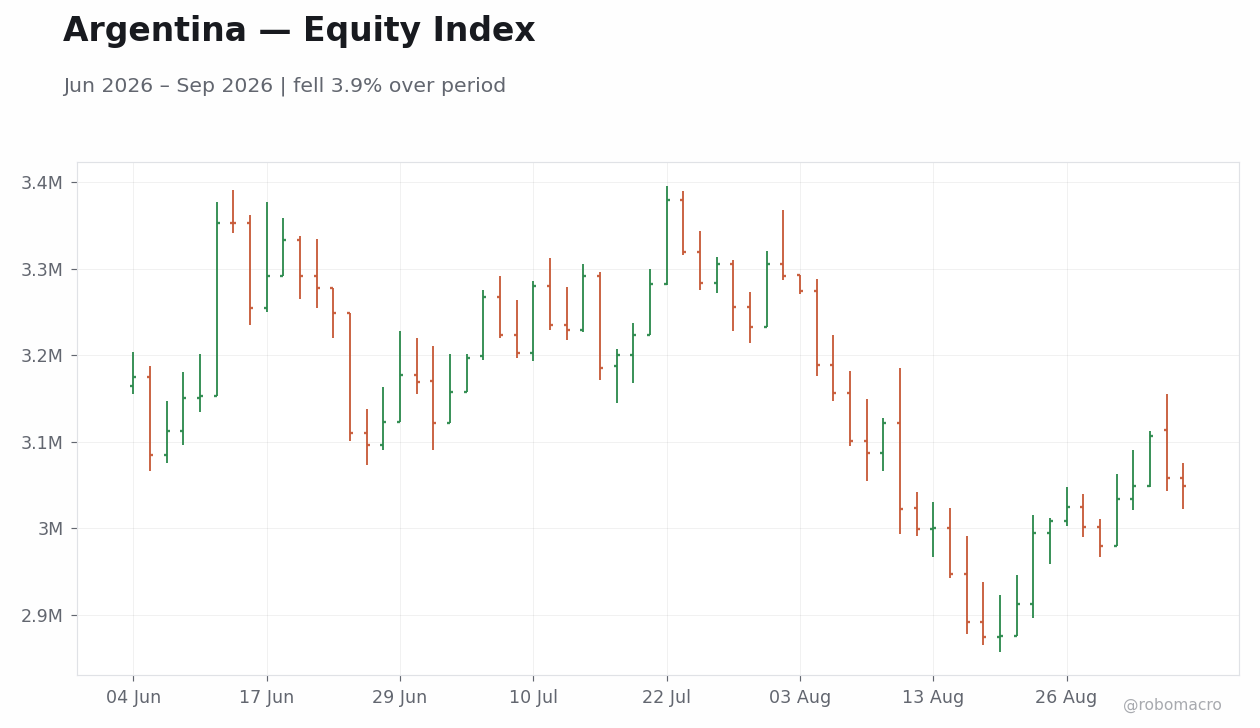
Equity markets absorbed the data with selective gains. The MERVAL rose 0.5% to close at 3,049,122. Energy and financial names led the advance amid thin volumes while Brent crude moved higher.
Peso stability persisted despite external volatility. USD/ARS ended at 1,508.50 for a net 0.65% weekly increase. The managed crawl pace remained unchanged, with daily moves limited even as gold and soybean futures advanced.
Reserve accumulation continued via commodity channels. Net international reserves increased, aided by soybean export inflows and the IMF disbursement after the third EFF review. The trade surplus and industrial production expansion provided additional support.
Credit expansion shows early limits. Bank lending has expanded rapidly since 2023, yet household defaults have begun to rise, signaling that rapid credit growth may soon constrain consumption momentum in coming quarters.
Fiscal buffers improved modestly. Export-tax collections rose year-over-year on higher commodity prices, while new syndicated facilities eased near-term financing needs ahead of future amortizations.
Labor-market data pointed to gradual recovery. Formal employment posted further monthly gains, consistent with the broader disinflation narrative and reduced wage-pass-through risks.
Global commodity moves shaped local sentiment. Brent crude and soybean futures gained ground, lifting export revenue expectations and supporting reserve inflows without requiring BCRA intervention beyond the managed crawl.
The August CPI undershoot supplies fresh evidence that inflation is tracking below the path assumed at the prior policy setting. Officials have kept the crawl rate steady, with USD/ARS advancing only modestly over the week, indicating no immediate need to adjust the pace of depreciation. Reserve gains, combined with the IMF disbursement, strengthen the external position and reduce pressure for tighter liquidity management. Industrial production and the trade surplus further support the view that activity is stabilizing without generating fresh price impulses. The data therefore point to a continued data-dependent stance at the next meeting, with scope for measured easing if subsequent prints remain soft.
| Date | Ctry | Event | Prior | Cons. | Actual |
|---|---|---|---|---|---|
| Tue 1 | AR | Tax Revenue Level | 22965.0bn | - | - |
Attention next week centers on the BCRA’s weekly foreign-exchange purchase report and any updates to reserve targets. Tax collection figures and industrial production data will provide further insight into fiscal and activity momentum. Market participants will also monitor Treasury debt auctions for real-yield signals that could influence domestic financing costs. Ongoing discussions around a potential differentiated FX window for mining exports remain a key variable for reserve accumulation in coming quarters. Global commodity prices will continue to shape export proceeds and the pace of reserve rebuilding. The absence of major scheduled releases leaves the focus on carry-trade flows and any comments from BCRA officials on the managed float. These elements together will inform expectations for the upcoming policy decision without altering the current data-dependent framework.
Rising household defaults after rapid expansion in bank lending could cap consumption and slow the recovery if credit standards tighten. Persistent services inflation remains a potential offset to the headline disinflation trend and may limit the scope for faster policy easing. External commodity volatility introduces upside risk to export revenues but also exposes the economy to sudden reversals in global demand. Fiscal consolidation under the IMF program continues to anchor credibility, yet any slippage in primary surpluses would quickly pressure reserve accumulation targets. The managed crawl has kept USD/ARS moves contained, yet any acceleration in parallel-market spreads could test BCRA intervention capacity in the period ahead.
| Asset | Level | WoW |
|---|---|---|
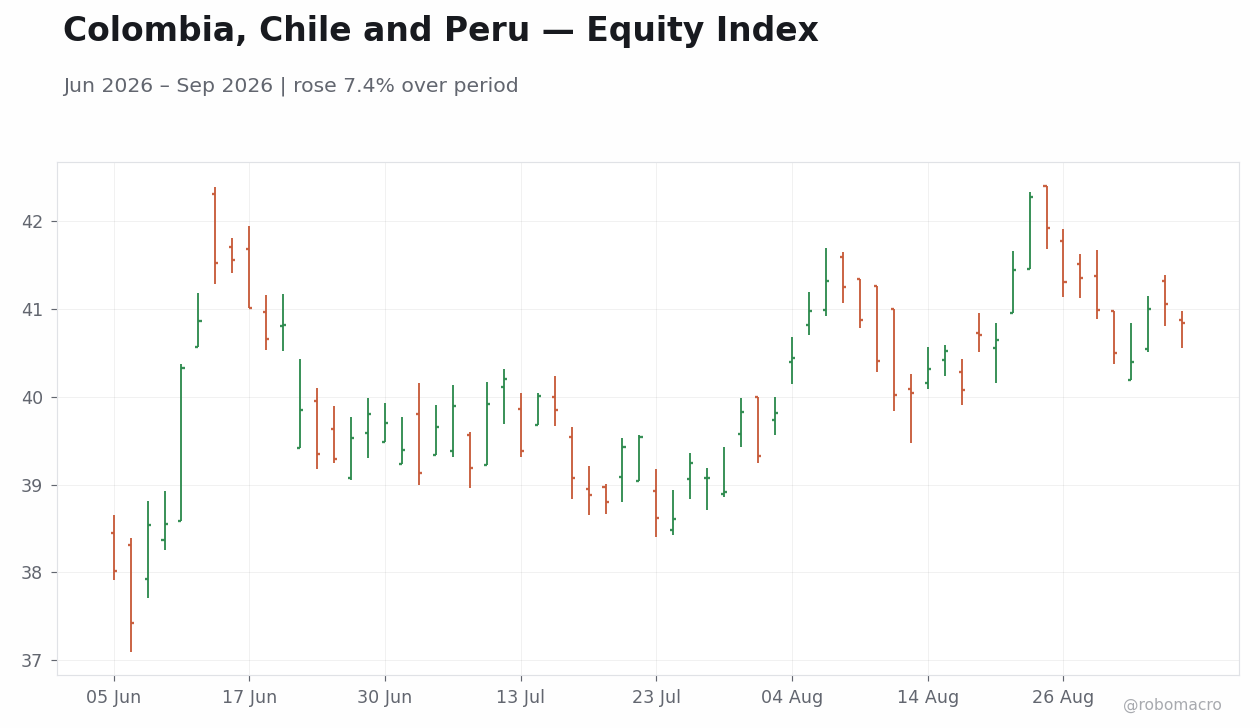
| MSCI Chile | 40.84 | +0.8% |
| MSCI Peru | 92.17 | +0.7% |
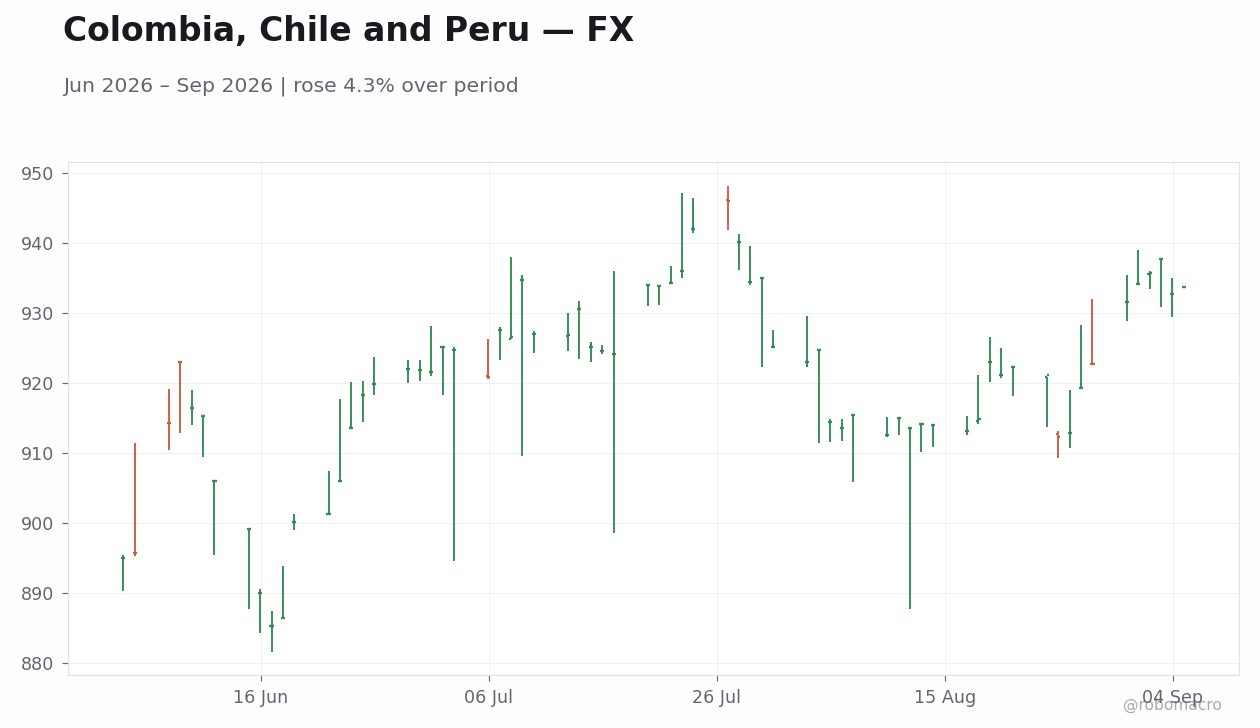
| USD/COP | 3131.76 | -2.2% |
| USD/CLP | 933.68 | +0.2% |
| USD/PEN | 3.35 | +1.6% |
| Copper | 6.68 | +1.4% |
| Gold | 4476.6 | +1.0% |
| Brent Crude | 96.28 | +6.4% |
| Bitcoin | 79929.76 | +2.9% |


Commodity price impulse dominates flows. Copper climbed to 6.68, lifting MSCI Chile 0.84 percent to 40.84 and MSCI Peru 0.67 percent to 92.17. Gold advanced 1.03 percent to 4,476.60, adding support to Peruvian export revenues. Brent crude’s 6.4 percent weekly gain to 96.28 provided modest fiscal breathing room for Colombia even as domestic political headlines intensified.
Fiscal slippage in Colombia overrides external support. The incoming administration’s announcement of a wider deficit and additional issuance triggered an initial USD/COP spike before the currency recovered to close 2.18 percent stronger at 3,131.76. MSCI Colombia remained flat, reflecting investor caution rather than outright selling.
Activity data absence leaves markets commodity-led. No Tier-1 releases occurred in Colombia, Chile or Peru. Chile’s July economic activity contraction from storms was noted in commentary but produced no official print. Peru’s trade surplus and Colombia’s industrial production figures also failed to appear, keeping price action tied to copper and oil moves.
Currency divergence widens across the bloc. USD/PEN rose 1.6 percent to 3.35 while USD/CLP edged 0.23 percent higher to 933.68. USD/COP’s net decline contrasted with the PEN’s daily jump, highlighting Peru’s greater sensitivity to external risk sentiment.
Policy rates stay anchored with no recalibration signals. Chile’s short-term rate held at 4.50 percent across all four trading days. The absence of BanRep or BCRP meetings or minutes left rate expectations unchanged, consistent with the data-dependent stance observed in prior weeks.
Equity indices post modest net gains despite volatility. MSCI Chile advanced to 40.84 after a 1.51 percent rally on September 2. MSCI Peru recovered to 92.17 on the same copper-driven session before giving back ground on September 4.
Lithium softness continues to weigh on Chile’s fiscal outlook. Lower lithium prices trimmed projected royalty income for state producers without altering output guidance. This offset some of the copper revenue uplift that accounts for roughly two-thirds of Chile’s export receipts.
Regional positioning remains light ahead of the next policy meetings. Thin domestic calendars and external commodity dependence kept volumes subdued. Bitcoin’s 2.91 percent weekly gain to 79,929.76 produced negligible spillovers into Andean assets.
BCCh maintained the short-term rate at 4.50 percent with no accompanying statement or speaker commentary during the week. The lack of fresh data prints left the central bank’s data-dependent posture intact, consistent with the pattern observed since the prior three meetings. BanRep and BCRP likewise issued no minutes or guidance, allowing the Colombian fiscal announcement and commodity price moves to set the tone for imported inflation risks. Copper’s advance to 6.68 and Brent’s rise to 96.28 reduced near-term pressure on external accounts for Chile and Peru, supporting the view that current policy rates remain appropriate until subsequent activity or inflation figures alter the balance. Officials across the three banks continued to emphasize incoming data over single-week commodity fluctuations when describing the path to upcoming decisions.
| Date | Ctry | Event | Prior | Cons. | Actual |
|---|---|---|---|---|---|
| Mon 31 | CL | Copper Production Year-ove | 5.1 | - | -9.4 |
| Mon 31 | CL | Industrial Production Year | 1.3 | - | -5.1 |
| Mon 31 | CL | Manufacturing Production Y | -3.2 | - | -4.9 |
| Mon 31 | CL | Retail Sales Month-over-Mo | 1.5 | - | -2.9 |
| Mon 31 | CL | Retail Sales Year-over-Yea | 5.1 | - | 2.2 |
| Mon 31 | CO | Unemployment Rate | 8.0 | - | 8.1 |
| Mon 31 | CO | Cement Production Year-ove | 4.3 | - | -4.5 |
| Tue 1 | CL | IMACEC Economic Activity Y | 2.4 | - | -1.5 |
| Tue 1 | CO | Davivienda Manufacturing P | 52.7 | - | 54.3 |
| Tue 1 | PE | Inflation Rate Month-over- | 0.29 | - | 0.07 |
| Tue 1 | PE | Inflation Rate Year-over-Y | 4.1 | - | 4.4 |
| Thu 3 | CO | Exports Year-over-Year | 7.0 | - | 5.9 |
| Fri 4 | CO | Producer Price Index Year- | 1.5 | - | 0.76 |
| Date | Release | Prior | Cons. |
|---|---|---|---|
| 2026-09-08 | Central Bank Interest Rate Decision | 4.5 | - |
| 2026-09-10 | Central Bank Interest Rate Decision | 4.2 | - |


The September 7–11 calendar contains no scheduled Tier-1 releases for Colombia, Chile or Peru, keeping attention on external commodity prints and any follow-up fiscal statements from Bogotá. Copper and gold price action will remain the primary drivers for Chilean and Peruvian current-account and royalty revenue expectations ahead of the next BCCh and BCRP meetings. Any comments from BanRep officials on the deficit and borrowing plan could influence COP volatility and imported inflation assessments. Global industrial production data from Germany and other DM economies on September 7 may provide indirect signals for copper demand relevant to Chile and Peru’s export outlook. Peru’s external accounts remain sensitive to further gold and copper volume updates even without domestic prints. Markets will monitor whether sustained Brent levels near 96.28 alter BanRep’s assessment of fiscal headroom before the next policy decision. Thin regional data flow reinforces the data-dependent stance across all three central banks until activity or inflation figures shift the balance for coming quarters.
Colombia’s fiscal disclosure raises the possibility of wider sovereign spreads if additional issuance coincides with softer Brent prices. Copper’s 1.35 percent weekly gain could reverse quickly if Chinese demand data disappoint, pressuring Chile and Peru equities that posted only modest net advances. PEN’s 1.6 percent depreciation highlights vulnerability to global risk-off episodes that could force BCRP reserve management commentary. The absence of domestic inflation prints leaves BanRep, BCCh and BCRP without fresh anchors, increasing the scope for commodity-driven revisions to rate-path expectations in either direction. Lithium price softness continues to erode Chile’s structural budget position even as copper provides partial offset. Overall, the week’s data flow supports a stable policy outlook but leaves upside risks to inflation from fiscal slippage in Colombia and downside risks to growth from any sustained commodity pullback.
| Asset | Level | WoW |
|---|---|---|
| FTSE 100 | 10831.1 | +0.4% |
| FTSE 250 | 24584.7 | +0.3% |
| GBP/USD | 1.35 | -0.2% |
| GBP/EUR | 1.16 | -0.5% |
| GBP/JPY | 210.61 | -2.9% |
| Brent Crude | 96.28 | +6.4% |
| Gold | 4476.6 | +1.0% |
| UK Nat Gas | 2.97 | +1.4% |
| Bitcoin | 79929.76 | +2.9% |


Housing activity weakens despite price resilience UK mortgage approvals declined in July, missing consensus and marking the weakest print since January 2024. Net mortgage lending contracted from the prior month. These figures reinforced subdued housing demand.
Consumer credit provides partial offset BoE consumer credit expanded, exceeding expectations and providing the clearest positive surprise of the week. The divergence between credit and mortgage flows highlighted uneven household borrowing patterns.
Policy communication stays measured Governor Bailey’s speech flagged AI-related productivity and financial-stability risks without altering the Bank’s data-dependent stance on the policy rate. The addition of stablecoin oversight to the mandate shifted attention toward digital-money supervision rather than near-term rate signals.
Equity and gilt markets absorb mixed prints The FTSE 100 closed the week higher, while the 10-year gilt yield declined mid-week. Sterling finished lower against the dollar.
Commodity impulse adds external pressure Brent crude’s advance introduced fresh imported-price considerations that echoed earlier energy-driven vigilance.
Governor Bailey’s remarks highlighted AI-driven downturn risks and the Bank’s new stablecoin mandate without providing fresh forward guidance on the policy rate. The week’s housing and credit data left the medium-term rate path unchanged from the data-dependent stance maintained through the prior three weeks. Consumer-credit strength offered limited counterweight to the mortgage-approvals miss, keeping the balance of risks tilted toward slower household spending. No speakers altered the message that incoming figures will determine the timing of any further adjustment. Markets therefore continue to price policy-rate decisions solely on subsequent releases rather than on single-week surprises. The construction PMI will supply the next direct read on activity momentum feeding into the Bank’s assessment.
Nationwide house prices rose month-over-month in August, beating consensus, yet the year-over-year rate eased against expectations and confirmed the cooling annual trend. Mortgage approvals missed consensus and represented the largest downside surprise, aligning with earlier soft momentum. Consumer credit exceeded forecast, offering the only material beat and suggesting selective household borrowing resilience. Mortgage lending extended its contraction. These housing and credit outcomes together point to below-trend real-activity momentum that leaves the Bank of England on its established data-dependent path for the policy rate. The construction PMI will next test whether building-sector weakness has stabilised. Overall, the releases reinforce the mid-cycle configuration in which single-week misses do not yet alter the medium-term rate outlook.
| Date | Ctry | Event | Prior | Cons. | Actual |
|---|---|---|---|---|---|
| Mon 31 | GB | BRC Shop Price Inflation L | 0.90 | - | 1.5 |
| Tue 1 | GB | BoE Consumer Credit Level | 1.8bn | - | 2.0bn |
| Tue 1 | GB | Mortgage Approvals Level | 58K | - | 56K |
| Tue 1 | GB | Mortgage Lending Level | 7.7bn | - | 4.3bn |
| Tue 1 | GB | M4 Money Supply Month-over | 0.80 | - | -0.30 |
| Tue 1 | GB | Net Lending to Individuals | 9.5bn | - | 6.3bn |
| Tue 1 | GB | S&P Global Manufacturing P | 51.9 | 51.5 | 51.7 |
| Thu 3 | GB | Composite PMI Final | 52.2 | 52.5 | 52.5 |
| Thu 3 | GB | Services PMI Final | 52.1 | 52.8 | 52.5 |
| Thu 3 | GB | UK Index-Linked Treasury G | - | - | 2.5 |
| Fri 4 | GB | New Car Sales Year-over-Ye | 11.7 | - | 13.7 |
| Fri 4 | GB | S&P Global Construction PM | 44.7 | - | 44.3 |
| Fri 4 | GB | DMP 1Y Consumer Price Inde | 3.0 | - | 3.1 |
| Fri 4 | GB | DMP 3M Output Price Expect | 3.9 | - | 3.8 |
| Date | Release | Prior | Cons. |
|---|---|---|---|
| 2026-09-07 | Lloyds House Price Index Month-over | 0 | - |
| 2026-09-07 | Lloyds House Price Index Year-over- | 0.10 | - |
| 2026-09-07 | BRC Retail Sales Monitor Year-over- | 1.0 | - |
| 2026-09-09 | RICS House Price Balance | -30.0 | - |
| 2026-09-11 | GDP Month-over-Month | 0.30 | - |
| 2026-09-11 | GDP 3-Month Avg Level | 0.40 | - |
| 2026-09-11 | Goods Trade Balance | -23.0bn | - |
| 2026-09-11 | Goods Trade Balance Non-Eu | -10.4bn | - |
| 2026-09-11 | Industrial Production Month-over-Mo | -0.20 | - |
| 2026-09-11 | Manufacturing Production Month-over | -0.50 | - |


Monday brings the Lloyds House Price Index month-over-month and the BRC Retail Sales Monitor year-over-year. Wednesday features the RICS House Price Balance. Friday delivers the high-impact GDP month-over-month print, alongside industrial production month-over-month and manufacturing production. The goods trade balance is also due. These releases will test whether the July housing weakness has extended into broader activity and will shape expectations for the Bank of England’s next policy meeting. No additional Bank speakers are scheduled, leaving the data flow as the dominant catalyst. Markets will watch for any revision to the three-month GDP average level.
The sharp mortgage-approvals miss raises downside risks to household spending that could extend the slow-lane growth profile observed in prior weeks. Upside surprises in consumer credit and house prices month-over-month suggest selective resilience that may limit the extent of any further softening. Brent’s advance introduces renewed imported-price pressure that could keep the Bank of England vigilant even as activity data disappoint. Positioning remains light ahead of next week’s GDP release, with limited evidence of crowded trades in sterling or gilts. Volatility in GBP/JPY signals sensitivity to external rate differentials. Any further downside surprise in industrial production could reinforce expectations for a prolonged data-dependent hold on the policy rate.
The FTSE 100 ended higher on the week, while the FTSE 250 gained. The 10-year gilt yield declined mid-week. GBP/USD finished lower week-over-week, and GBP/JPY fell. Brent crude rose, providing the dominant commodity driver, while gold advanced. Daily moves included a FTSE 100 rebound after the mixed housing data and a drop in GBP/JPY amid broader sterling softening. These price actions reflected positioning ahead of next week’s GDP and industrial-production releases rather than any shift in Bank of England expectations.
Brent crude’s weekly gain reversed part of the prior period’s decline and added imported-price considerations for net-energy importers including the United Kingdom. US activity data from the prior week continued to illustrate the mid-phase expansion without prompting immediate policy recalibration elsewhere. Eurozone inflation stability and German wholesale-price expectations remained consistent with the ECB’s data-dependent deposit-rate stance. These cross-border developments reinforce the external backdrop against which UK housing and credit prints are assessed.
| Asset | Level | WoW |
|---|---|---|
| OMX Stockholm 30 | 3284.08 | -0.8% |
| Oslo Bors | 2103.63 | -0.7% |
| OMX Copenhagen 25 | 1912.14 | +0.0% |
| OMX Helsinki 25 | 6454.82 | +0.2% |
| USD/SEK | 9.56 | -0.4% |
| USD/NOK | 9.28 | -0.9% |
| EUR/SEK | 11.12 | -0.1% |
| EUR/NOK | 10.8 | -0.4% |
| Brent Crude | 96.28 | +6.4% |
| Gold | 4476.6 | +1.0% |
| Bitcoin | 79929.76 | +2.9% |


GDP Resilience in Sweden Sweden Q2 GDP beat expectations, confirming a stronger growth trajectory than earlier industrial output signals had suggested.
Labor Market and Currency Pressure in Norway Norway August unemployment rose, lifting near-term rate-cut expectations and contributing to USD/NOK moving lower.
Equity and Yield Divergence Across Nordics OMX Stockholm 30 ended the week at 3284.08 after a 0.76% weekly decline while Oslo Bors closed at 2103.63, down 0.68%; OMX Copenhagen 25 finished at 1912.14, essentially flat at +0.01%.
Inflation Anchors and Policy Signals Sweden and Norway July CPI prints left Riksbank and Norges Bank with contrasting inflation backdrops.
Commodity Support for Norway Brent crude advanced to 96.28, up 6.4% over the week, providing fiscal tailwinds for Norway while Nordic equities showed mixed responses to the move.
Fixed-Income and External Flows Sweden 10Y yield held steady while Norway 10Y yield remained unchanged; USD/SEK closed at 9.56 after a 0.44% weekly decline amid limited domestic data.
Quiet Calendar and External Drivers No major Nordic releases occurred between August 31 and September 4, so markets absorbed the GDP beat, unemployment rise, and Norges Bank sales announcement without fresh prints to alter positioning.
Cross-Border Equity Performance OMX Helsinki 25 closed at 6454.82, up 0.2% weekly, while broader Nordic indices reflected selective resilience tied to energy prices rather than synchronized regional momentum.
Data-Dependent Equilibrium Persists The configuration left central banks data-dependent, with the prior three weeks’ pattern of absorbing mixed activity signals extending into this period.
Riksbank officials highlighted that inflation risks have increased slightly while retaining policy flexibility after Sweden July CPI. Norges Bank announced a shift to net NOK sales for September on oil-fund flows, marking a clear change from prior purchases. Nordea revised its forecast to include 25bp Riksbank hikes in November and February 2027, citing Sweden’s better-than-normal economic performance and the Q2 GDP print. Norway July CPI and the August unemployment rise together point to a more dovish Norges Bank path relative to Riksbank. Danmarks Nationalbank and Bank of Finland (ECB) remained on hold, with no domestic data altering their alignment to euro-area developments. The week’s releases reinforced a data-dependent stance across all four central banks without immediate parameter shifts.
| Date | Ctry | Event | Prior | Cons. | Actual |
|---|---|---|---|---|---|
| Mon 31 | DK | Unemployment Rate | 2.7 | - | 2.7 |
| Mon 31 | DK | Treasury Bill Auction | - | - | - |
| Mon 31 | NO | Norwegian Treasury Bill (N | - | - | - |
| Tue 1 | FI | Harmonised Inflation Rate | - | - | -0.40 |
| Tue 1 | FI | Harmonised Inflation Rate | - | - | 2.4 |
| Tue 1 | SE | Swedbank Manufacturing PMI | 55.8 | - | 56.1 |
| Tue 1 | SE | Treasury Bill Auction | - | - | - |
| Wed 2 | NO | Current Account Balance | 266.8bn | - | 279.0bn |
| Wed 2 | NO | Norwegian Government Bond | - | - | - |
| Wed 2 | SE | Swedish Government Bond (S | - | - | - |
| Wed 2 | DK | Foreign Exchange Reserves | 699.6bn | - | 693.6bn |
| Thu 3 | SE | Services PMI Index | 54.2 | - | 55.8 |
| Thu 3 | NO | House Price Index Month-ov | -1.1 | - | 0.80 |
| Thu 3 | NO | House Price Index Year-ove | 2.2 | - | 2.6 |

Monday features Norway Manufacturing Production Month-over-Month and German Industrial Production Month-over-Month, both low-to-medium impact prints that will feed into Norges Bank and ECB assessments of manufacturing momentum. Tuesday brings limited Nordic releases, leaving markets to monitor any follow-up Riksbank or Norges Bank commentary on the prior week’s GDP and unemployment data. Wednesday includes no scheduled high-impact events for Sweden, Norway, Denmark or Finland, so attention will center on external euro-area and oil-price developments. Thursday offers another quiet session with no major Nordic calendar items, keeping focus on how Sweden Q2 GDP and rising Norway unemployment translate into upcoming decisions. Friday completes the week with no domestic releases, allowing positioning to hinge on global commodity moves and any cross-border yield signals. Overall, the light schedule sustains the data-dependent equilibrium for the next meeting across Riksbank, Norges Bank, Danmarks Nationalbank and Bank of Finland (ECB).
The Sweden Q2 GDP beat shifts the growth outlook toward greater resilience and raises the possibility of earlier Riksbank tightening than previously anticipated. Norway’s rising unemployment and Norges Bank NOK sales introduce downside risks to the krone and support a more dovish rate path relative to Sweden. Brent crude at 96.28 after a 6.4% weekly gain could amplify fiscal revenues for Norway yet also feed imported inflation pressures across the region if sustained. Diverging July CPI prints highlight the risk that policy paths decouple further in coming quarters. Markets appear to underweight the Nordea hike revision and the quiet calendar’s implication that external drivers will dominate near-term rate expectations.
| Asset | Level | WoW |
|---|---|---|
| BIST 100 | 14012.4 | -2.2% |
| iShares Poland | 45.12 | +2.3% |
| EUR/PLN | 4.31 | -0.6% |
| EUR/HUF | 361.83 | -0.8% |
| EUR/CZK | 24.16 | +0.2% |
| USD/TRY | 48.42 | +0.4% |
| Brent Crude | 96.28 | +6.4% |
| Gold | 4476.6 | +1.0% |
| Bitcoin | 79926.71 | +2.9% |


Inflation prints dominate Poland narrative. Poland’s preliminary August CPI accelerated year-over-year, exceeding consensus and the prior reading. The overshoot reinforced concerns that domestic price pressures remain stickier than expected even as external energy costs rose. Markets priced the data as keeping NBP on hold through the near term.
Turkey growth data splits on quarterly versus annual basis. Turkey reported Q2 GDP growth accelerating from the prior pace on a quarter-over-quarter basis, yet the year-over-year rate printed below consensus. Unemployment rose, signaling labor-market softening alongside the modest expansion. The combination left CBRT credibility under scrutiny ahead of the September decision.
Regional yields compress on fiscal and allocation news. Poland 10-year government yields fell while Hungary 10-year yields declined, supported by near-complete allocation of EU recovery funds and record foreign investor share on the Warsaw Stock Exchange. Equity markets diverged sharply, with BIST 100 closing the week at 14012.40 after a 2.24% decline and iShares Poland advancing 2.31% to 45.12. EUR/PLN eased 0.63% to 4.31 while EUR/HUF finished at 361.83 after a 0.80% weekly decline. Brent crude’s 6.4% advance to 96.28 added imported-inflation pressure across the net-energy importers. Gold rose 1.03% to 4476.60, providing a modest hedge for regional portfolios. The week’s data flow therefore sustained a data-dependent equilibrium for all five central banks without immediate shifts in forward guidance.
NBP, CNB, MNB, BNR and CBRT all maintained unchanged forward guidance through the week, with no policy meetings or minutes released. The Polish CPI overshoot reinforced the data-dependent stance articulated in prior NBP communications, keeping the policy rate path on hold. CBRT faces renewed scrutiny after the year-over-year GDP miss and unemployment print, yet official guidance continues to emphasize inflation control without immediate adjustment signals. CNB, MNB and BNR speakers remained silent on new forward guidance, consistent with the regional pattern of absorbing mixed prints without recalibration. The Turkish data flow suggests CBRT may extend its hold through the next decision while monitoring whether the quarterly GDP acceleration alters the disinflation trajectory. Overall, the week’s releases left medium-term rate paths anchored to incoming inflation and activity figures rather than any shift in rhetoric.
Poland’s August CPI print represented the clearest beat versus consensus, widening the gap from the prior reading and highlighting persistent services and food price momentum. The overshoot arrives ahead of the NBP decision and suggests core inflation may remain above target through year-end. Turkey’s Q2 GDP showed quarter-over-quarter acceleration from the prior print but missed the year-over-year consensus, while unemployment rose, pointing to softening labor demand despite the quarterly rebound. These prints together indicate Turkey remains in a below-trend growth phase with elevated price pressures still requiring CBRT vigilance. No high-impact releases emerged from the Czech Republic, Hungary or Romania, leaving the regional cycle assessment anchored to the Polish and Turkish data. The combination of Polish CPI upside and Turkish GDP annual miss reinforces a divergent outlook where Poland faces re-anchoring risks and Turkey contends with growth-inflation trade-offs. Markets interpreted the data as extending the hold path for both NBP and CBRT without altering medium-term rate expectations materially.
| Date | Ctry | Event | Prior | Cons. | Actual |
|---|---|---|---|---|---|
| Mon 31 | HU | Producer Price Index Year- | -0.40 | - | 1.0 |
| Mon 31 | PL | Inflation Rate Year-over-Y | 3.0 | - | 3.4 |
| Mon 31 | PL | GDP Growth Quarter-over-Qu | 0.60 | 0.90 | 1.0 |
| Mon 31 | PL | GDP Growth Year-over-Year | 3.5 | 3.8 | 3.9 |
| Mon 31 | PL | Inflation Rate Month-over- | 0.80 | - | 0.40 |
| Mon 31 | CZ | M3 Money Supply Year-over- | 6.3 | - | 5.7 |
| Tue 1 | RO | Unemployment Rate | 6.3 | - | 6.4 |
| Tue 1 | HU | GDP Growth Quarter-over-Qu | 0.80 | - | 0.50 |
| Tue 1 | HU | GDP Growth Year-over-Year | 1.7 | 1.7 | 1.7 |
| Tue 1 | HU | HALPIM Manufacturing PMI I | 51.4 | - | 51.3 |
| Tue 1 | PL | S&P Global Manufacturing P | 49.0 | - | 48.3 |
| Tue 1 | CZ | S&P Global Manufacturing P | 52.2 | - | 54.1 |
| Tue 1 | HU | 3-Month Hungarian Discount | - | - | 5.2 |
| Wed 2 | RO | Producer Price Index Year- | 12.7 | - | 8.8 |

Poland’s central bank interest rate decision on September 9 carries a consensus hold, with markets focused on whether the August CPI print alters the NBP’s assessment of the inflation trajectory. Turkey’s TCMB decision on September 10 is also expected to hold the policy rate, though August inflation data due earlier in the week will be scrutinized for any reacceleration. Romania releases second-estimate Q2 GDP on September 7, with consensus pointing to a modest annual contraction. Turkey industrial production YoY prints on September 10, providing the first post-GDP gauge of manufacturing momentum. Hungary and Czech Republic calendars remain light, leaving regional focus on the two central bank decisions and any follow-through from Polish and Turkish data. ECB speakers may offer indirect signals for CNB and MNB positioning. The releases matter because they will test whether the prior week’s inflation overshoot and growth miss shift near-term policy expectations.
The Polish CPI beat raises upside risks to the inflation outlook and could delay any future NBP easing if subsequent prints remain elevated. Turkey’s combination of quarterly GDP strength and annual miss plus rising unemployment creates downside growth risks that may pressure CBRT credibility if inflation fails to moderate. Brent’s weekly advance to 96.28 amplifies imported-inflation exposure for all five economies and could widen current-account pressures. Positioning appears light in regional FX after the modest zloty and forint moves, leaving room for volatility if next-week central bank decisions surprise. Market mispricing signals center on whether the Polish yield compression fully reflects the CPI upside or anticipates fiscal support from EU funds. Upside scenarios include sustained foreign inflows into Polish assets; downside scenarios feature further BIST 100 weakness if Turkish inflation reaccelerates.
Equities diverged with BIST 100 declining 2.24% to close at 14012.40 while iShares Poland advanced 2.31% to 45.12 on foreign inflows. Bonds saw sharp compression as Poland 10-year yields fell and Hungary 10-year yields dropped. FX markets delivered modest zloty strength with EUR/PLN closing at 4.31 after a 0.63% weekly decline, while EUR/HUF eased 0.80% to 361.83 and EUR/CZK rose 0.18% to 24.16. USD/TRY edged 0.36% higher to 48.42. Commodities provided the clearest catalyst, with Brent crude rising 6.4% to 96.28 and gold advancing 1.03% to 4476.60. Daily moves included a 1.25% BIST 100 decline on September 2 and a 1.28% iShares Poland gain on September 4, both tied to the inflation and GDP releases.
Brent crude’s advance to 96.28 over the past seven days added direct imported-cost pressure to the net-energy importers in the region. US August jobs data raised the prospect of delayed Federal Reserve easing, supporting broader USD strength that weighed on EM FX. Gold’s gain to 4476.60 reflected ongoing hedge demand amid the commodity impulse. Trade and geopolitical spillovers remained contained within the last seven days, with no new EU-Russia visa developments altering near-term flows into Poland. The configuration leaves regional central banks absorbing external price pressure without immediate cross-border policy contagion.
| Asset | Level | WoW |
|---|---|---|
| JSE Top 40 | 109270.1 | +0.5% |
| USD/ZAR | 15.95 | -1.4% |
| EUR/ZAR | 18.51 | -1.2% |
| Platinum | 1826.0 | +2.1% |
| Gold | 4476.6 | +1.0% |
| Brent Crude | 96.28 | +6.4% |
| Naspers | 75392.0 | -4.3% |
| Bitcoin | 79926.72 | +2.9% |


Trade balance resilience South Africa recorded an August trade surplus that exceeded the prior reading and reflected stronger mining and manufactured goods exports. The print arrived alongside M3 money supply growth slowing to 8.57 percent year-over-year and private sector credit expanding 7.41 percent, both below earlier levels.
Equity and currency price action The JSE Top 40 advanced 0.47 percent week-over-week to close at 109270.1, supported by a 2.1 percent gain in platinum to 1826.0 and a 1.03 percent rise in gold to 4476.6. Naspers declined 4.34 percent over the same period to 75392.0, weighing on the benchmark. USD/ZAR eased 1.35 percent to 15.95 while EUR/ZAR fell 1.24 percent to 18.51, consistent with rand firmness against external flows.
Commodity and fixed-income backdrop Brent crude rose 6.4 percent to 96.28, lifting energy-linked revenues, while the South Africa short-term rate remained at 7.00 percent and the long-term rate held at 8.70 percent. No consensus misses occurred on scheduled releases, and the data flow reinforced external account stability without challenging prior growth expectations.
Absence of domestic catalysts With no SARB speakers or inflation prints during the week, price action stayed tied to global commodity moves and the widening trade surplus. The configuration left the growth cycle narrative unchanged from the prior three weeks of mid-phase expansion.
The South African Reserve Bank maintained the policy rate at 7.00 percent throughout the week with no minutes, speeches, or forward guidance updates released. August trade data showing a wider surplus and slower M3 growth at 8.57 percent year-over-year supplied no immediate signal for parameter shifts ahead of the next meeting. Private sector credit expansion of 7.41 percent remained contained, aligning with the data-dependent approach observed in prior periods. Officials have continued to tie decisions to incoming activity and price prints rather than single-week external balance figures. The absence of new communications left the rate path anchored to subsequent GDP and inflation releases.
| Date | Ctry | Event | Prior | Cons. | Actual |
|---|---|---|---|---|---|
| Mon 31 | ZA | M3 Money Supply Year-over- | 9.3 | - | 8.6 |
| Mon 31 | ZA | Private Sector Credit Year | 7.8 | - | 7.4 |
| Mon 31 | ZA | 182-Day Treasury Bill Auct | - | - | - |
| Mon 31 | ZA | 273-Day Treasury Bill Auct | - | - | - |
| Mon 31 | ZA | 364-Day Treasury Bill Auct | - | - | - |
| Mon 31 | ZA | 91-Day Treasury Bill Aucti | - | - | - |
| Tue 1 | ZA | ABSA Manufacturing PMI Ind | 46.8 | - | 45.8 |
| Tue 1 | ZA | Weekly Bond Auction | - | - | - |
| Tue 1 | ZA | Total New Vehicle Sales Le | 58K | - | 58K |
| Thu 3 | ZA | S&P Global PMI Index | 50.3 | - | 50.5 |
| Thu 3 | ZA | Business Confidence | 39.0 | - | - |
| Date | Release | Prior | Cons. |
|---|---|---|---|
| 2026-09-08 | GDP Growth Quarter-over-Quarter | 0.50 | - |
| 2026-09-08 | GDP Growth Year-over-Year | 1.9 | - |


Attention centers on the September 8 release of GDP growth quarter-over-quarter and year-over-year. Markets will assess whether the figures alter the balance of risks for the upcoming South African Reserve Bank decision. No other domestic indicators are scheduled between September 7 and September 11, leaving external commodity prices and global risk sentiment as the dominant drivers of rand flows. Stronger-than-expected GDP would reinforce the current policy rate setting while softer prints could heighten focus on growth support in coming quarters. Load-shedding updates from Eskom may also influence industrial production expectations ahead of the next meeting. The data-dependent framework implies officials will absorb the prints without immediate recalibration unless inflation or activity trends diverge materially from recent patterns.
The wider trade surplus and Brent advance to 96.28 reduce near-term external financing pressure but leave the outlook sensitive to any reversal in commodity prices. Manufacturing sentiment deterioration noted mid-week highlights downside risks to industrial output if load-shedding persists. Upside scenarios center on sustained gold and platinum gains supporting the JSE Top 40 above 109000, while downside cases involve renewed rand weakness if global dollar strength reasserts. The data flow has not shifted the multi-week mid-phase expansion narrative, yet the market continues to underweight the potential for persistent energy constraints to weigh on second-half growth.
| Asset | Level | WoW |
|---|---|---|
| ASX 200 | 9005.9 | -0.8% |
| NZX 50 | 13974.18 | +0.4% |
| AUD/USD | 0.72 | +0.5% |
| NZD/USD | 0.59 | -0.6% |
| AUD/NZD | 1.22 | +1.2% |
| BHP | 62.25 | -3.9% |
| Gold | 4476.6 | +1.0% |
| Brent Crude | 96.28 | +6.4% |
| Bitcoin | 79937.94 | +2.9% |


GDP Resilience Offsets Domestic Weakness Australia’s Q2 GDP beat consensus on both a quarter-over-quarter and year-over-year basis, driven by net exports that more than compensated for subdued household consumption. Company gross profits rebounded after a prior contraction, while building permits declined less than forecast. The Ai Group Industry Index improved, confirming a narrower contraction in manufacturing sentiment.
Policy Divergence Emerges New Zealand ANZ Business Confidence eased ahead of the RBNZ decision, yet the central bank still raised the OCR. The NZX 50 advanced on the day of the hike before closing the week modestly higher. In contrast, the ASX 200 slipped mid-week and ended lower.
Commodity Support and Currency Moves Brent crude climbed while gold rose, lifting BHP shares intraday before the stock closed the week lower. AUD/USD finished higher for the week, while NZD/USD declined and AUD/NZD widened. The Australian 10-year yield held steady and NZ short-term rates remained unchanged.
Data Arc Confirms External Strength The week’s releases showed external demand continuing to anchor Australian growth even as domestic indicators such as Westpac Consumer Confidence and private-sector credit growth pointed to slower momentum. Overall, the data flow reinforced a two-speed ANZ picture without altering the broader mid-phase expansion narrative observed in prior weeks.
The RBNZ raised the OCR and signalled that inflation still required tighter settings, with the subsequent press conference adopting a cautious tone on the persistence of price pressures. Australian Q2 GDP prompted three RBA speakers—Jones, Brischetto and Hunter—to address the implications for the policy rate path over coming quarters. The stronger net-export contribution and narrower Ai Group contraction together suggest the RBA will continue to monitor external demand and commodity revenues before adjusting the cash rate. RBNZ forward guidance emphasised data dependence, leaving the timing of any further moves open to subsequent inflation and activity prints. The Australian trade surplus reinforced the case for sustained external support, which officials noted could influence the balance of risks around the next policy decisions.
| Date | Ctry | Event | Prior | Cons. | Actual |
|---|---|---|---|---|---|
| Mon 31 | AU | S&P Global Manufacturing P | 52.0 | - | 52.0 |
| Mon 31 | AU | Building Permits Month-ove | 7.2 | - | - |
| Mon 31 | AU | Building Permits Year-over | 8.9 | - | - |
| Mon 31 | AU | Current Account Balance | -27.1bn | - | - |
| Mon 31 | AU | Net Exports Contribution t | -0.80 | - | - |
| Mon 31 | AU | Private House Approvals Mo | - | - | - |
| Mon 31 | NZ | 1-Year Treasury Bill Aucti | - | - | - |
| Mon 31 | NZ | 3-Month Treasury Bill Auct | - | - | - |
| Mon 31 | NZ | 6-Month Treasury Bill Auct | - | - | - |
| Tue 1 | AU | Commodity Prices Year-over | 15.4 | - | 15.5 |
| Tue 1 | NZ | Building Permits Month-ove | -3.6 | - | -4.3 |
| Tue 1 | AU | Ai Group Industry Index | -29.9 | - | -3.5 |
| Tue 1 | AU | Ai Group Construction Inde | -40.6 | - | -6.9 |
| Tue 1 | AU | Ai Group Manufacturing Ind | -19.6 | - | -16.6 |
| Date | Release | Prior | Cons. |
|---|---|---|---|
| 2026-09-08 | Westpac Consumer Confidence Change | 6.0 | - |
| 2026-09-08 | Westpac Consumer Confidence Index | 88.9 | - |
| 2026-09-08 | NAB Business Confidence Index | -6.0 | - |
| 2026-09-10 | Business NZ PMI Index | 54.3 | - |


Monday brings Westpac Consumer Confidence Change and Index releases that will update household sentiment after the Q2 GDP beat. Tuesday features the NAB Business Confidence Index, which markets will compare with the prior Ai Group reading to gauge business conditions. Wednesday includes an RBA Hunter speech that may elaborate on the reaction function following the GDP outcome. Thursday hosts an RBA Hauser speech focused on inflation dynamics. Friday delivers the Business NZ PMI Index, providing the first post-hike gauge of New Zealand activity. These releases will inform assessments of whether domestic demand is softening enough to alter the rate path at upcoming decisions or whether external resilience will keep policy on hold through coming quarters. The sequence will also test whether commodity-driven surpluses continue to offset softer consumer readings.
Brent crude introduces upside inflation risks that could delay easing at both central banks if the energy impulse persists into coming quarters. A further softening in Westpac Consumer Confidence or NAB Business Confidence would widen the gap between external and domestic momentum, raising downside growth scenarios for Australia. NZD weakness after the OCR increase may amplify imported inflation, shifting the RBNZ’s balance of risks. The ASX 200’s weekly decline alongside gold strength signals selective positioning that could amplify volatility around next week’s confidence prints. Overall, the data arc leaves limited room for near-term policy recalibration unless activity indicators deteriorate materially.
| Asset | Level | WoW |
|---|---|---|
| Shanghai Composite | 3930.12 | -1.4% |
| Hang Seng | 25650.87 | +0.3% |
| TAIEX | 46551.13 | +0.9% |
| USD/CNY | 6.71 | -0.2% |
| USD/HKD | 7.84 | +0.0% |
| Copper | 6.68 | +1.4% |
| Brent Crude | 96.28 | +6.4% |
| Gold | 4476.6 | +1.0% |
| Bitcoin | 79940.25 | +2.9% |

Manufacturing indicators diverged by survey source. Official manufacturing activity remained in contraction but at a slower pace, while the private manufacturing survey crossed into expansion territory with new orders improving. Non-manufacturing activity stayed soft.
Equity markets showed limited follow-through despite the PMI beats. Shanghai Composite declined while CSI 300 closed lower on bond supply concerns. Hang Seng Index rose and TAIEX advanced on semiconductor export visibility.
Yuan fix remained stable amid external pressure. PBoC maintained the daily central parity near recent levels with USD/CNY closing lower on the week. HKMA reported steady aggregate balance and deposit growth, reinforcing peg mechanics.
Commodity proxies reflected mixed growth signals. Copper and Brent crude advanced on stimulus expectations and energy market moves, while gold rose. Cross-strait trade flows showed resilience in semiconductor orders.
PBoC maintained the daily USD/CNY central parity without adjustment to liquidity operations. HKMA reported deposit growth and steady foreign reserves, supporting the peg. CBC maintained its steady-rate bias amid semiconductor export order growth. No speakers or minutes altered forward guidance, leaving the policy rate path data-dependent after the mixed PMI outcomes. The August PMI beats reduce immediate pressure for aggressive easing while keeping LPR adjustments in play should services data weaken further. Bond issuance acceleration reinforced the focus on liquidity management rather than outright rate changes. Cross-border yuan usage expansion in Hong Kong’s five-year plan provides an additional channel for policy transmission without altering the near-term rate outlook.
Manufacturing surveys diverged, with the official gauge indicating slower contraction and the private reading moving into expansion on improved new orders. Non-manufacturing activity remained soft. Services momentum extended in the private survey. The prints together suggest uneven sectoral momentum rather than broad acceleration. The data leave the PBoC on a data-dependent path for any RRR or MLF adjustments. Inflation and external demand releases scheduled for next week will clarify whether the PMI stabilization feeds into sustained growth or remains survey-specific. Trade balance and CPI figures due next week will update the cycle position ahead of any policy recalibration.
| Date | Ctry | Event | Prior | Cons. | Actual |
|---|---|---|---|---|---|
| Mon 31 | HK | Retail Sales Year-over-Yea | 2.3 | - | 2.3 |
| Mon 31 | TW | S&P Global Manufacturing P | 55.1 | - | - |
| Mon 31 | CN | Ratingdog Manufacturing PM | 50.9 | - | - |
| Wed 2 | HK | S&P Global PMI Index | 51.0 | - | - |
| Wed 2 | CN | Ratingdog Services PMI Ind | 50.4 | - | - |
| Wed 2 | CN | Ratingdog Composite PMI In | 50.8 | - | - |
| Fri 4 | TW | Foreign Exchange Reserves | 594.3bn | - | 601.9bn |
| Fri 4 | HK | Foreign Exchange Reserves | 447.8bn | - | - |
| Date | Release | Prior | Cons. |
|---|---|---|---|
| 2026-09-07 | Exports Year-over-Year | 23.9 | - |
| 2026-09-07 | Imports Year-over-Year | 27.5 | - |
| 2026-09-07 | Trade Balance | 112.5bn | - |
| 2026-09-08 | Inflation Rate Year-over-Year | 0.50 | - |
| 2026-09-08 | Inflation Rate Month-over-Month | -0.10 | - |
| 2026-09-08 | Producer Price Index Year-over-Year | 3.5 | - |
Trade balance, exports, and imports data due next week will gauge external demand resilience. CPI and PPI releases will update the inflation trajectory and clarify whether manufacturing stabilization feeds into price pressure. No central bank meetings are scheduled, though PBoC reverse-repo operations and liquidity signals will remain in focus ahead of further bond supply. HKMA aggregate balance and USD/HKD dynamics stay relevant for peg stability. CBC watchers will monitor any semiconductor export commentary. The data flow will inform positioning ahead of the following week.
The PMI divergence between official and private surveys raises the risk that stabilization remains narrow rather than broad-based, potentially capping equity upside. Accelerated government bond issuance could pressure liquidity and keep yields from compressing further. Brent crude’s advance introduces imported inflation risks for net-energy importers, though copper’s gain supports selective growth proxies. Positioning appears light after the mixed equity moves, with limited follow-through buying noted in mainland markets. Upside scenario centers on stronger-than-expected trade and CPI prints confirming cycle resilience; downside centers on services PMI reversion and renewed yuan pressure. Volatility in offshore yuan remains suppressed, reducing immediate revaluation risks.
Shanghai Composite declined while CSI 300 closed lower on September 4, pressured by government bond supply concerns. Hang Seng Index rose and TAIEX gained on semiconductor order strength. USD/CNY declined after PBoC fixes held steady. Copper and Brent crude advanced, while gold rose. Bitcoin finished higher for the week. Fixed-income markets showed no material yield moves in the provided data, with liquidity operations remaining the dominant PBoC tool.
US August jobs report added positions, beating expectations and raising near-term rate-hike odds that could widen external differentials versus the PBoC path. Trump tariffs and Iran-related energy tensions were cited by Beijing as damaging to global growth ahead of any Xi-Trump summit. Hong Kong’s five-year plan emphasis on offshore yuan usage aligns with cross-border investment flows from the mainland. Brent crude’s advance reflects the renewed energy impulse seen in prior weeks, supporting commodity-linked EM performance while pressuring net importers. No fresh US export-control measures on advanced packaging emerged in the last seven days, leaving Taiwan semiconductor orders as the dominant positive spillover.
| Asset | Level | WoW |
|---|---|---|
| KOSPI | 6687.21 | -1.9% |
| KOSDAQ | 813.5 | -2.5% |
| USD/KRW | 1345.99 | -2.3% |
| Samsung | 255500.0 | -1.7% |
| SK Hynix | 1647000.0 | -1.6% |
| Brent Crude | 96.28 | +6.4% |
| Gold | 4476.6 | +1.0% |
| Bitcoin | 79940.25 | +2.9% |


Export Momentum Confirmed South Korea’s August exports rose materially above consensus and the prior reading, widening the trade surplus on semiconductor shipments. The S&P Global Manufacturing PMI eased only modestly, indicating factory activity remained in expansion territory despite the global risk-off tone.
Inflation Rebound Registered The August inflation rate printed above the prior reading and only slightly below consensus, underscoring sticky domestic price pressures amid the AI-driven chip cycle.
Equity and Currency Divergence KOSPI closed the week at 6687.21, down 1.95% week-over-week, while USD/KRW fell to 1345.99, a 2.26% appreciation of the won driven by corporate repatriation and export inflows. Samsung and SK Hynix shares declined 1.73% and 1.61% respectively over the same period.
Commodity Impulse Added Pressure Brent crude advanced 6.4% to 96.28 over the week, lifting imported inflation risks for the net-energy importer and contributing to the rise in the Korea long-term rate.
Labor and Fiscal Backdrop Stable The unemployment rate held steady with no new print this week, while the government outlined a larger 2027 budget proposal that includes record AI spending and higher planned bond issuance.
Through-Line Emerged The week’s data arc showed external demand resilience offsetting softer equity sentiment and modest PMI softening, leaving the Bank of Korea’s data-dependent posture intact without fresh policy signals.
The Bank of Korea maintained its data-dependent stance with no speakers or minutes released during the week. The export print and inflation outcome together reinforce the case for continued vigilance on price pressures without immediate adjustment to the policy rate. Officials have previously highlighted AI chip demand as an emerging inflation risk, and the latest inflation reading above the prior level aligns with that assessment. The stronger won and record dollar deposit holdings further support the view that external flows are absorbing part of the adjustment rather than requiring policy recalibration. Data therefore point to an unchanged policy rate path pending the next set of activity and price releases.
| Date | Ctry | Event | Prior | Cons. | Actual |
|---|---|---|---|---|---|
| Mon 31 | KR | Exports Year-over-Year | 62.8 | - | - |
| Mon 31 | KR | Imports Year-over-Year | 26.5 | - | - |
| Mon 31 | KR | Trade Balance | 30.3bn | - | - |
| Mon 31 | KR | S&P Global Manufacturing P | 53.1 | - | - |
| Mon 31 | KR | 30-Year Korean Treasury Bo | 4.5 | - | - |
| Tue 1 | KR | Inflation Rate Year-over-Y | 2.8 | - | 3.1 |
| Tue 1 | KR | Inflation Rate Month-over- | -0.20 | - | 0.20 |
| Thu 3 | KR | Foreign Exchange Reserves | 427.9bn | - | - |
| Thu 3 | KR | Current Account Balance | 49.7bn | - | 42.1bn |
| Date | Release | Prior | Cons. |
|---|---|---|---|
| 2026-09-08 | Unemployment Rate | 2.8 | - |
The September 8 unemployment rate release will provide the first labor-market update since the inflation rebound. Markets will monitor whether the prior reading holds or signals any softening that could influence upcoming Bank of Korea decisions. The finance minister nominee’s parliamentary hearings are expected to emphasize inflation control alongside the larger 2027 budget. Bond issuance details will also shape long-term rate expectations. These releases matter for the rate path because they will test whether external demand strength continues to offset domestic price pressures in coming quarters. No central bank events are scheduled, keeping attention on incoming data for forward guidance.
State-run enterprise debt approaching higher levels by 2030 raises fiscal sustainability questions that could weigh on long-term yields if issuance accelerates. Bad loans at Korean banks reached the highest level in eight years, flagging rising credit risks amid higher long-term rates. Upside scenarios center on sustained semiconductor export momentum pushing the current account surplus higher, while downside risks include further Brent advances amplifying imported inflation. Markets appear to underweight the combination of sticky inflation and heavy 2027 bond supply, leaving scope for front-end yield pressure if subsequent prints confirm the recent rebound.
| Asset | Level | WoW |
|---|---|---|
| JCI | 6636.48 | +1.7% |
| KLCI | 1708.1 | +0.4% |
| STI | 5801.96 | +0.8% |
| USD/IDR | 17631.0 | -0.7% |
| USD/THB | 32.87 | -0.6% |
| USD/MYR | 4.04 | +0.4% |
| USD/PHP | 62.6 | +0.4% |
| USD/SGD | 1.27 | -0.6% |
| Brent Crude | 96.28 | +6.4% |
| Gold | 4476.6 | +1.0% |
| Bitcoin | 79950.0 | +2.9% |


Inflation and Trade Surprises Anchor the Week Indonesia’s August inflation rose more than expected and the trade balance swung to a surplus. The external position improved from the prior shortfall and supported rupiah stability.
Central Bank Continuity Amid Leadership Change Bank Indonesia and the Bank of Thailand maintained their policy rates, with BI citing balanced inflation risks and adequate reserves. Parliament confirmed Destry Damayanti as the new BI governor with a mandate focused on stability and rupiah management. Bank Negara Malaysia held its overnight policy rate unchanged, consistent with the prior decision.
Equity and Currency Divergence JCI advanced 1.7% week-over-week to close at 6,636.48 while KLCI gained 0.44% to 1,708.10 and STI rose 0.81% to 5,801.96. USD/IDR eased 0.66% to 17,631.00 and USD/THB declined 0.60% to 32.87, even as Brent crude climbed 6.4% to 96.28 and gold rose 1.03% to 4,476.60. The MAS-BI rupiah-SGD settlement framework involving twelve banks was activated to reduce transaction costs for bilateral trade.
Cross-Border and Sector Developments Kasikornbank opened its Indonesian subsidiary. Regional volumes remained moderate ahead of the Philippines inflation release, with most ASEAN currencies showing modest USD weakness on the week.
Bank Indonesia held its policy rate steady after the August inflation print and the trade surplus, with incoming governor Destry Damayanti emphasizing continuity in inflation targeting and rupiah defense. The Bank of Thailand also kept its policy rate unchanged, noting the trade account had returned to balance. Bank Negara Malaysia maintained the overnight policy rate, aligning with its data-dependent stance amid stable reserves. MAS reinforced its current NEER policy band without adjustment while launching the direct rupiah-SGD settlement framework with BI. The combination of the hotter Indonesian inflation reading and the external surplus reinforced the signal that BI will assess incoming data before any upcoming decisions, while BNM’s hold leaves its rate path unchanged pending further prints.
| Date | Ctry | Event | Prior | Cons. | Actual |
|---|---|---|---|---|---|
| Mon 31 | TH | Current Account Balance | -3.5bn | - | -1.6bn |
| Mon 31 | TH | Private Consumption Month- | 1.1 | - | 1.2 |
| Mon 31 | TH | Private Investment Month-o | 0.50 | - | -0.30 |
| Mon 31 | TH | Retail Sales Year-over-Yea | -14.5 | - | -18.3 |
| Mon 31 | ID | S&P Global Manufacturing P | 50.2 | - | - |
| Mon 31 | MY | S&P Global Manufacturing P | 50.7 | - | - |
| Mon 31 | PH | S&P Global Manufacturing P | 51.8 | - | - |
| Mon 31 | TH | S&P Global Manufacturing P | 54.2 | - | - |
| Tue 1 | ID | Inflation Rate Year-over-Y | 2.9 | - | 3.2 |
| Tue 1 | ID | Trade Balance | -450.0mn | - | - |
| Tue 1 | ID | Core Inflation Rate Year-o | 2.8 | - | - |
| Tue 1 | ID | Exports Year-over-Year | 8.8 | - | - |
| Tue 1 | ID | Imports Year-over-Year | 34.3 | - | - |
| Tue 1 | ID | Inflation Rate Month-over- | -0.14 | - | 0.21 |
| Date | Release | Prior | Cons. |
|---|---|---|---|
| 2026-09-07 | Unemployment Rate | 4.9 | - |

Philippines unemployment rate data is scheduled for release early next week and will provide the first labor-market update since the prior reading. No major central-bank meetings or high-impact releases are listed for Indonesia, Thailand, Malaysia, Singapore or Vietnam. The Philippines inflation outcome will feed directly into BSP deliberations ahead of its next decision. Market participants will monitor follow-through from the new BI leadership and any comments on rupiah management. External drivers including Brent crude will remain focal for current-account and imported-inflation assessments across the net-energy importers. The data flow supports continued data dependence at BI, BoT, BNM, BSP, MAS and SBV without immediate shifts in forward guidance.
The hotter Indonesian inflation print and the sharp Brent advance introduce upside risks to imported inflation for the region’s net-energy importers, potentially extending the data-dependent hold at BI and BSP. A weaker-than-expected Philippines unemployment release could soften the growth outlook and tilt BSP communications toward caution. Conversely, sustained trade surpluses and the rupiah-SGD framework may ease near-term external pressure on BI, allowing greater focus on domestic stability under the new governor. Markets appear to under-weight the persistence of commodity-driven price pressure after the weekly Brent gain, leaving scope for revised inflation forecasts in coming quarters if energy prices remain elevated.
| Asset | Level | WoW |
|---|---|---|
| Nifty 50 | 23897.7 | -0.8% |
| Sensex | 76515.43 | -0.6% |
| USD/INR | 94.47 | -0.9% |
| EUR/INR | 109.75 | +1.8% |
| Reliance | 1322.0 | +3.5% |
| HDFC Bank | 712.1 | +0.4% |
| Brent Crude | 96.28 | +6.4% |
| Gold | 4476.6 | +1.0% |
| Bitcoin | 79950.0 | +2.9% |


GDP outperformance anchors domestic momentum. India's Q1 FY27 GDP expanded ahead of consensus while matching the prior quarter and outpacing RBI expectations through services and investment channels. This print aligned with above-average monsoon rainfall that lifted kharif sowing and reduced near-term food inflation risks. Central government capex rose through July, reinforcing the investment contribution visible in the national accounts.
External balance deterioration offset by capital inflows. The current account balance moved to a deficit in April-June from the prior surplus, reflecting higher commodity imports. Record FCNR(B) inflows and FDI equity expanded forex reserves to a record high, lifting the rupee to 94.47 and marking a weekly gain. USD/INR closed the week stronger.
Equity markets absorb mixed signals. Nifty 50 declined to 23897.7 while Sensex fell to 76515.43 over the week. Reliance advanced while HDFC Bank posted a smaller gain. Services PMI expanded in August yet posted its weakest pace in four years amid softer new business.
Commodity and rating developments add context. Brent crude rose to 96.28 while gold advanced to 4476.6. Japan's JCR upgraded India's sovereign rating to A- from BBB+, citing sustained growth and reform momentum. IT services exports grew in the quarter, supported by BFSI and healthcare deal wins.
The RBI maintained the policy rate throughout the week with no alteration to forward guidance. Record FCNR(B) inflows and forex reserves reaching a record high provided the central bank additional room to manage liquidity without immediate rate adjustment. Officials continued measured intervention that supported the rupee at 94.47, consistent with the data-dependent stance observed in prior periods. The GDP print and current account deficit together signal resilient domestic demand alongside external pressure from commodity imports, leaving the rate path unchanged ahead of upcoming decisions. No RBI speakers altered the emphasis on incoming inflation and growth figures during the period.
| Date | Ctry | Event | Prior | Cons. | Actual |
|---|---|---|---|---|---|
| Mon 31 | IN | GDP Growth Year-over-Year | 7.8 | - | 7.8 |
| Mon 31 | IN | Government Budget Value | -3078.0bn | - | -4551.4bn |
| Tue 1 | IN | HSBC Manufacturing PMI Fin | 53.5 | - | 52.8 |
| Tue 1 | IN | Current Account Balance | 7.1bn | - | -4.2bn |
| Wed 2 | IN | M3 Money Supply Year-over- | - | - | - |
| Thu 3 | IN | HSBC Composite PMI Final | 54.3 | - | 54.3 |
| Thu 3 | IN | HSBC Services PMI Final | 53.3 | - | 54.1 |
| Fri 4 | IN | Foreign Exchange Reserves | - | - | 740.8bn |
| Date | Release | Prior | Cons. |
|---|---|---|---|
| 2026-09-12 | Inflation Rate Year-over-Year | 4.5 | - |

No high-impact Indian data releases are scheduled for the week of September 07-13. Markets will monitor global equity and commodity moves, particularly Brent crude near 96.28, for any spillover into domestic sentiment. The absence of prints leaves focus on RBI liquidity operations and any follow-through from the sovereign rating upgrade. Equity investors may track corporate earnings from the IT sector for direction on Nifty 50 and Sensex. The rupee is expected to hold recent gains near 94.47 if measured intervention continues. Bond yields could see limited movement absent fresh inflation or liquidity signals. These conditions keep the policy rate path data-dependent into the next meeting, with attention on whether subsequent releases alter the balance between growth momentum and external risks.
The GDP beat and record forex inflows shift the near-term outlook toward sustained domestic resilience, yet the current account deficit highlights vulnerability to commodity price spikes. Brent crude's weekly advance raises imported inflation risks that could challenge the RBI's data-dependent hold if sustained. Services PMI weakness in August signals potential softening in new business that may weigh on 2H momentum. The market appears to underweight the combination of external balance deterioration and global tensions, as evidenced by the rupee's strength despite the deficit swing. Upside scenarios center on continued non-debt inflows supporting reserves at record levels, while downside risks include further oil advances testing rupee stability near 94.47.
| Asset | Level | WoW |
|---|---|---|
| BIST 100 | 14012.4 | -2.2% |
| USD/TRY | 48.42 | +0.4% |
| EUR/TRY | 56.23 | +0.6% |
| GBP/TRY | 65.44 | +0.2% |
| Gold (TRY) | 4476.6 | +1.0% |
| Brent Crude | 96.28 | +6.4% |
| EUR/USD | 1.16 | +0.2% |
| Bitcoin | 79950.0 | +2.9% |


Equity and currency pressure amid energy spike. The BIST 100 posted successive daily declines before a modest rebound on the final session, closing the week at 14,012.40. USD/TRY advanced steadily before easing on the last print, leaving the cross 0.36 percent higher at 48.42. EUR/TRY and GBP/TRY recorded smaller net gains of 0.56 percent and 0.16 percent respectively, consistent with broad TRY softening.
Energy-driven inflation channel remains dominant. Brent crude climbed to 96.28, a 6.4 percent weekly gain that directly lifted imported-energy costs. Gold priced in TRY rose 1.03 percent to 4,476.60, providing a partial domestic hedge but underscoring persistent price-level concerns. News flow highlighted record fuel-price increases tied to the combination of global oil turbulence and ongoing currency pressures.
Growth-forecast revision signals policy trade-off. Official projections for 2027 GDP growth were trimmed, illustrating the tension between maintaining price stability and supporting activity as external shocks persist. No major domestic data releases occurred during the five-day window, so price action reflected external commodity moves and positioning ahead of the upcoming policy decision.
Policy expectations stayed anchored. The absence of fresh Central Bank of the Republic of Turkey communication left the prior policy rate setting as the operative benchmark. Market participants modeled further reductions by year-end, yet the near-term path remained on hold. The week therefore reinforced a data-dependent stance without altering the immediate rate outlook.
The Central Bank of the Republic of Turkey enters the next meeting with the policy rate at the prior level and no fresh forward guidance issued during the review period. Industrial Production Year-over-Year data due on the same day as the decision will provide the latest reading on real-economy momentum before officials deliberate. Higher Brent levels at 96.28 reinforce imported-inflation risks that the central bank has previously cited as a reason for caution. Officials have continued to emphasize incoming data over pre-set calendars, keeping the path explicitly conditional on subsequent releases. The combination of stable prior rates and the absence of new verbal signals leaves the near-term policy stance unchanged.
| Date | Ctry | Event | Prior | Cons. | Actual |
|---|---|---|---|---|---|
| Mon 31 | TR | GDP Growth Quarter-over-Qu | 0.10 | - | 1.1 |
| Mon 31 | TR | GDP Growth Year-over-Year | 2.5 | - | 2.3 |
| Mon 31 | TR | Unemployment Rate | 7.6 | - | 8.1 |
| Mon 31 | TR | Labor Force Participation | 52.9 | - | 52.5 |
| Tue 1 | TR | Istanbul Chamber of Indust | 47.7 | - | 48.1 |
| Thu 3 | TR | Inflation Rate Month-over- | 1.8 | - | 1.8 |
| Thu 3 | TR | Inflation Rate Year-over-Y | 31.8 | - | 31.5 |
| Thu 3 | TR | Producer Price Index Month | 1.5 | - | 2.6 |
| Thu 3 | TR | Producer Price Index Year- | 27.8 | - | 27.9 |
| Thu 3 | TR | Foreign Exchange Reserves | - | - | 71.1bn |
| Thu 3 | TR | Balance of Trade Prelimina | - | - | -5.2bn |
| Thu 3 | TR | Exports Preliminary | - | - | 23.5bn |
| Thu 3 | TR | Imports Preliminary | - | - | 28.7bn |
| Date | Release | Prior | Cons. |
|---|---|---|---|
| 2026-09-10 | Industrial Production Year-over-Yea | -1.4 | - |
| 2026-09-10 | TCMB Interest Rate Decision | 37.0 | - |
Monday brings no high-impact Turkish releases, allowing markets to absorb the prior week’s equity and currency moves. Tuesday and Wednesday remain quiet on the domestic calendar, keeping focus on external Brent dynamics and any regional spillovers. Thursday features both Industrial Production Year-over-Year and the Central Bank of the Republic of Turkey policy-rate decision, the clearest potential market-moving events. The joint timing means the production figure could shape any accompanying statement language on growth risks. Friday offers a clean slate for digestion of the decision and any revisions to the inflation or activity outlook. The releases matter because they will inform the central bank’s assessment of whether current settings remain appropriate for the coming quarters.
Elevated Brent at 96.28 raises the possibility that imported inflation prints could exceed earlier expectations and keep the Central Bank of the Republic of Turkey on hold for longer than currently modeled. A weaker-than-expected Industrial Production Year-over-Year outcome on decision day could tilt the growth-inflation balance and prompt softer language in the statement. Conversely, resilient production data would support the bank’s current cautious stance and reduce pressure for near-term easing. The BIST 100’s 2.24 percent weekly decline already prices some deterioration in sentiment; further downside would signal that external energy shocks are beginning to weigh on domestic risk assets more than anticipated. Currency stability at USD/TRY 48.42 remains contingent on continued Brent containment; any renewed commodity surge would test that equilibrium.
| Asset | Level | WoW |
|---|---|---|
| Saudi Aramco | 26.0 | -0.5% |
| MSCI Saudi | 38.51 | -0.8% |
| MSCI UAE | 19.47 | +0.1% |
| MSCI Qatar | 17.23 | -1.0% |
| MSCI Kuwait | 37.65 | -1.3% |
| Brent Crude | 96.28 | +6.4% |
| WTI Crude | 91.48 | +6.7% |
| Gold | 4476.6 | +1.0% |
| USD/SAR | 3.75 | +2.5% |
| USD/AED | 3.67 | +0.0% |
| USD/KWD | 0.31 | -0.5% |
| Bitcoin | 79944.74 | +2.9% |


Oil Price Surge Amid Geopolitical Tensions Oil markets dominated the week as Brent crude advanced to 96.28, a 6.4 percent weekly gain driven by supply signals and Hormuz-related risks. WTI crude followed with a 6.67 percent advance to 91.48. Regional equity indices posted modest net declines, with MSCI Saudi falling 0.75 percent to 38.51 and MSCI Kuwait declining 1.31 percent to 37.65. Saudi Aramco closed at 26.0 after a 0.54 percent weekly drop.
Non-Oil Activity Non-oil indicators pointed to continued diversification momentum.
Equity and FX Stability MSCI UAE edged up 0.1 percent to 19.47 while MSCI Qatar declined 1.03 percent to 17.23. USD/SAR held at 3.75 and USD/AED at 3.67, confirming peg stability across the week. Gold rose 1.03 percent to 4476.6 amid safe-haven flows. No major economic data releases occurred in any GCC state, leaving markets focused on oil and geopolitics. Sovereign bond issuance by Saudi Arabia drew steady demand given robust fiscal metrics.
GCC Central Banks kept policy rates unchanged throughout the week with no minutes, speeches, or decisions altering forward guidance. Currency pegs remained fixed at USD/SAR 3.75 and USD/AED 3.67 despite the Brent advance to 96.28. The absence of inflation or activity prints left the data-dependent stance intact. Higher oil prices at current levels support fiscal balances and reduce near-term pressure on sovereign budgets across the six economies.
| Date | Ctry | Event | Prior | Cons. | Actual |
|---|---|---|---|---|---|
| Thu 3 | SA | Riyad Bank PMI Index | 53.1 | - | 53.8 |
| Thu 3 | AE | S&P Global PMI Index | 52.7 | - | 55.3 |
Next week opens with limited GCC-specific releases, keeping attention on global data that could influence external demand for energy. German industrial production and Romanian GDP estimates on Monday will provide early signals on European activity relevant to GCC exports. Mid-week US and Eurozone prints may shape broader risk sentiment and oil demand expectations ahead of the next OPEC+ meeting. FX peg stability is expected to persist absent new monetary signals from any GCC Central Bank.
Elevated Brent levels near 96.28 introduce upside fiscal scenarios but also raise the risk of demand destruction if supply disruptions ease. Geopolitical tensions around the Strait of Hormuz could sustain volatility in regional equities that already posted net weekly declines. Downside scenarios center on any rapid de-escalation that reverses the 6.4 percent oil advance.
| Time | Country | Event | Our Est. | Consensus | Prior | Impact |
|---|---|---|---|---|---|---|
| MONDAY, SEPTEMBER 7 | ||||||
| 02:00 | 🇩🇪 | Industrial Production Month-over-Month | — | — | 0.20 | ●●○ |
| 02:00 | 🇬🇧 | Lloyds House Price Index Month-over-Month | — | — | 0 | ●●○ |
| 02:00 | 🇬🇧 | Lloyds House Price Index Year-over-Year | — | — | 0.10 | ●●○ |
| 03:00 | 🇨🇭 | Unemployment Rate | — | — | 3 | ●●○ |
| 19:01 | 🇬🇧 | BRC Retail Sales Monitor Year-over-Year | — | — | 1 | ●●○ |
| 19:50 | 🇯🇵 | Current Account Balance | — | — | -923.0B | ●●○ |
| 19:50 | 🇯🇵 | GDP Growth Annualized Final | — | 1.1 | 1.8 | ●●○ |
| 19:50 | 🇯🇵 | GDP Growth Quarter-over-Quarter Final Estimate | — | 0.30 | 0.50 | ●●○ |
| 21:00 | 🇵🇭 | Unemployment Rate | — | — | 4.9 | ●●○ |
| 23:00 | 🇨🇳 | Exports Year-over-Year | — | — | 23.9 | ●●● |
| 23:00 | 🇨🇳 | Imports Year-over-Year | — | — | 27.5 | ●●● |
| 23:00 | 🇨🇳 | Trade Balance | — | — | 112.5B | ●●● |
| TUESDAY, SEPTEMBER 8 | ||||||
| 02:00 | 🇩🇪 | Trade Balance | — | — | 15.4B | ●●● |
| 02:00 | 🇩🇪 | Exports Month-over-Month | — | — | — | ●●○ |
| 02:45 | 🇫🇷 | Trade Balance | — | — | -5.8B | ●●○ |
| 05:30 | 🇿🇦 | GDP Growth Quarter-over-Quarter | — | — | 0.50 | ●●○ |
| 05:30 | 🇿🇦 | GDP Growth Year-over-Year | — | — | 1.9 | ●●○ |
| 08:15 | 🇺🇸 | ADP Employment Change Weekly | — | — | — | ●●○ |
| 17:00 | 🇨🇱 | Central Bank Interest Rate Decision CB | — | — | 4.5 | ●●● |
| 19:00 | 🇰🇷 | Unemployment Rate | — | — | 2.8 | ●●○ |
| 20:30 | 🇦🇺 | Westpac Consumer Confidence Change | — | — | 6 | ●●● |
| 20:30 | 🇦🇺 | Westpac Consumer Confidence Index | — | — | 88.9 | ●●○ |
| 21:30 | 🇦🇺 | NAB Business Confidence Index | — | — | -6 | ●●● |
| 21:30 | 🇨🇳 | Inflation Rate Year-over-Year | — | — | 0.50 | ●●● |
| 21:30 | 🇨🇳 | Inflation Rate Month-over-Month | — | — | -0.10 | ●●○ |
| 21:30 | 🇨🇳 | Producer Price Index Year-over-Year | — | — | 3.5 | ●●○ |
| WEDNESDAY, SEPTEMBER 9 | ||||||
| 02:45 | 🇫🇷 | Industrial Production Month-over-Month | — | — | 0.10 | ●●○ |
| 07:00 | 🇺🇸 | MBA 30-Year Mortgage Rate | — | — | — | ●●○ |
| 08:00 | 🇲🇽 | Inflation Rate Month-over-Month | — | — | 0.03 | ●●○ |
| 08:00 | 🇲🇽 | Inflation Rate Year-over-Year | — | — | 3.1 | ●●○ |
| 16:30 | 🇺🇸 | API Weekly Crude Oil Stocks | — | — | — | ●●○ |
| 19:01 | 🇬🇧 | RICS House Price Balance | — | — | -30 | ●●○ |
| Time | Country | Event | Our Est. | Consensus | Prior | Impact |
|---|---|---|---|---|---|---|
| THURSDAY, SEPTEMBER 10 | ||||||
| 03:00 | 🇹🇷 | Industrial Production Year-over-Year | — | — | -1.4 | ●●○ |
| 04:00 | 🇮🇹 | Industrial Production Month-over-Month | — | — | -1 | ●●○ |
| 07:00 | 🇹🇷 | TCMB Interest Rate Decision | — | — | 37 | ●●○ |
| 08:30 | 🇺🇸 | Producer Price Index Month-over-Month | — | — | 0 | ●●● |
| 08:30 | 🇺🇸 | Core Producer Price Index Month-over-Month | — | — | 0.20 | ●●○ |
| 08:30 | 🇺🇸 | Weekly Jobless Claims | — | — | — | ●●○ |
| 10:00 | 🇺🇸 | Existing Home Sales Level | — | — | 4.1M | ●●● |
| 10:00 | 🇺🇸 | Existing Home Sales Month-over-Month | — | — | -1.7 | ●●○ |
| 12:00 | 🇺🇸 | EIA Weekly Crude Oil Inventory | — | — | — | ●●○ |
| 12:00 | 🇺🇸 | EIA Weekly Gasoline Inventory | — | — | — | ●●○ |
| 18:30 | 🇳🇿 | Business NZ PMI Index | — | — | 54.3 | ●●○ |
| 19:00 | 🇵🇪 | Central Bank Interest Rate Decision CB | — | — | 4.2 | ●●● |
| FRIDAY, SEPTEMBER 11 | ||||||
| 02:00 | 🇬🇧 | GDP Month-over-Month | — | — | 0.30 | ●●● |
| 02:00 | 🇬🇧 | GDP 3-Month Avg Level | — | — | 0.40 | ●●○ |
| 02:00 | 🇬🇧 | Goods Trade Balance | — | — | -23.0B | ●●○ |
| 02:00 | 🇬🇧 | Goods Trade Balance Non-Eu | — | — | -10.4B | ●●○ |
| 02:00 | 🇬🇧 | Industrial Production Month-over-Month | — | — | -0.20 | ●●○ |
| 02:00 | 🇬🇧 | Manufacturing Production Month-over-Month | — | — | -0.50 | ●●○ |
| 03:00 | 🇨🇭 | Consumer Confidence Index | — | — | -35 | ●●○ |
| 06:30 | 🇷🇺 | Central Bank Interest Rate Decision CB | — | — | 14 | ●●● |
| 08:00 | 🇧🇷 | Inflation Rate Month-over-Month | — | — | 0.07 | ●●○ |
| 08:00 | 🇧🇷 | Inflation Rate Year-over-Year | — | — | 4.4 | ●●○ |
| 08:30 | 🇺🇸 | Core Inflation Rate Month-over-Month | — | — | 0.20 | ●●● |
| 08:30 | 🇺🇸 | Core Inflation Rate Year-over-Year | — | — | 2.5 | ●●● |
| 08:30 | 🇺🇸 | Inflation Rate Month-over-Month | — | — | 0.10 | ●●● |
| 08:30 | 🇺🇸 | Inflation Rate Year-over-Year | — | — | 3.4 | ●●● |
| 08:30 | 🇺🇸 | Consumer Price Index | — | — | 333.9 | ●●○ |
| 08:30 | 🇺🇸 | Consumer Price Index SA | — | — | 332.8 | ●●○ |
| 10:00 | 🇺🇸 | Michigan Consumer Sentiment Preliminary | — | — | — | ●●● |
| 12:00 | 🇷🇺 | Inflation Rate Month-over-Month | — | — | 0.50 | ●●○ |
| 12:00 | 🇷🇺 | Inflation Rate Year-over-Year | — | — | 6 | ●●○ |
| 14:00 | 🇺🇸 | Monthly Budget Statement | — | — | — | ●●○ |
| SATURDAY, SEPTEMBER 12 | ||||||
| 06:30 | 🇮🇳 | Inflation Rate Year-over-Year | — | — | 4.5 | ●●○ |
AI-Generated Content: This publication is 100% generated by artificial intelligence systems and should not be considered as financial advice, investment recommendation, or professional research. All analysis, forecasts, and commentary are algorithmically produced.
Data Sources: Market data from public exchange and market-data providers. US Treasury yields from the Federal Reserve (FRED constant-maturity series). Macroeconomic data from central banks and national statistics offices. Economic calendar data from RoboMacro Economic Calendar. All data subject to revision and may be delayed.
No Warranty: RoboMacro makes no warranty, express or implied, regarding the accuracy, completeness, or reliability of the information contained in this publication. Data may be delayed, incomplete, or contain errors. Past performance is not indicative of future results.
Not Financial Advice: Nothing in this publication constitutes investment advice, tax advice, legal advice, or any other form of professional advice. Any opinions expressed are AI-generated and do not represent the views of any individual or organisation. Readers should consult qualified professionals before making investment decisions.
Nowcasts and Model Output: The US labour nowcast is the median of a ten-model ensemble. Activity indices are composite z-scores of weekly public high-frequency indicators, seasonally adjusted, published only for weeks meeting a minimum indicator-coverage threshold; the as-of date and coverage are shown on every row. All model output carries significant uncertainty.
Contact: [email protected] | robomacro.com
Publication: Global Macro Watch is published weekly on Sundays, covering the preceding Monday-to-Friday week. © 2026 RoboMacro. All rights reserved.