Published every Sunday afternoon 100% AI-generated — not financial advice
Energy Prices Anchor the Mid-Cycle Expansion
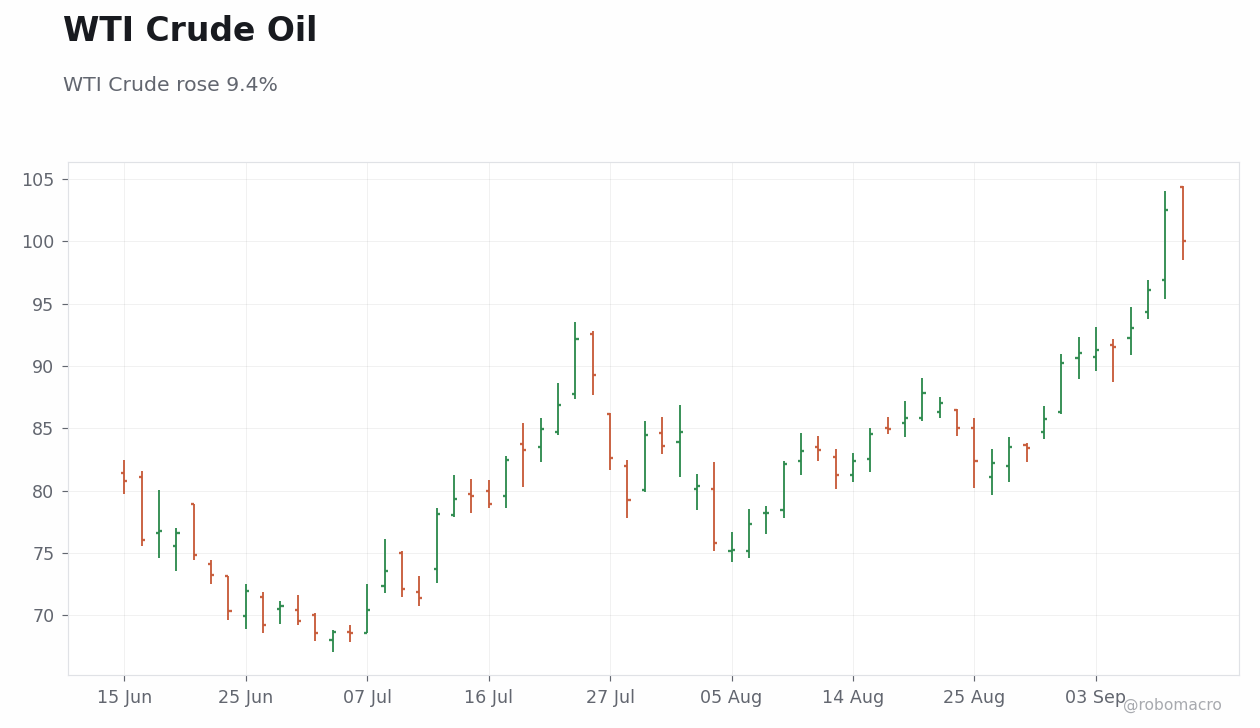
The week of September 7–11, 2026 placed the global expansion in its mid-phase, where a sharp energy price impulse interacted with uneven activity data to sustain a data-dependent policy equilibrium. Brent crude settled at 104.61 after advancing 6.83 percent week-over-week, while WTI crude closed at 100.05 after a 7.55 percent gain. These moves occurred against a backdrop of mixed labor-market prints that failed to alter any major central bank’s stance. The configuration leaves imported inflation risks competing with selective softening in employment indicators, extending the pattern observed in the prior three weeks when energy prices had already reasserted dominance.
We note that the latest commodity advance built on earlier gains, with Brent having risen from 88.10 three weeks earlier. Policymakers absorbed the price shock without immediate recalibration, keeping the expansion on its current trajectory through the second half of 2026. Activity signals diverged sharply by region, yet the common thread remained tolerance for divergent prints without policy shifts on the basis of single-week data.
DM Outcomes Show Resilience Amid Energy Pressure
Developed-market data reinforced selective labor-market strength alongside manufacturing weakness. US August nonfarm payrolls reinforced labor-market resilience against prior cooling signals, while German industrial production contracted 1.1 percent month-over-month in July. UK housing and retail indicators pointed to softer domestic demand. These prints confirm that the expansion continues without synchronized momentum across the major economies.
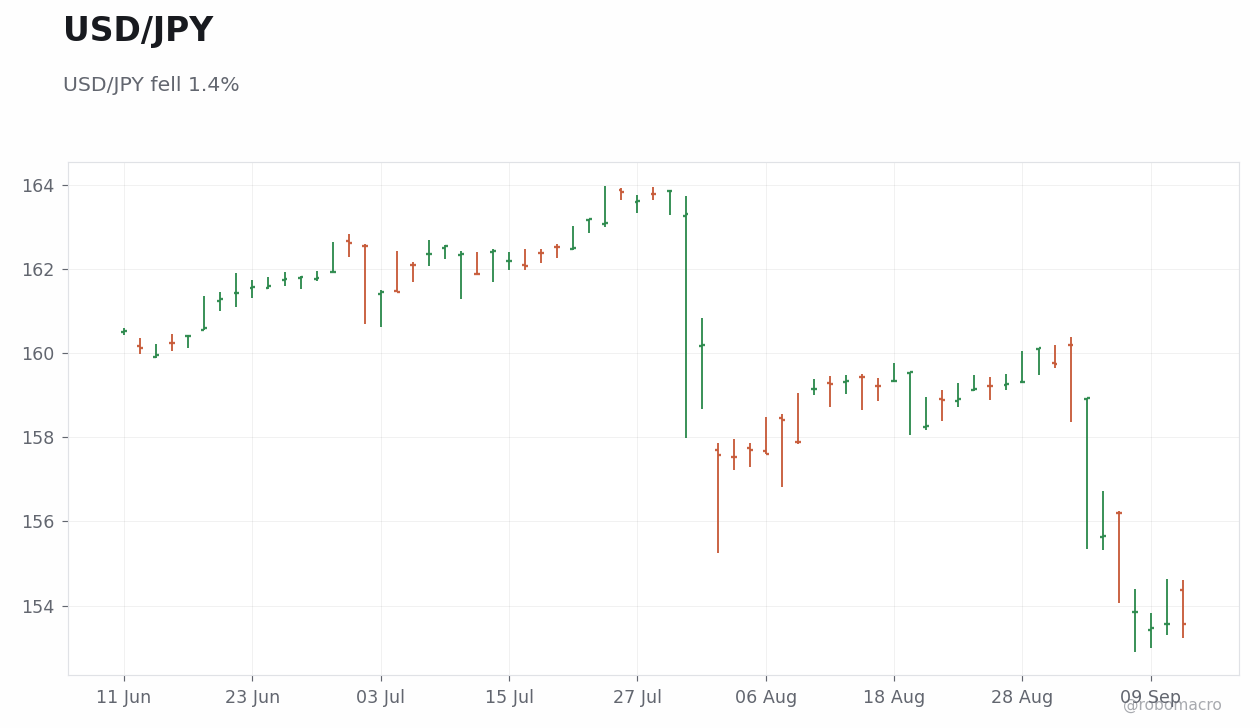
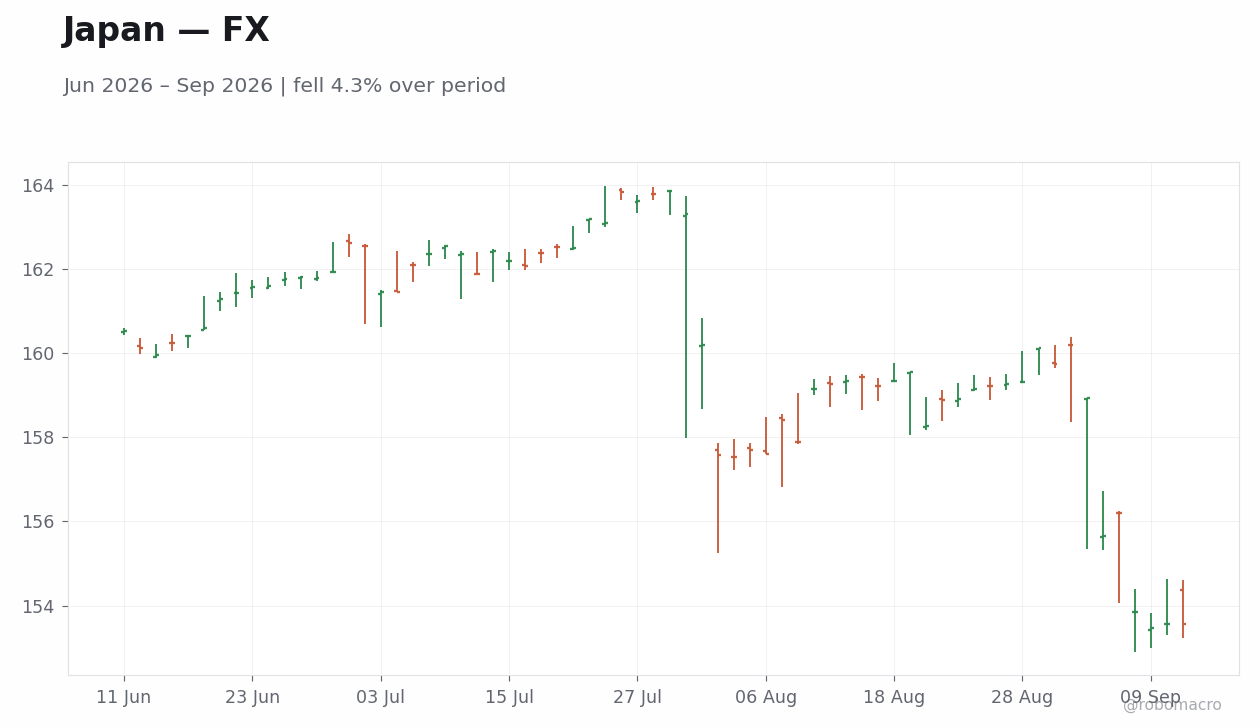
Japan recorded a final Q2 GDP beat alongside a current-account swing to surplus, reinforcing the case for Bank of Japan policy adjustment. USD/JPY declined to 153.55 with the yen reaching its strongest level in six-and-a-half months after hawkish signals from BoJ board member Masu. The configuration leaves Japanese normalization expectations alive but still tethered to incoming data.
Canada held its policy rate steady on September 9 after August employment declined and unemployment remained steady. The Bank of Canada cited persistent price pressures amid escalating trade measures. Across these economies the shared refusal to shift parameters on mixed prints extends the data-dependent equilibrium observed since late August.
EM Data Split Along Commodity and Domestic Lines
Emerging-market outcomes clustered around commodity support for select exporters and softening domestic demand in net importers. Mexico August inflation printed below consensus on both monthly and annual bases, while WTI and Brent advances supported peso stability. Brazil’s Bovespa closed at 187,207, down 0.09 percent week-over-week, as iron ore and oil price gains offset broader market moves. USD/BRL ended at 5.13.
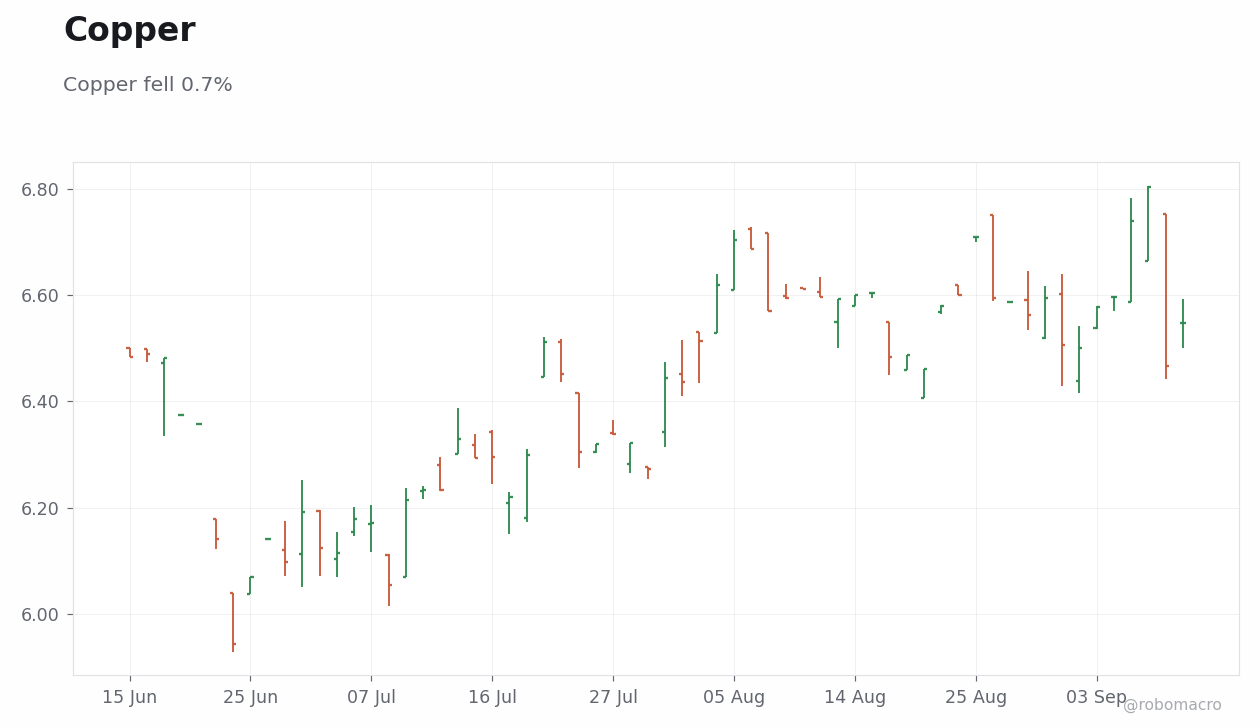
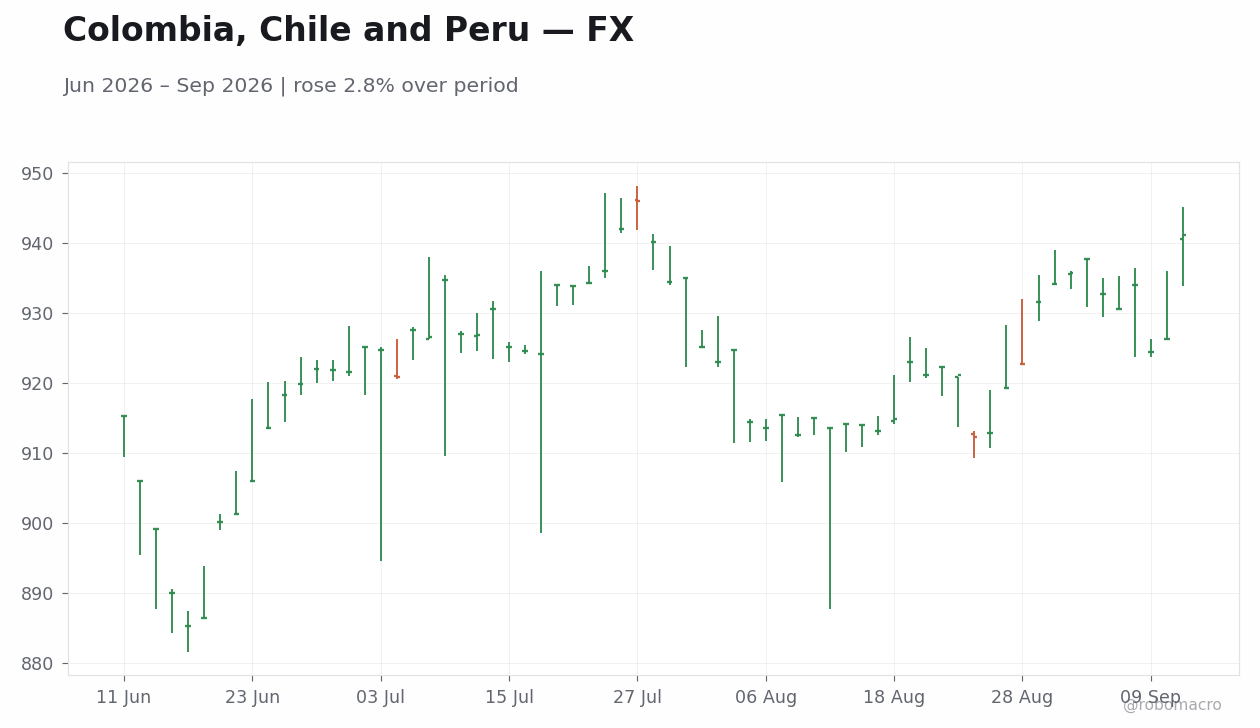
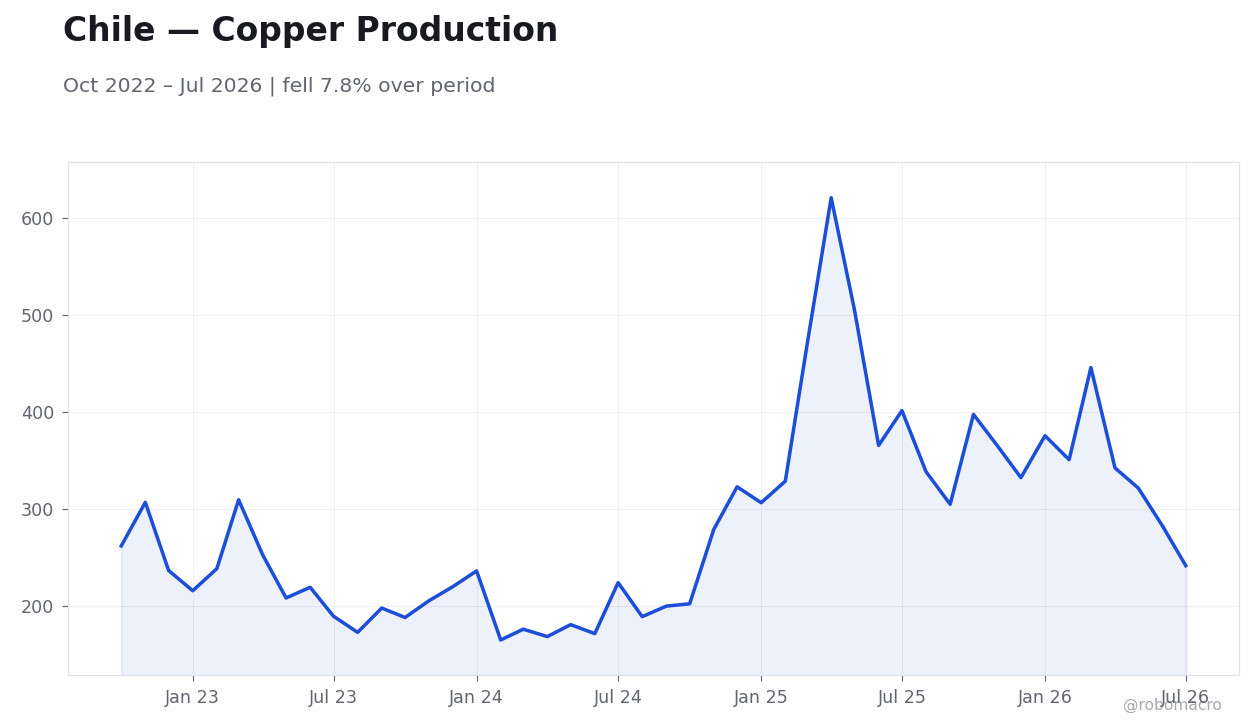
Chile’s central bank held the policy rate unchanged amid soft domestic activity and copper output contraction year-over-year in July. Brent’s advance and copper’s 2.83 percent decline drove divergent FX moves, with USD/COP easing while USD/CLP and USD/PEN advanced. Indonesia foreign reserves provided a buffer for rupiah operations as the currency closed at 17,606. Regional equities declined, with JCI falling 1.18 percent to 6,541.38. The split underscores how external price impulses continue to shape EM policy paths without uniform domestic momentum.
Cross-Asset Pricing Reflects Growth and Inflation Divergence
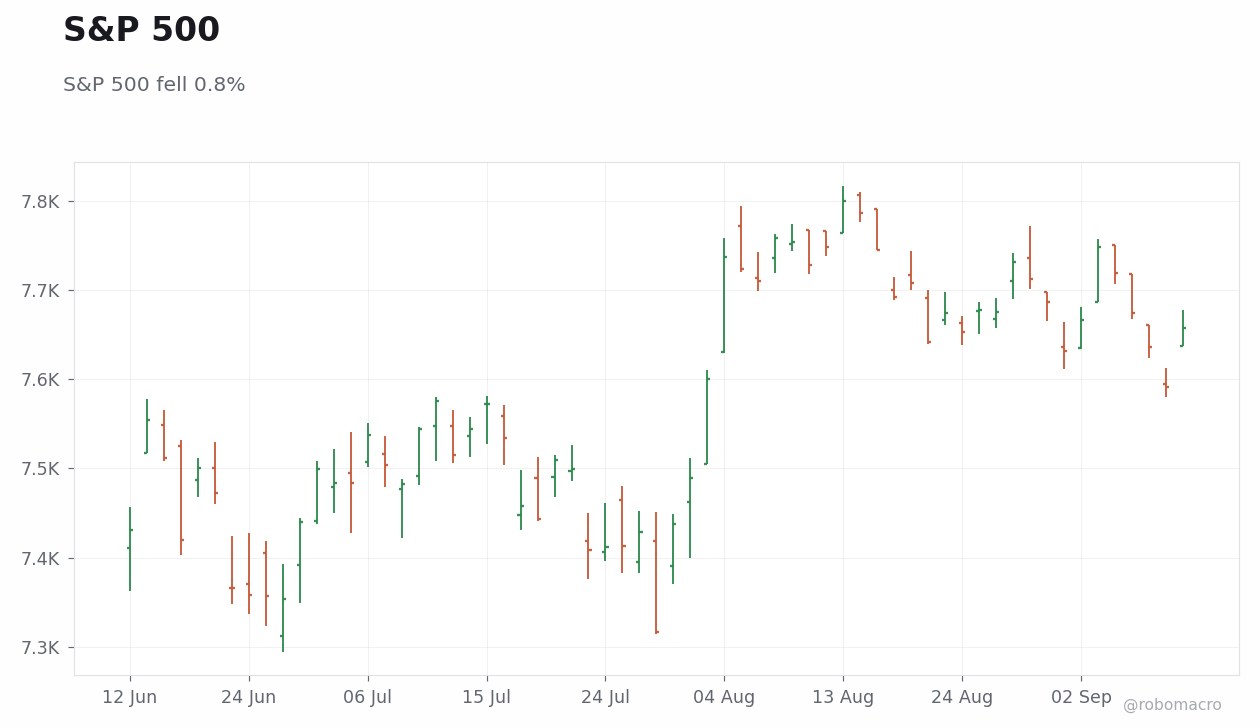
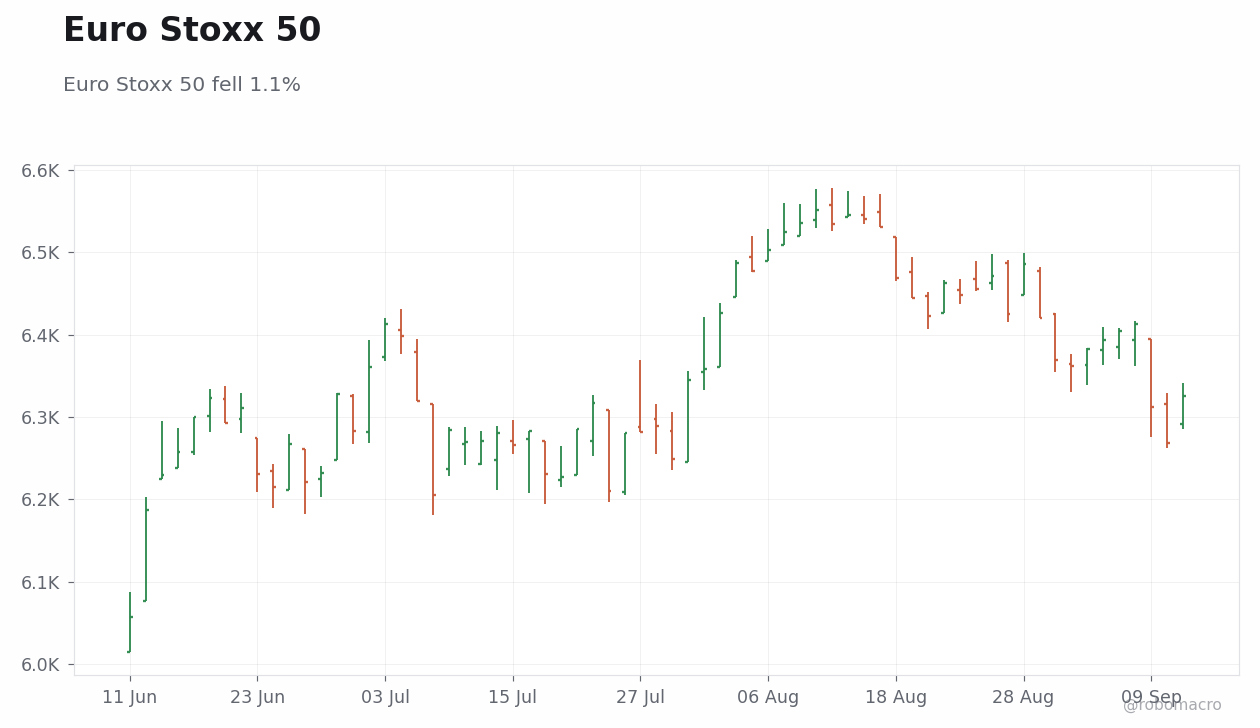
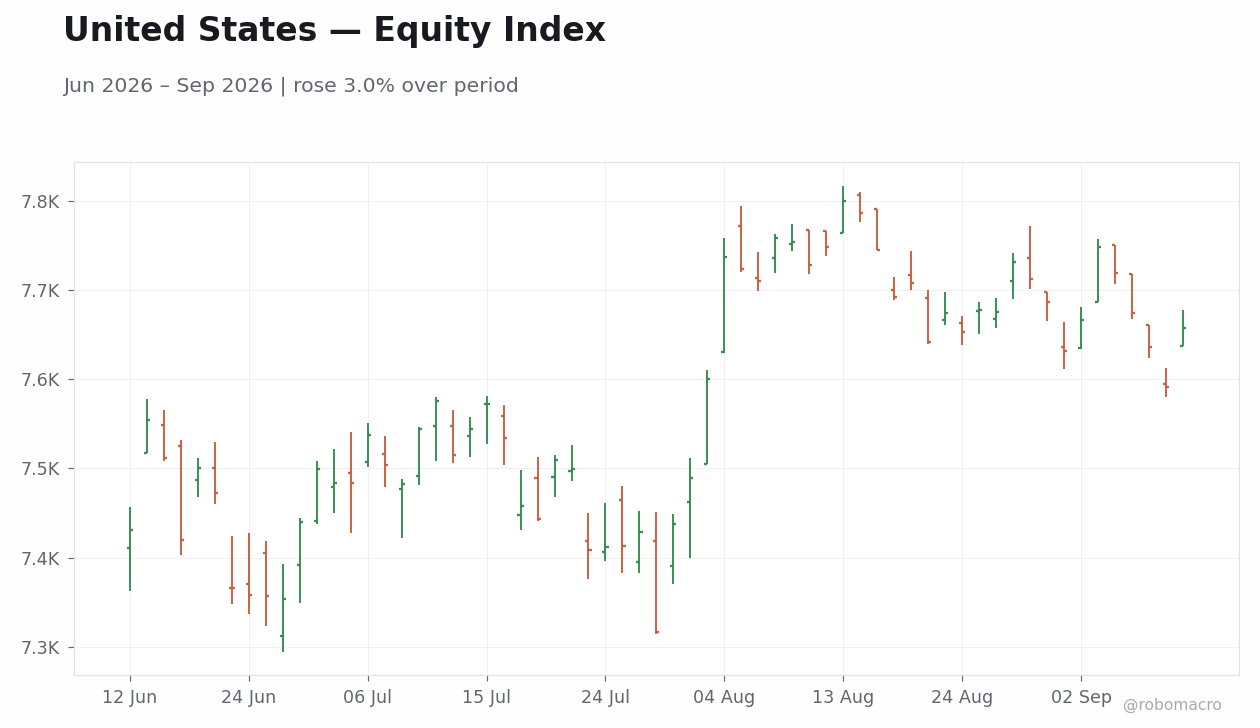
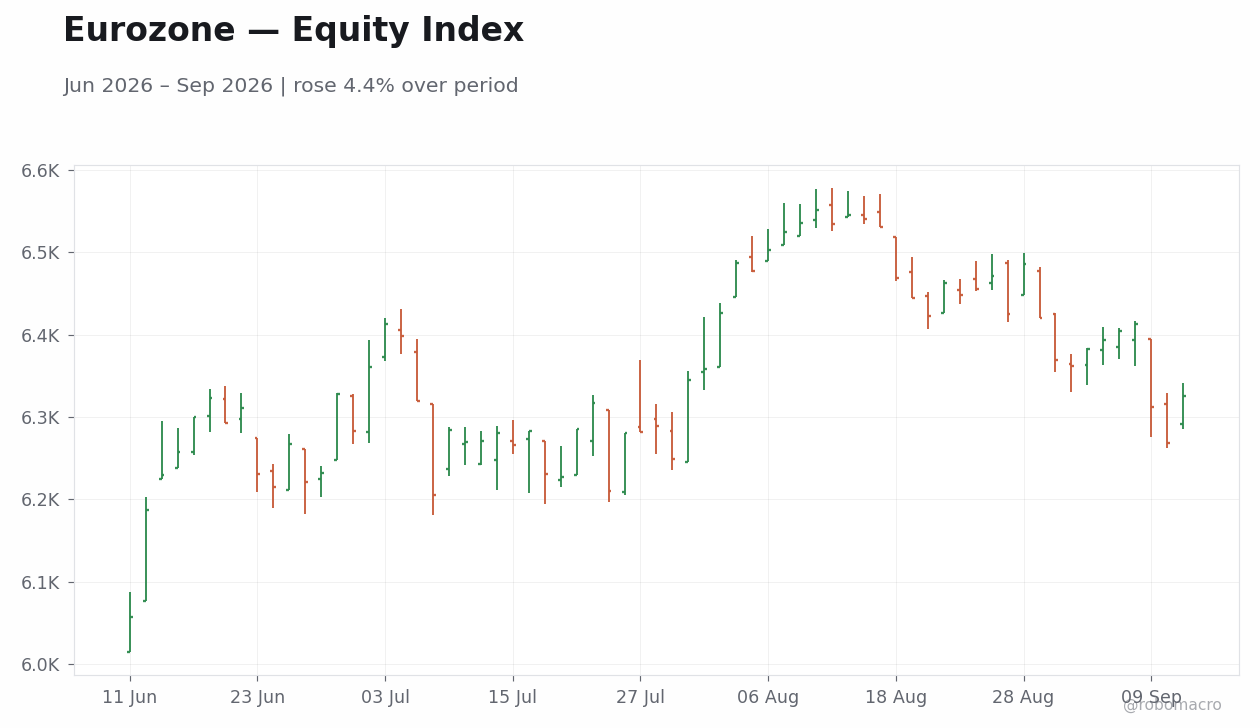
Fixed-income markets priced reduced near-term easing odds after the jobs beat and energy price surge. US 2-year yields rose 17 basis points to 4.56 percent and 10-year yields advanced 16 basis points to 4.95 percent. UK 10-year gilt yields increased 22 basis points to 5.36 percent, while German 10-year Bund yields rose 18 basis points to 3.52 percent. Equity markets declined across most regions, with S&P 500 falling 0.8 percent to 7,657, Euro Stoxx 50 declining 1.23 percent to 6,325.13, and FTSE 100 dropping 1.59 percent to 10,650.4.
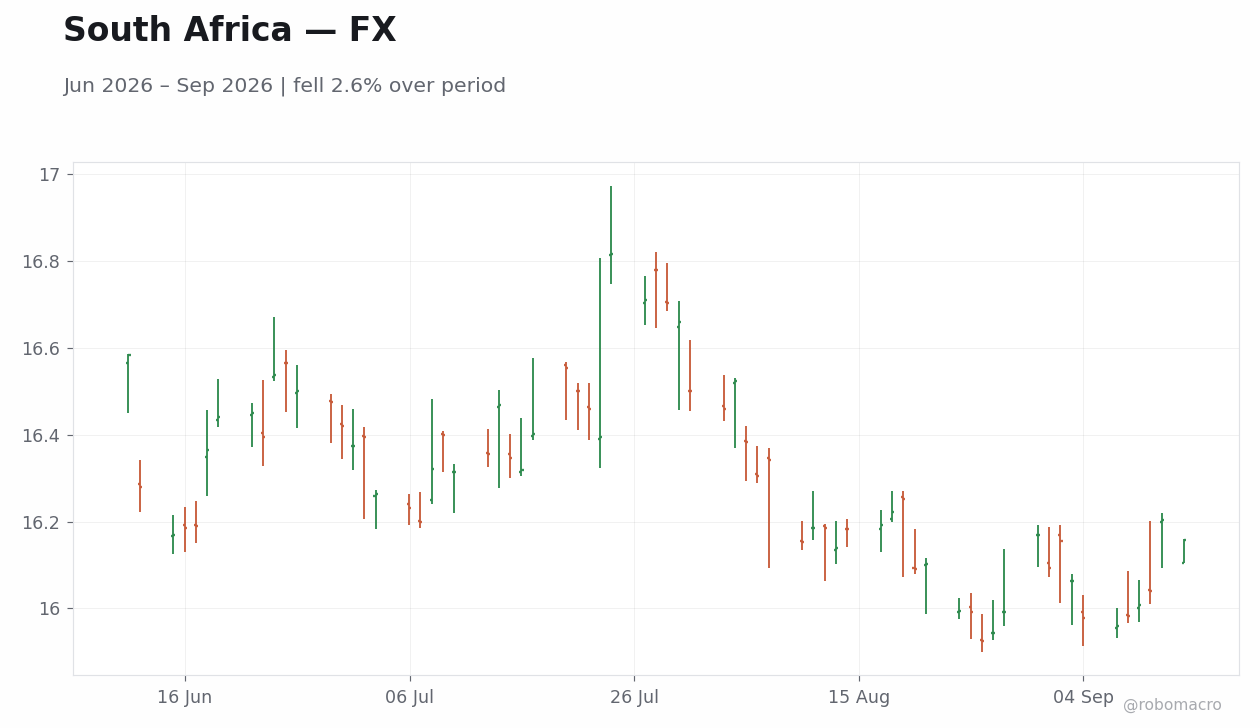
FX markets illustrated rotation, with USD/JPY falling 1.4 percent to 153.55 and USD/ZAR rising 1.24 percent to 16.16. Gold advanced modestly while copper declined 2.83 percent. The configuration shows rates markets absorbing the energy impulse through higher yields, equities reflecting growth concerns, and currencies responding to relative policy and commodity exposures.
Policy Landscape Remains Data-Dependent
Central banks across developed and emerging markets maintained explicitly data-dependent postures with no forward guidance shifts after the week’s mixed prints. ECB speakers reiterated reliance on incoming data for the deposit rate path. Riksbank and Norges Bank issued no new communications, while RBA officials emphasized persistent inflation pressures requiring caution. Banco de Mexico and BCCh held unchanged stances amid soft activity and elevated external prices. The global central bank landscape therefore shows continued tolerance for divergent prints without immediate recalibration through the balance of 2026.
Forward Look Centers on Elections and Data Releases
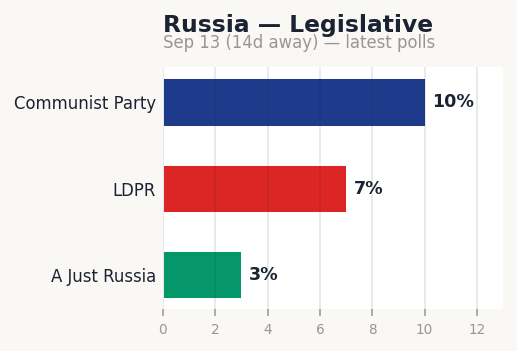
Markets will next focus on the Russian State Duma election on September 13 and the Swedish general election on the same date. Sustained state-led policy in Russia and potential shifts in Swedish fiscal priorities could influence regional risk sentiment. US CPI and retail sales data, Eurozone industrial production, and Bank of Japan communications are also scheduled. The dominant narrative of energy-driven inflation risks interacting with uneven activity is expected to persist absent synchronized surprises across these releases.
| Economy | Real GDP (% y/y) | Consumer Prices (% y/y) | ||||
|---|---|---|---|---|---|---|
| 2026E | 2027E | 2028E | 2026E | 2027E | 2028E | |
| Americas | ||||||
| United States | 2.3 | 2.1 | 2.1 | 3.2 | 2.1 | 2.2 |
| Canada | 1.5 | 1.9 | 1.7 | 2.5 | 2.1 | 2.0 |
| Mexico | 1.6 | 2.2 | 2.1 | 3.9 | 3.4 | 3.0 |
| Brazil | 1.9 | 2.0 | 2.4 | 4.0 | 3.4 | 3.0 |
| Argentina | 3.5 | 4.0 | 3.8 | 30.4 | 15.7 | 9.6 |
| Colombia | 2.3 | 2.5 | 2.6 | 5.9 | 5.2 | 3.4 |
| Chile | 2.4 | 2.6 | 2.3 | 2.9 | 3.3 | 3.0 |
| Peru | 2.8 | 2.8 | 2.8 | 2.5 | 1.8 | 2.0 |
| Asia / Pacific | ||||||
| Japan | 0.7 | 0.6 | 0.6 | 2.2 | 2.3 | 2.0 |
| China | 4.4 | 4.0 | 4.0 | 1.2 | 1.5 | 1.8 |
| India | 6.5 | 6.5 | 6.5 | 4.7 | 4.0 | 4.0 |
| Australia | 2.0 | 1.7 | 1.9 | 4.0 | 3.2 | 2.6 |
| New Zealand | 2.1 | 2.4 | 2.4 | 3.1 | 2.3 | 2.1 |
| South Korea | 1.9 | 2.1 | 2.2 | 2.5 | 1.9 | 2.0 |
| Indonesia | 5.0 | 5.1 | 5.2 | 3.0 | 2.6 | 2.5 |
| Malaysia | 4.7 | 4.3 | 4.3 | 1.9 | 2.0 | 2.0 |
| Philippines | 4.1 | 5.8 | 6.1 | 4.3 | 3.2 | 3.0 |
| Singapore | 3.5 | 2.7 | 2.5 | 2.3 | 1.9 | 2.0 |
| Thailand | 1.5 | 2.1 | 2.3 | 0.9 | 1.0 | 1.2 |
| Taiwan | 5.2 | 3.0 | 2.4 | 1.5 | 1.6 | 1.6 |
| Vietnam | 7.1 | 6.7 | 6.2 | 4.9 | 4.6 | 3.7 |
| Western Europe | ||||||
| Euro area | 1.1 | 1.2 | 1.4 | 2.6 | 2.2 | 2.1 |
| Germany | 0.8 | 1.2 | 1.2 | 2.7 | 2.3 | 2.0 |
| France | 0.9 | 0.9 | 1.2 | 1.8 | 1.7 | 1.9 |
| Italy | 0.5 | 0.5 | 0.8 | 2.6 | 2.4 | 2.3 |
| Spain | 2.1 | 1.8 | 1.8 | 3.0 | 2.3 | 2.5 |
| United Kingdom | 0.8 | 1.3 | 1.6 | 3.2 | 2.4 | 2.0 |
| Sweden | 2.0 | 1.9 | 2.1 | 1.5 | 1.8 | 2.6 |
| Norway | 1.5 | 1.3 | 1.1 | 3.3 | 2.6 | 2.2 |
| Denmark | 2.0 | 1.6 | 1.6 | 2.0 | 2.2 | 2.2 |
| Switzerland | 1.3 | 1.3 | 1.8 | 0.5 | 0.5 | 0.6 |
| Netherlands | 1.2 | 1.4 | 1.4 | 2.7 | 2.4 | 2.3 |
| Poland | 3.3 | 2.4 | 2.6 | 3.3 | 3.3 | 3.9 |
| Czech Republic | 2.2 | 2.2 | 2.1 | 2.4 | 2.2 | 2.5 |
| Hungary | 1.7 | 2.0 | 2.3 | 3.8 | 3.5 | 3.1 |
| Romania | 0.7 | 2.5 | 2.7 | 7.8 | 3.9 | 4.3 |
| EMEA Emerging | ||||||
| Turkey | 3.4 | 3.5 | 3.8 | 28.6 | 21.4 | 17.0 |
| South Africa | 1.0 | 1.3 | 1.5 | 3.9 | 3.4 | 3.0 |
| Israel | 3.5 | 4.4 | 3.7 | 2.3 | 2.1 | 2.0 |
| Saudi Arabia | 3.1 | 4.5 | 3.6 | 2.3 | 2.1 | 2.0 |
| UAE | 3.1 | 5.3 | 4.6 | 2.5 | 2.0 | 2.0 |
| Egypt | 4.2 | 4.8 | 5.5 | 13.2 | 11.1 | 8.1 |
| Nigeria | 4.1 | 4.3 | 4.1 | 16.0 | 15.9 | 12.7 |
| Kenya | 4.5 | 4.7 | 5.1 | 5.9 | 5.9 | 5.7 |
| Global Aggregates | ||||||
| Global | 3.1 | 3.2 | 3.2 | 4.4 | 3.7 | 3.4 |
| Developed markets | 1.8 | 1.7 | 1.7 | 2.8 | 2.2 | 2.1 |
| Emerging markets | 3.9 | 4.2 | 4.2 | 5.5 | 4.6 | 4.1 |
| Central Bank | Instrument | Current Rate |
Last Change |
bp | Next Meeting |
Q1 2026 |
Q2 2026 |
Q3 2026 |
Q4 2026 |
|---|---|---|---|---|---|---|---|---|---|
| The Americas | |||||||||
| Federal Reserve | Fed funds upper | 3.75% | Dec 2025 | -25 | Sep 16 | 3.75 | 3.75 | — | — |
| Bank of Canada | O/N rate | 2.25% | Oct 2025 | -25 | Oct 28 | 2.25 | 2.25 | — | — |
| BCB (Brazil) | SELIC | 14.00% | Aug 2026 | -25 | Sep 16 | 14.75 | 14.25 | — | — |
| Banxico | O/N rate | 6.50% | May 2026 | -25 | Sep 24 | 6.75 | 6.50 | — | — |
| BCRA (Argentina) | Aggregates regime | — | Jul 2025 | — | — | — | — | — | — |
| BanRep (Colombia) | Repo | 12.00% | Jul 2026 | +75 | — | 10.25 | 11.25 | — | — |
| BCCh (Chile) | MPR | 4.50% | Dec 2025 | -25 | — | 4.50 | 4.50 | — | — |
| Europe / Africa | |||||||||
| ECB | Depo rate | 2.25% | Jun 2026 | +25 | Oct 29 | 2.00 | 2.25 | — | — |
| Bank of England | Bank rate | 3.75% | Dec 2025 | -25 | Sep 17 | 3.75 | 3.75 | — | — |
| Riksbank | Repo rate | 1.75% | Oct 2025 | -25 | Sep 24 | 1.75 | 1.75 | — | — |
| Norges Bank | Dep rate | 4.25% | May 2026 | +25 | Sep 24 | 4.00 | 4.25 | — | — |
| SNB | Policy rate | 0.00% | Jun 2025 | -25 | Sep 24 | 0.00 | 0.00 | — | — |
| CNB (Czech) | 2-wk repo | 3.75% | Jun 2026 | +25 | Sep 17 | 3.50 | 3.75 | — | — |
| NBH (Hungary) | Base rate | 5.50% | Aug 2026 | -25 | Sep 22 | 6.25 | 6.25 | — | — |
| NBP (Poland) | Ref rate | 3.75% | Mar 2026 | -25 | — | 3.75 | 3.75 | — | — |
| SARB | Repo rate | 7.00% | May 2026 | +25 | Sep 23 | 6.75 | 7.00 | — | — |
| CBRT (Turkey) | 1-wk repo | 37.00% | Jan 2026 | -100 | Oct 22 | 37.00 | 37.00 | — | — |
| Asia / Pacific | |||||||||
| RBA | Cash rate | 4.35% | May 2026 | +25 | Sep 29 | 4.10 | 4.35 | — | — |
| RBNZ | OCR | 2.75% | Sep 2026 | +25 | Oct 28 | 2.25 | 2.25 | — | — |
| BoJ | Pol rate | 1.00% | Jun 2026 | +25 | Sep 18 | 0.75 | 1.00 | — | — |
| PBoC | 1-yr LPR | 3.00% | May 2025 | -10 | — | 3.00 | 3.00 | — | — |
| RBI (India) | Repo rate | 5.25% | Dec 2025 | -25 | — | 5.25 | 5.25 | — | — |
| BoK (Korea) | Base rate | 2.75% | Jul 2026 | +25 | — | 2.50 | 2.50 | — | — |
| BI (Indonesia) | BI-Rate | 5.75% | Jun 2026 | +25 | Sep 23 | 4.75 | 5.75 | — | — |
| BSP (Philippines) | Rev repo | 5.00% | Aug 2026 | +25 | — | 4.25 | 4.75 | — | — |
| BoT (Thailand) | 1-day repo | 1.00% | Feb 2026 | -25 | Oct 28 | 1.00 | 1.00 | — | — |
| CBC (Taiwan) | Disc rate | 2.00% | Mar 2024 | +12.5 | Sep 17 | — | — | — | — |
| MAS (Singapore) | SGD NEER | Mild appr. | Apr 2026 | slope+ | Jul 27 | — | — | — | — |
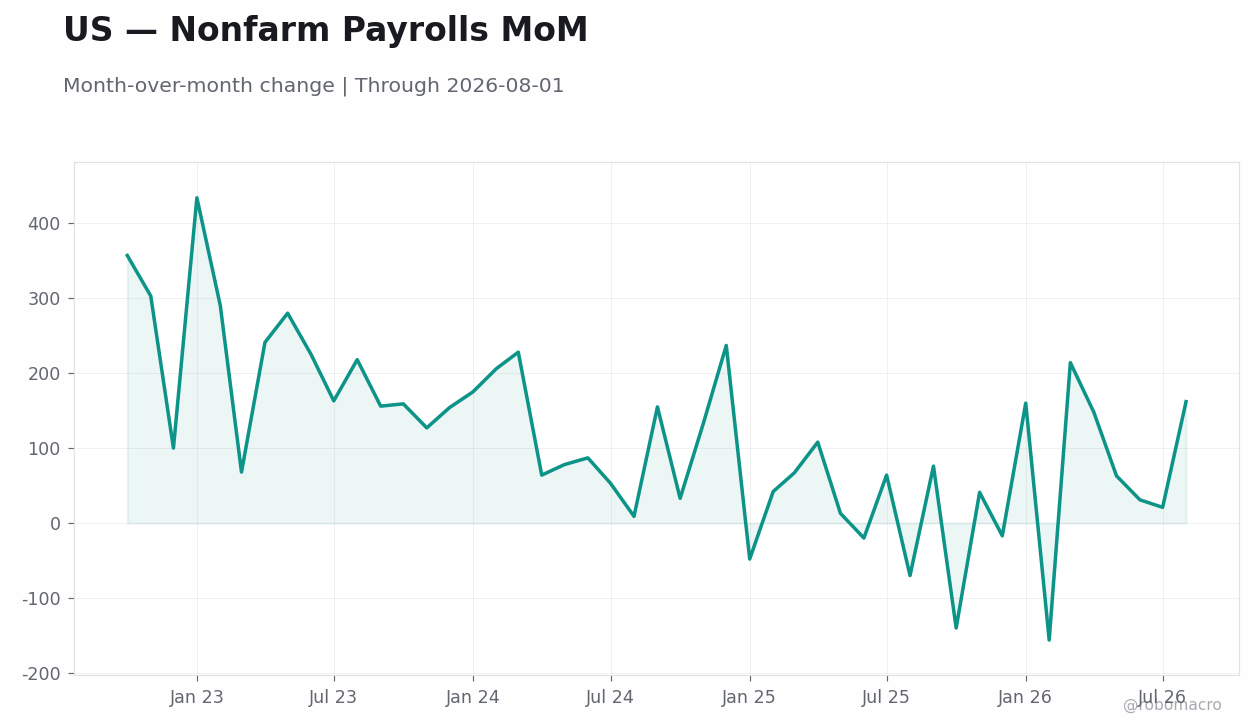
| Nonfarm Payrolls (m/m) | +92k | 80% CI -7k…+313k |
| Unemployment Rate | 4.3% | |
| Avg Hourly Earnings (y/y) | 3.3% |
| Economy | Activity Index | 4-wk Δ | 13-wk Δ | Week ending | Indicators | Signal |
|---|---|---|---|---|---|---|
| United States | 64.7 | +6.9 | +13.1 | 2026-09-04 | 7/7 | Expanding · Advancing |
| Brazil | 60.8 | -5.0 | -1.0 | 2026-09-11 | 3/4 | Expanding · Retreating |
| Canada | 60.1 | +9.3 | -1.0 | 2026-09-04 | 8/8 | Expanding · Advancing |
| Italy | 58.7 | -7.0 | +10.8 | 2026-09-04 | 5/5 | Expanding · Retreating |
| Germany | 56.5 | -0.5 | +13.7 | 2026-09-11 | 5/6 | Expanding · Retreating |
| Spain | 53.6 | -7.7 | +3.4 | 2026-09-04 | 5/5 | Expanding · Retreating |
| New Zealand | 50.1 | -10.7 | +17.5 | 2026-09-04 | 5/5 | Expanding · Retreating |
| Poland | 49.7 | -18.0 | -10.2 | 2026-09-11 | 3/4 | Contracting · Retreating |
| Euro Area | 48.0 | -5.1 | +3.4 | 2026-09-04 | 5/5 | Contracting · Retreating |
| Australia | 46.0 | +4.1 | -1.2 | 2026-09-04 | 3/3 | Contracting · Advancing |
| France | 45.2 | -3.3 | +1.0 | 2026-09-04 | 4/5 | Contracting · Retreating |
| Japan | 32.4 | -15.8 | -19.5 | 2026-09-11 | 4/5 | Contracting · Retreating |
Activity remains in expansion in United States, Germany, Italy, Spain, Canada, Brazil, New Zealand; while high-frequency trackers point to sub-trend activity in Euro Area, France, Japan, Australia, Poland. On a 4-week basis, momentum is improving in United States, Canada, Australia and cooling in Euro Area, Germany, France, Italy, Spain, Japan, Brazil, New Zealand, Poland. RoboMacro's labor ensemble nowcasts the next US payrolls print at +92k.


Week in Review
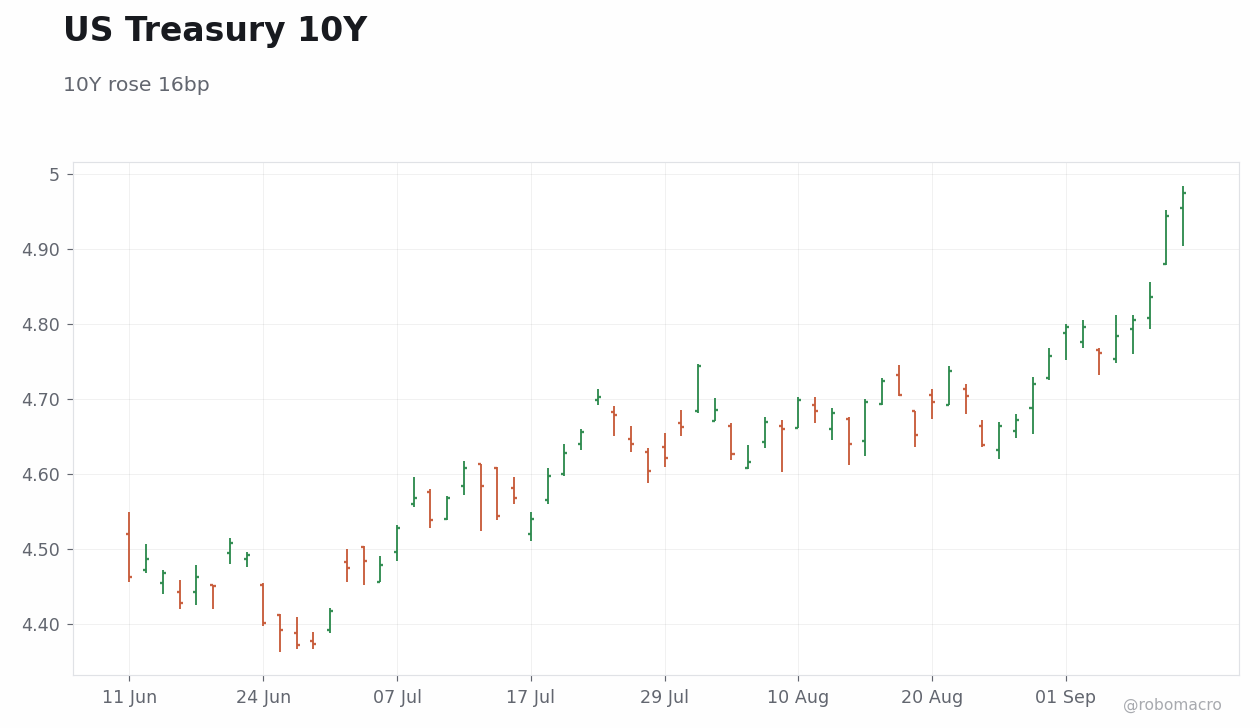
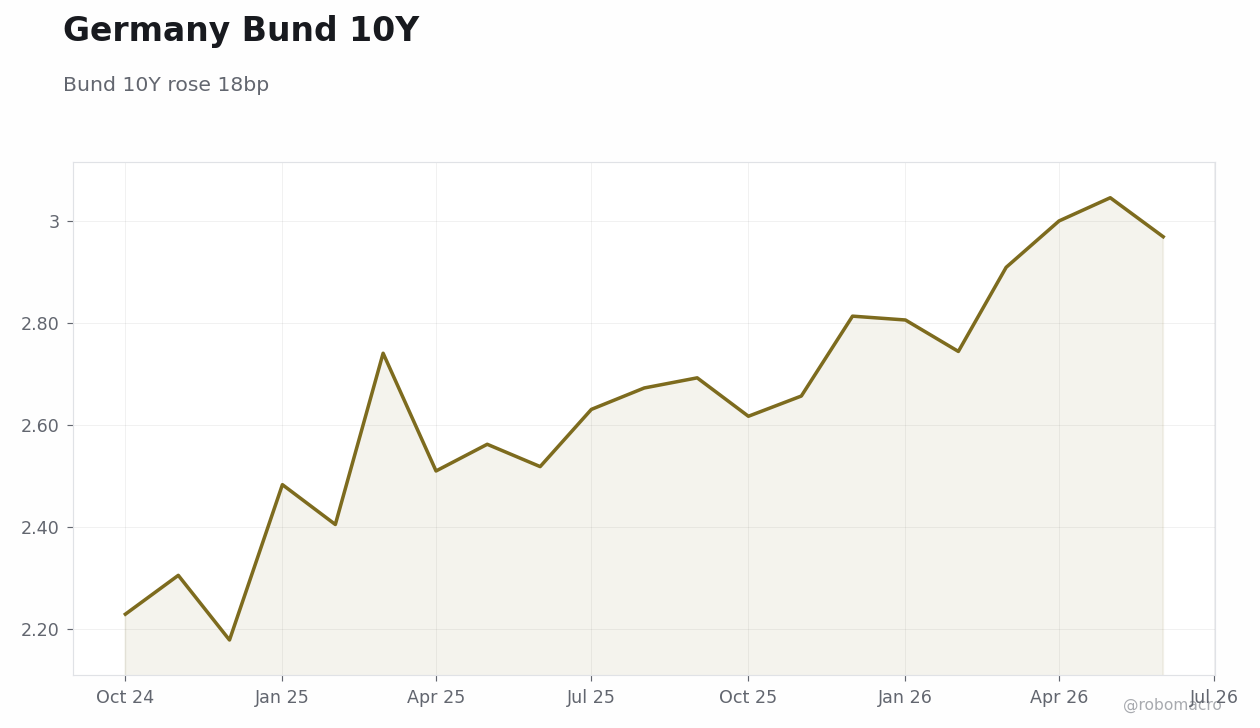
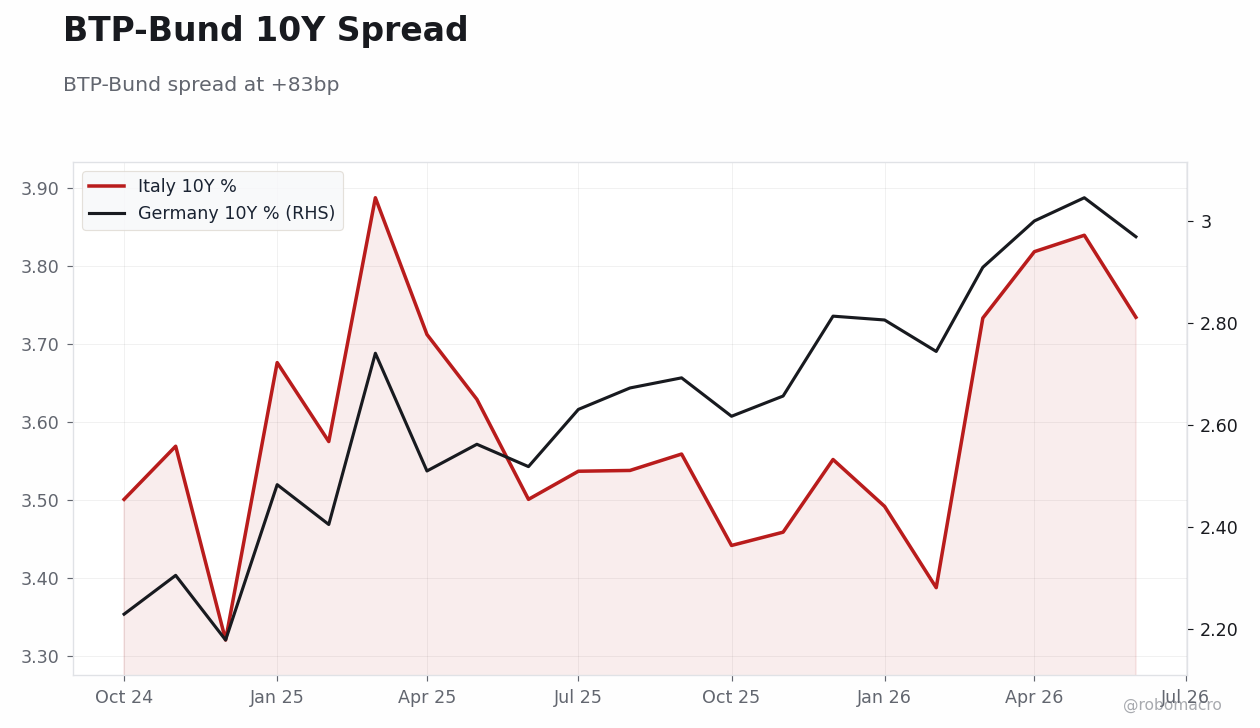
US 10-year Treasury yields rose 16bp to 4.95%. The intra-week path showed US 10Y yields climbing from 4.7840 the prior Friday to 4.8060 on Tuesday, 4.8370 on Wednesday, 4.9440 on Thursday and 4.9750 on Friday, while US 5Y yields moved from 4.5500 to 4.7910 and US 30Y yields rose from 5.2460 to 5.3540 before finishing at 5.37%. UK 10-year gilt yields increased 22bp to 5.36%. German 10-year Bund yields rose 18bp to 3.52%. Japanese 10-year yields gained 8bp to 2.98%. The selloff reflected resilient labor data and higher energy prices that reduced near-term easing odds.
Curve & Spreads
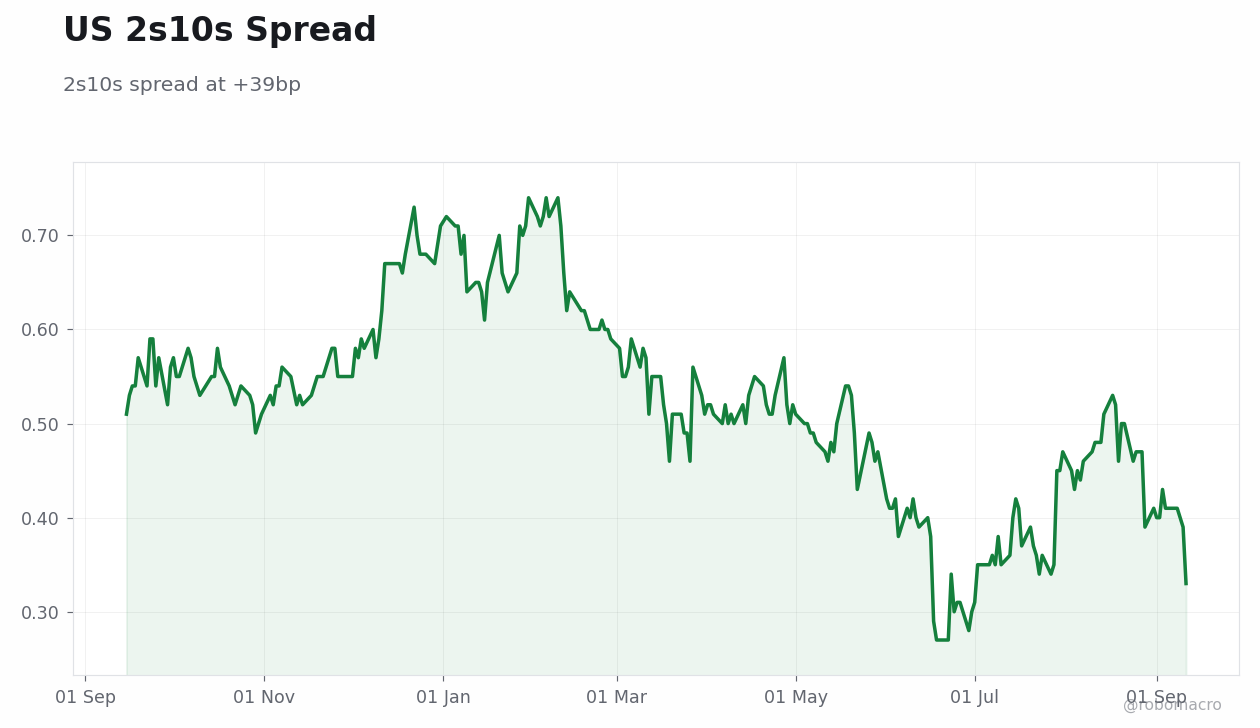
The US 2s10s spread stood at +39bp, compared with +34bp in Germany and +66bp in the UK. The steeper UK curve relative to the US and German curves implies stronger growth expectations in Britain than in the other two regions. Positive 2s10s spreads across all three markets suggest growth expectations remain constructive rather than recessionary. The modest steepness in the US and Germany points to moderate growth expectations ahead.
EM Bonds
Turkish 10-year yields stood at 34.47% with 2-year yields at 36.58% and 2s10s at -211bp, while its 2-year yield moved significantly lower. Brazilian 10-year yields stood at 14.29% and 2-year yields at 13.83%. South African 10-year yields stood at 8.90%, Mexican 10-year yields at 9.46%, and Indonesian 10-year yields at 7.16%. These EM yield levels remain substantially higher than DM levels such as the US 4.95% and Germany 3.52%, underscoring a significant risk premium differential.
Central Bank Read
US 2-year yields rose 17bp to 4.56% against a 16bp rise in 10-year yields to 4.95%, so the curve implies tightening bias. In the UK, 2-year yields rose 28bp to 4.70% versus 22bp on the 10-year to 5.36%, reinforcing that the curve implies tightening bias. German 2-year yields rose 25bp to 3.18% compared with 18bp on the 10-year to 3.52%, consistent with the curve implying tightening bias for the ECB. Japanese 2-year yields rose only 1bp to 1.84% while 10-year yields rose 8bp to 2.98%, so the curve implies easing bias. Front-end outperformance versus the back end in the US, UK, and Germany signals policy makers are seen maintaining restrictive stances amid resilient activity and imported inflation pressures.
Week Ahead
US CPI on Wednesday and the FOMC meeting on Wednesday will matter most for duration risk because they will shape rate-rise expectations after this week’s move toward 5%. BoE decision on Thursday in the UK and any BoJ signals will be watched for confirmation of policy direction. Eurozone CPI on Friday will be key for Bund duration. These inflation prints and central bank meetings will determine whether the recent backup in yields has further to run.
| Country | 2Y | 2Y WoW | 10Y | 10Y WoW | 30Y | 30Y WoW | 2s10s |
|---|---|---|---|---|---|---|---|
| United States | 4.56% | +17bp | 4.95% | +16bp | 5.37% | +10bp | +39bp |
| United Kingdom | 4.70% | +28bp | 5.36% | +22bp | 5.93% | +14bp | +66bp |
| Germany | 3.18% | +25bp | 3.52% | +18bp | 3.90% | +9bp | +34bp |
| France | 3.40% | +26bp | 4.45% | +24bp | 5.13% | +17bp | +105bp |
| Italy | 3.40% | +27bp | 4.35% | +20bp | 5.03% | +12bp | +95bp |
| Spain | 3.25% | +26bp | 3.97% | +19bp | 4.54% | +9bp | +72bp |
| Japan | 1.84% | +1bp | 2.98% | +8bp | 4.05% | +8bp | +115bp |
| Canada | 3.36% | +25bp | 3.94% | +16bp | 4.27% | +11bp | +58bp |
| Australia | 5.05% | +23bp | 5.38% | +18bp | 5.82% | +14bp | +33bp |
| China | 1.25% | +0bp | 1.69% | +1bp | 2.17% | +1bp | +44bp |
| India | 6.25% | +13bp | 7.01% | +4bp | 7.62% | +4bp | +76bp |
| Brazil | 13.83% | -2bp | 14.29% | -6bp | — | — | +46bp |
| Mexico | — | — | 9.46% | +20bp | — | — | — |
| South Korea | 3.91% | +21bp | 4.54% | +19bp | 4.72% | +8bp | +63bp |
| Indonesia | — | — | 7.16% | +5bp | 7.23% | +5bp | — |
| Turkey | 36.58% | -319bp | 34.47% | +10bp | — | — | -211bp |
| South Africa | — | — | 8.90% | +21bp | 9.28% | +15bp | — |
| Poland | — | — | 6.30% | +18bp | — | — | — |
Government bond yields rose broadly across developed markets. The UK led gains, with 2-year yields jumping 28bp to 4.70% and 10-year yields adding 22bp to 5.36%. Germany’s 2-year yield climbed 25bp to 3.18%, while France and Italy posted 26bp and 27bp increases at the front end. Turkey’s 2-year yield fell 319bp to 36.58%, the largest move lower, as its 2s10s spread narrowed 211bp. Brazil’s 10-year yield eased 6bp to 14.29%. Curve steepening was pronounced in France and Japan, where 2s10s spreads reached +105bp and +115bp. US 10-year yields advanced 16bp to 4.95%, tracking the DM move higher.


Week in Review
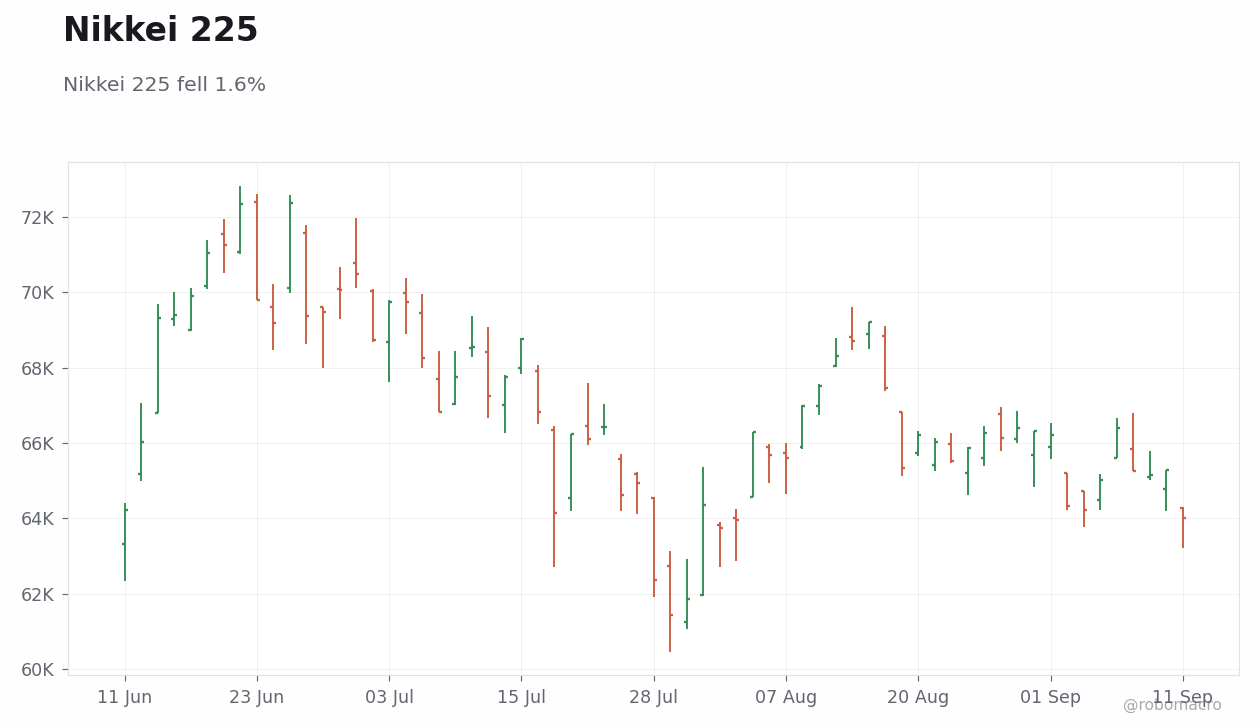
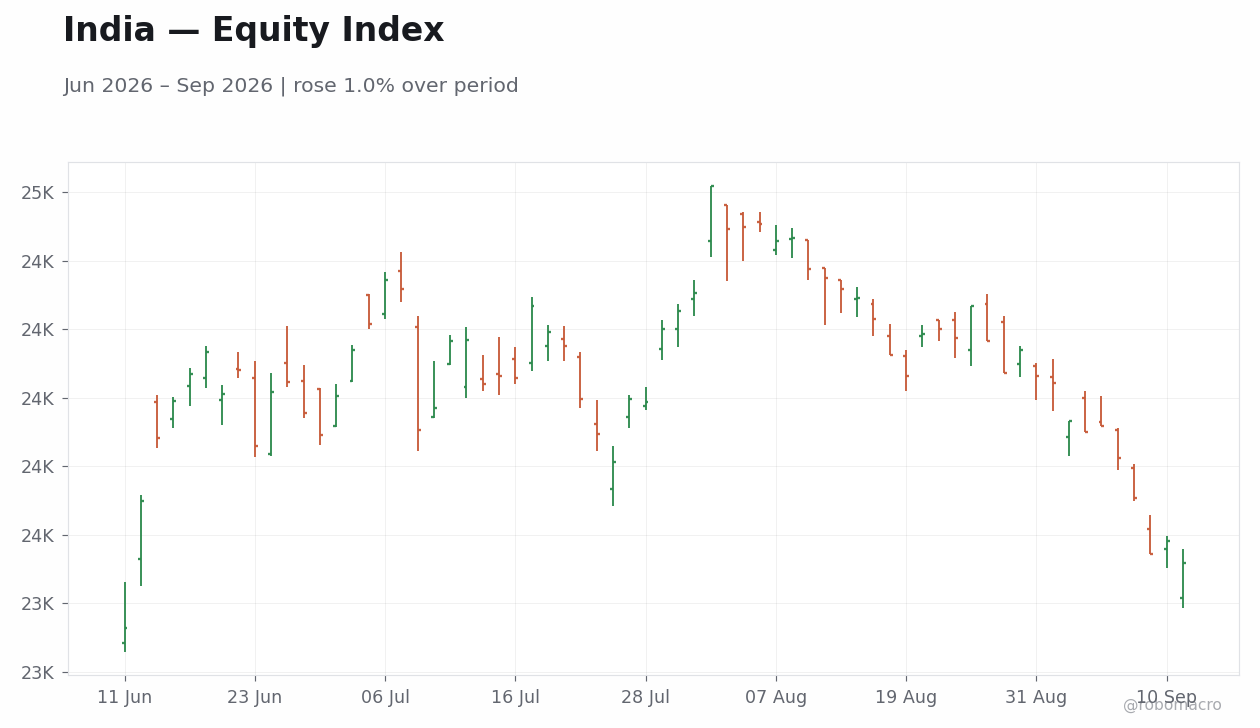
The S&P 500 fell 0.8% week-over-week to close at 7,657. The index opened the period at 7,719 on the prior Friday before declining to 7,674 on Tuesday, 7,636 on Wednesday and 7,592 on Thursday prior to a partial recovery on the final Friday. US equities showed modest overall weakness with the Nasdaq 100 down 0.6% to 29,368, the Dow Jones falling 1.6% to 52,573 and the Russell 2000 declining 2.4% to 2,904. In Europe the Euro Stoxx 50 fell 1.1% to 6,325, the FTSE 100 dropped 1.7% to 10,650, the DAX lost 1.8% to 25,569 and the CAC 40 declined 1.2% to 8,180 while the FTSE MIB rose 0.8% to 52,512. Asian indices were mostly lower as the Nikkei 225 fell 1.6% to 64,011 after trading at 66,400 on Monday, the Hang Seng dropped 3.3% to 24,806 and the S&P/ASX 200 declined 2.9% to 8,741 though the KOSPI gained 3.3% to 6,910. Emerging markets displayed mixed results with the Ibovespa up 1.1% to 187,207, the IPC Mexico down 1.4% to 63,925, the JSE Top 40 falling 1.4% to 107,760 and the Nifty 50 declining 2.1% to 23,398.
Regional Divergences
The S&P 500's 0.8% decline was milder than many European and Asian benchmarks where the DAX fell 1.8%, the FTSE 100 dropped 1.7% and the Nikkei 225 lost 1.6%. Outperformance appeared in the KOSPI which rose 3.3% and the FTSE MIB which gained 0.8% while the Russell 2000 underperformed with a 2.4% drop. These divergences reflected August nonfarm payrolls reinforcing labor-market resilience in the US against German industrial production contraction in Europe. In Japan final Q2 GDP beat consensus alongside hawkish signals that strengthened the yen as USD/JPY fell 1.4%. Canada reported a jobs decline while WTI Crude rose 9.4% to 100.05 and Brent Crude rose 8.7% to 104.61, supporting commodity-exposed EM equities such as the Ibovespa which advanced 1.1%.
Volatility & Risk Appetite
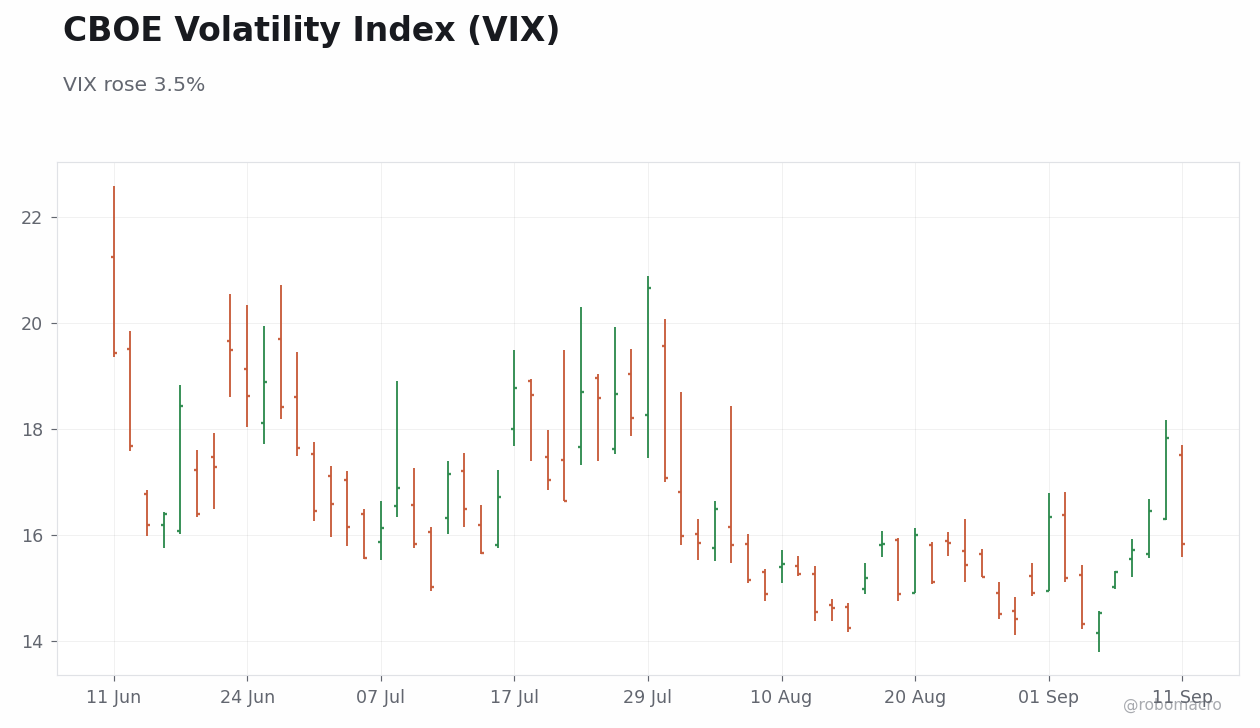
The VIX closed at 15.8 on Friday after rising to 17.8 on Thursday. Growth outperformed value as the Nasdaq 100 fell 0.6% compared with the Dow Jones decline of 1.6%. Small caps lagged large caps with the Russell 2000 down 2.4% versus the S&P 500's 0.8% loss. Commodity moves pointed to strength in energy sectors after WTI Crude rose 9.4% and Brent Crude rose 8.7% while rising yields across major markets reflected reduced near-term easing odds. Treasury yields moved higher with the United States 2Y at 4.56% and 10Y at 4.95% while similar increases occurred in the United Kingdom, Germany, France, Italy, Spain, Canada, Australia and South Korea, adding pressure on rate-sensitive areas and contributing to rotational flows away from small caps.
Week Ahead
The Fed decision is expected to be a primary driver alongside crude oil and global cues. Earnings reports from several major firms will also come into focus during the week. These events pose the biggest risk to equity markets as any hawkish signals following recent labor resilience and commodity gains could favour risk-off moves while softer inflation data prints would support risk-on sentiment. Limited additional scheduled releases leave cross-asset developments in oil and currencies as key secondary influences on global risk appetite.
| Index | Level | WoW | MTD | YTD |
|---|---|---|---|---|
| S&P 500 | 7,657 | -0.8% | +0.3% | +11.6% |
| Nasdaq 100 | 29,368 | -0.6% | +1.0% | +16.5% |
| Dow Jones | 52,573 | -1.6% | -0.4% | +8.7% |
| Russell 2000 | 2,904 | -2.4% | -0.6% | +15.8% |
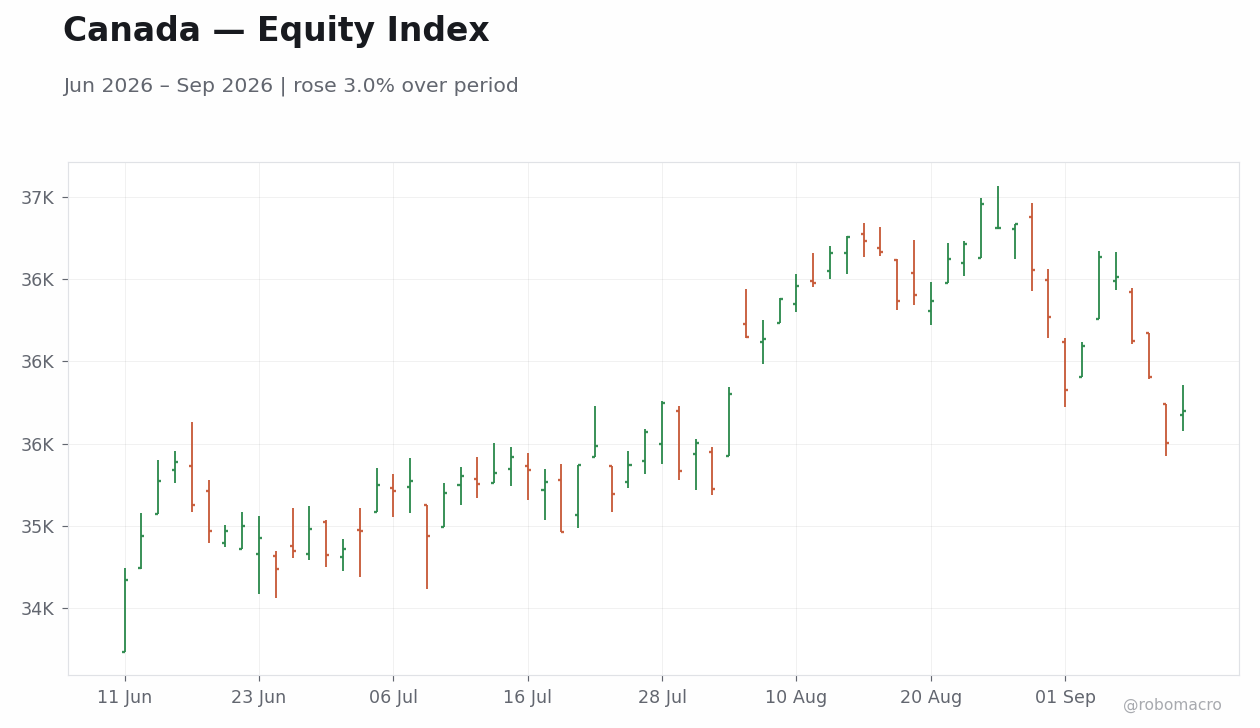
| S&P/TSX | 35,698 | -2.2% | -0.4% | +12.0% |
| FTSE 100 | 10,650 | -1.7% | -1.3% | +7.0% |
| Euro Stoxx 50 | 6,325 | -1.1% | -0.7% | +6.8% |
| DAX | 25,569 | -1.8% | -1.6% | +4.2% |
| CAC 40 | 8,180 | -1.2% | -1.5% | -0.2% |
| FTSE MIB | 52,512 | +0.8% | +1.1% | +15.7% |
| IBEX 35 | 19,838 | -1.1% | +0.1% | +13.4% |
| Nikkei 225 | 64,011 | -1.6% | -3.3% | +23.5% |
| Hang Seng | 24,806 | -3.3% | -2.1% | -5.8% |
| S&P/ASX 200 | 8,741 | -2.9% | -3.6% | +0.1% |
| KOSPI | 6,910 | +3.3% | +1.1% | +60.3% |
| Nifty 50 | 23,398 | -2.1% | -2.7% | -10.5% |
| Ibovespa | 187,207 | +1.1% | +4.2% | +16.6% |
| IPC Mexico | 63,925 | -1.4% | -0.9% | -0.3% |
| JSE Top 40 | 107,760 | -1.4% | -0.6% | -0.4% |
Global equities declined last week, led by the Hang Seng’s 3.3% drop and the S&P/ASX 200’s 2.9% fall. The KOSPI rose 3.3%, the sole major gainer, while the Ibovespa added 1.1%. US small-caps underperformed as the Russell 2000 fell 2.4% and the Dow Jones slipped 1.6%, compared with the S&P 500’s 0.8% decline. European bourses diverged, with the FTSE MIB up 0.8% against losses of 1.8% in the DAX and 1.2% in the CAC 40. In Asia, the Nikkei 225 fell 1.6% and the Nifty 50 declined 2.1%. Year-to-date leaders remain the KOSPI at +60.3% and the Nasdaq 100 at +16.5%. Next week’s focus turns to US CPI and upcoming central-bank speeches for fresh directional cues.
| Index | WoW | MTD | YTD |
|---|---|---|---|
| S&P 500 | -0.8% | +0.3% | +11.6% |
| Nasdaq 100 | -0.6% | +1.0% | +16.5% |
| Dow Jones | -1.6% | -0.4% | +8.7% |
| Russell 2000 | -2.4% | -0.6% | +15.8% |
| S&P/TSX | -2.2% | -0.4% | +12.0% |
| FTSE 100 | -1.7% | -1.3% | +7.0% |
| Euro Stoxx 50 | -1.1% | -0.7% | +6.8% |
| DAX | -1.8% | -1.6% | +4.2% |
| CAC 40 | -1.2% | -1.5% | -0.2% |
| FTSE MIB | +0.8% | +1.1% | +15.7% |
| IBEX 35 | -1.1% | +0.1% | +13.4% |
| Nikkei 225 | -1.6% | -3.3% | +23.5% |
| Hang Seng | -3.3% | -2.1% | -5.8% |
| S&P/ASX 200 | -2.9% | -3.6% | +0.1% |
| KOSPI | +3.3% | +1.1% | +60.3% |
| Nifty 50 | -2.1% | -2.7% | -10.5% |
| Ibovespa | +1.1% | +4.2% | +16.6% |
| IPC Mexico | -1.4% | -0.9% | -0.3% |
| JSE Top 40 | -1.4% | -0.6% | -0.4% |


Week in Review
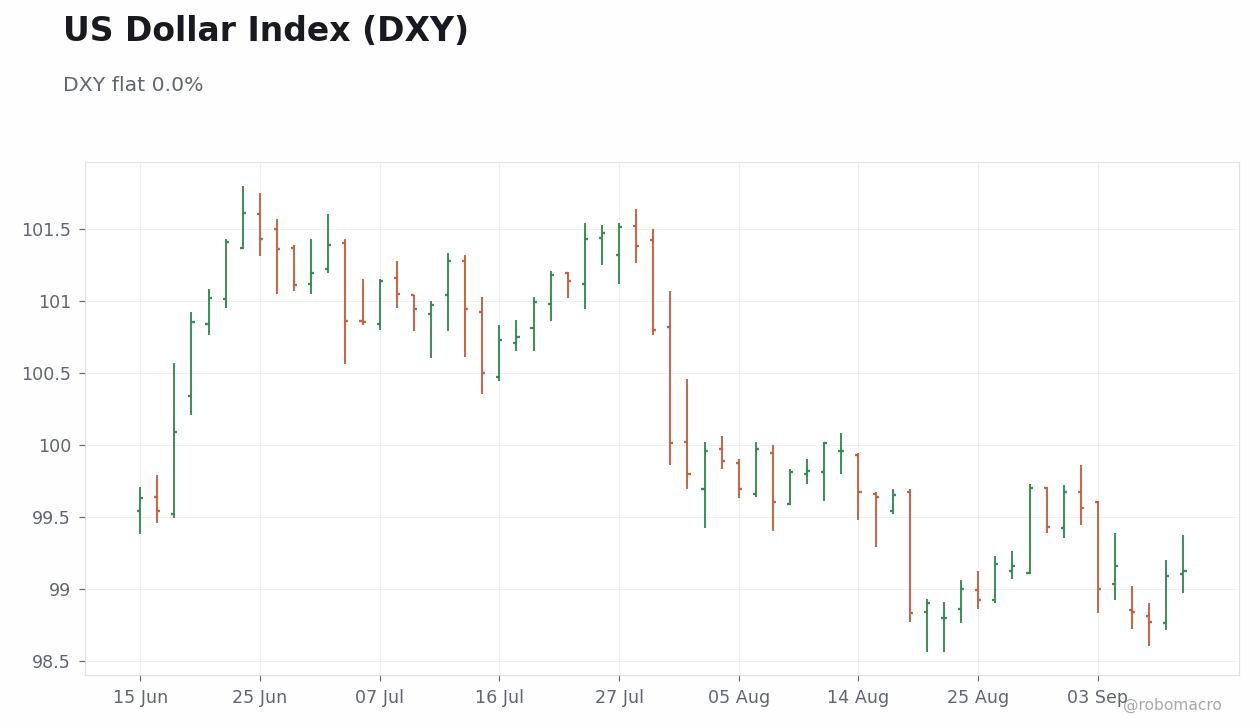
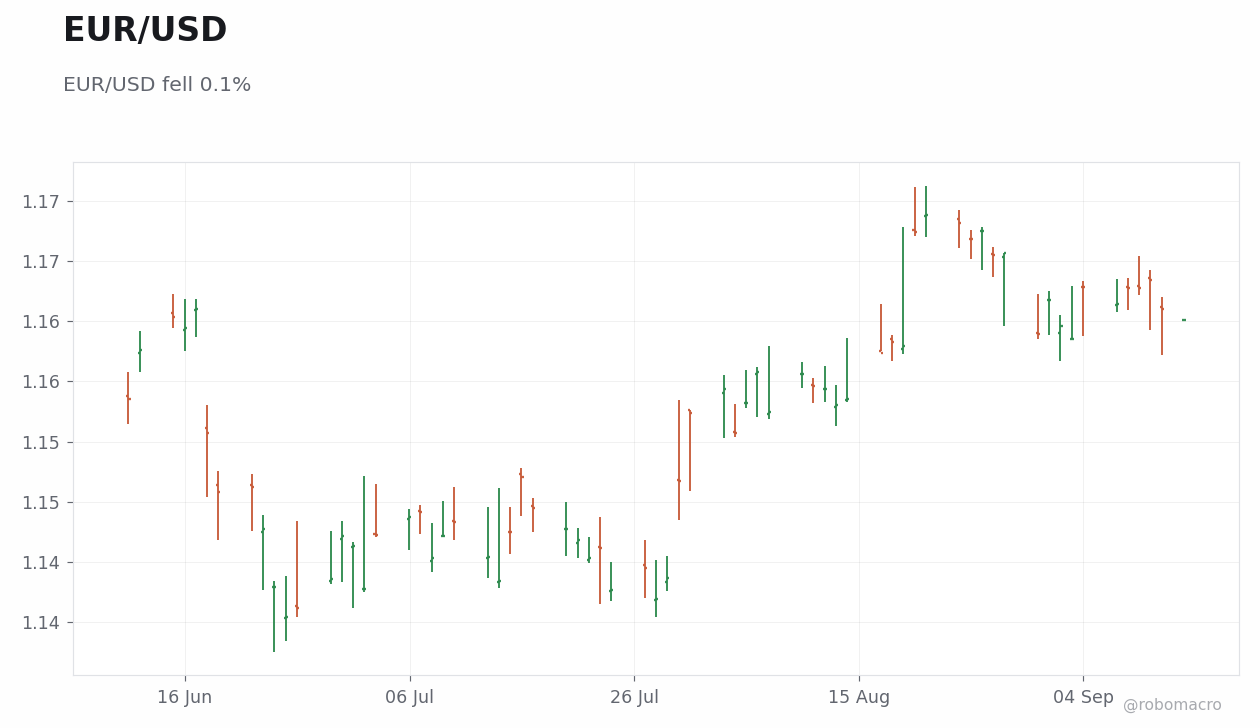
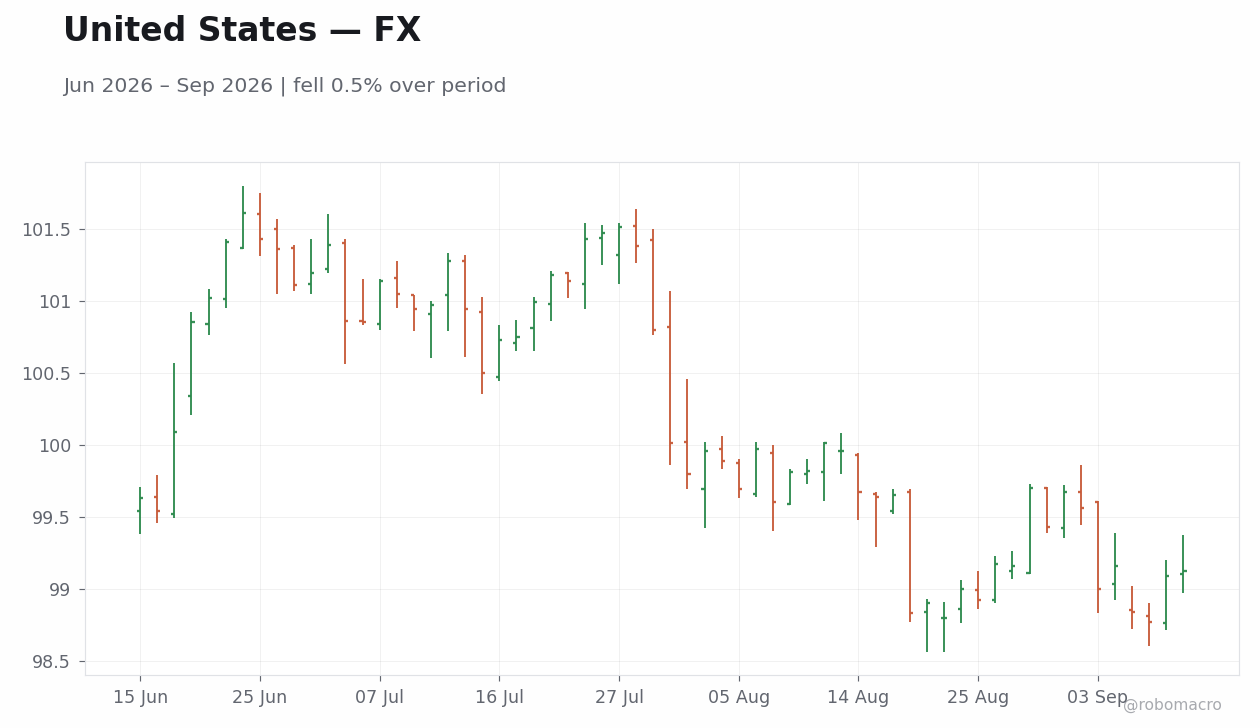
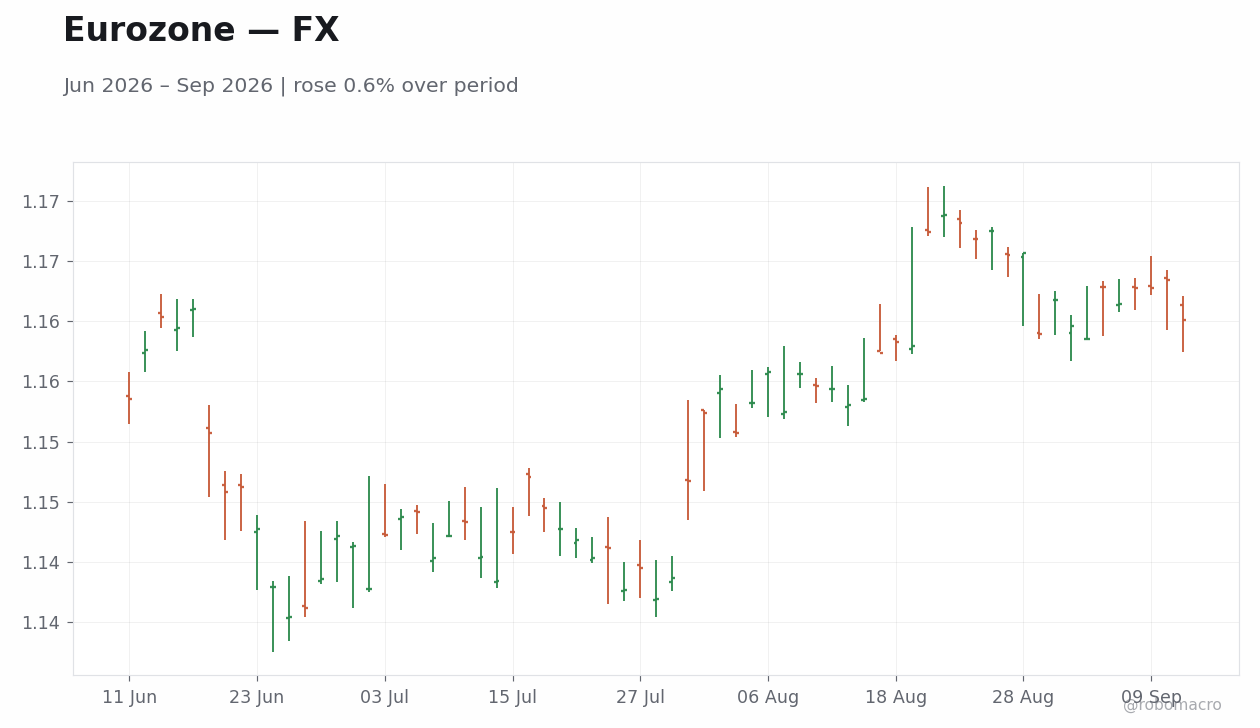
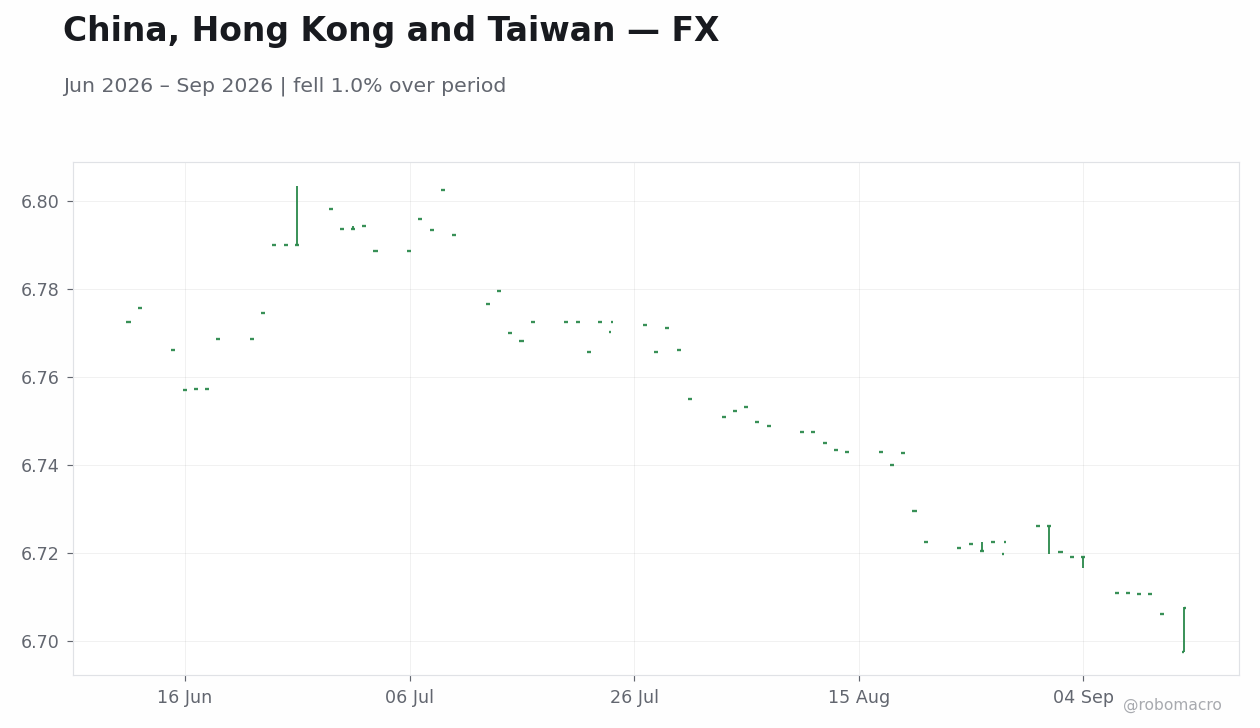
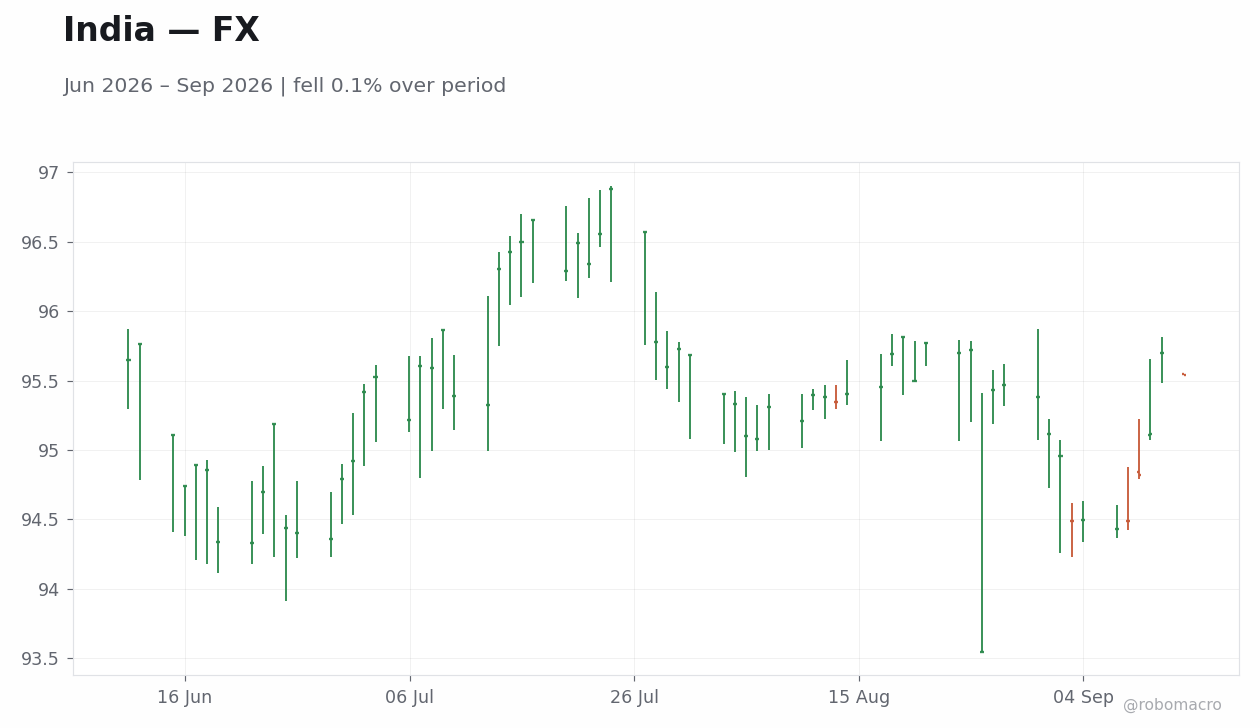
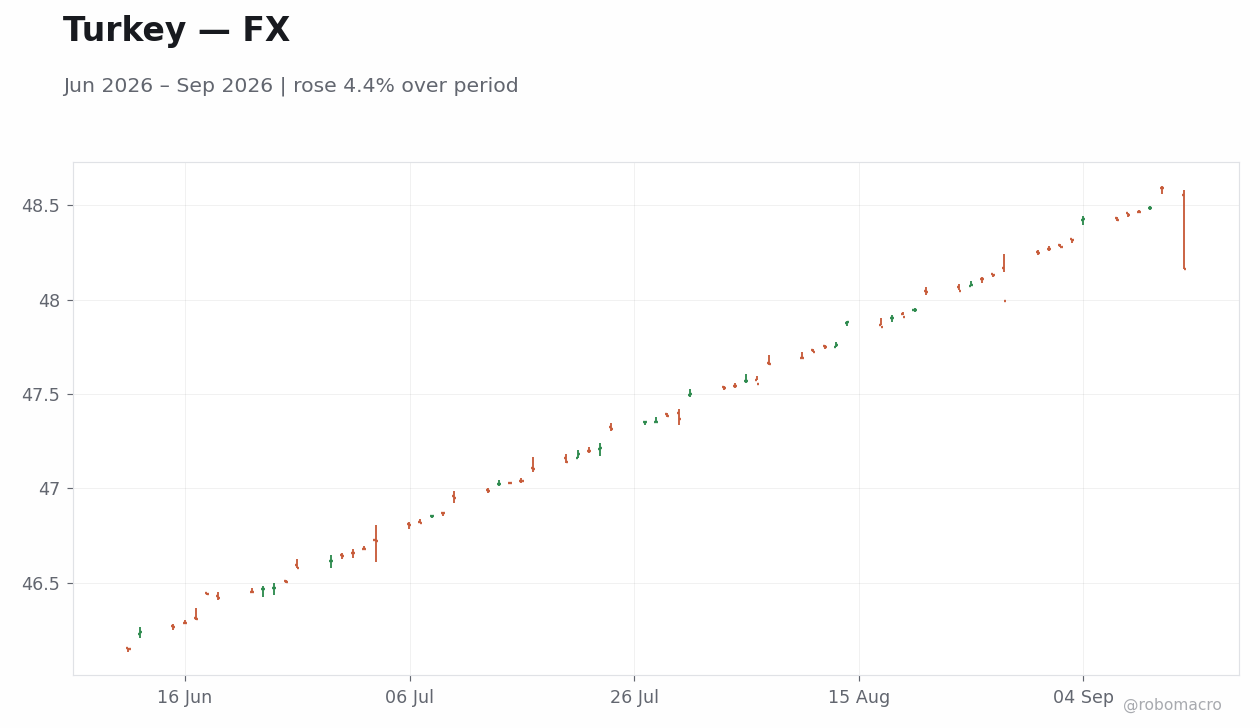
The DXY closed flat for the week at 99.12 with a -0.0% WoW change. The index remained at 98.8 on Tuesday and Wednesday before rising to 99.1 on Thursday and Friday. Among G10 currencies, EUR/USD declined 0.1% to 1.1601, GBP/USD was unchanged with +0.0% at 1.3523, USD/JPY fell 1.4% to 153.55, AUD/USD dropped 0.6% to 0.7164, and NZD/USD decreased 1.1% to 0.5816. EM FX was mixed, with USD/CNY easing 0.1% to 6.7075, USD/BRL flat with +0.0% at 5.1270, USD/MXN rising 0.5% to 16.96, USD/ZAR climbing 1.2% to 16.16, USD/TRY falling 0.5% to 48.16, and USD/INR advancing 1.2% to 95.54. USD/CAD rose 0.2% to 1.3866 and USD/CHF gained 0.7% to 0.8156, illustrating selective dollar resilience amid cross-asset rotation.
Dollar & G10
Diverging rate differentials supported the dollar as U.S. yields rose amid resilient labor data and higher energy prices, reducing near-term easing odds relative to peers. EUR/USD ended the week at 1.1601 after a 0.1% decline, rising from 1.1614 on Monday to a high of 1.1634 on Thursday before settling at 1.1610 on Friday. GBP/USD closed at 1.3523 with a 0.0% WoW move, showing limited directional conviction. USD/JPY fell 1.4% to 153.55 as the yen strengthened, moving from 156 on Monday to 153 on Wednesday and stabilizing at 154 on both Thursday and Friday, consistent with broader G10 currency rotation and policy adjustment signals.
EM FX
EM FX showed varied performance against the dollar, influenced by commodity price moves and bond yield differentials. USD/BRL was essentially unchanged at 5.1270 with a 0.0% WoW move as rising crude prices provided support. USD/MXN rose 0.5% to 16.96 following inflation data below expectations that eased pressure on the policy path. USD/ZAR advanced 1.2% to 16.16 while USD/TRY fell 0.5% to 48.16, reflecting divergent yield moves and local policy considerations. USD/CNY eased 0.1% to 6.7075 amid steady regional rates, highlighting how commodity strength and rate differentials continued to drive selective EM currency outperformance or weakness.
Bitcoin & Crypto
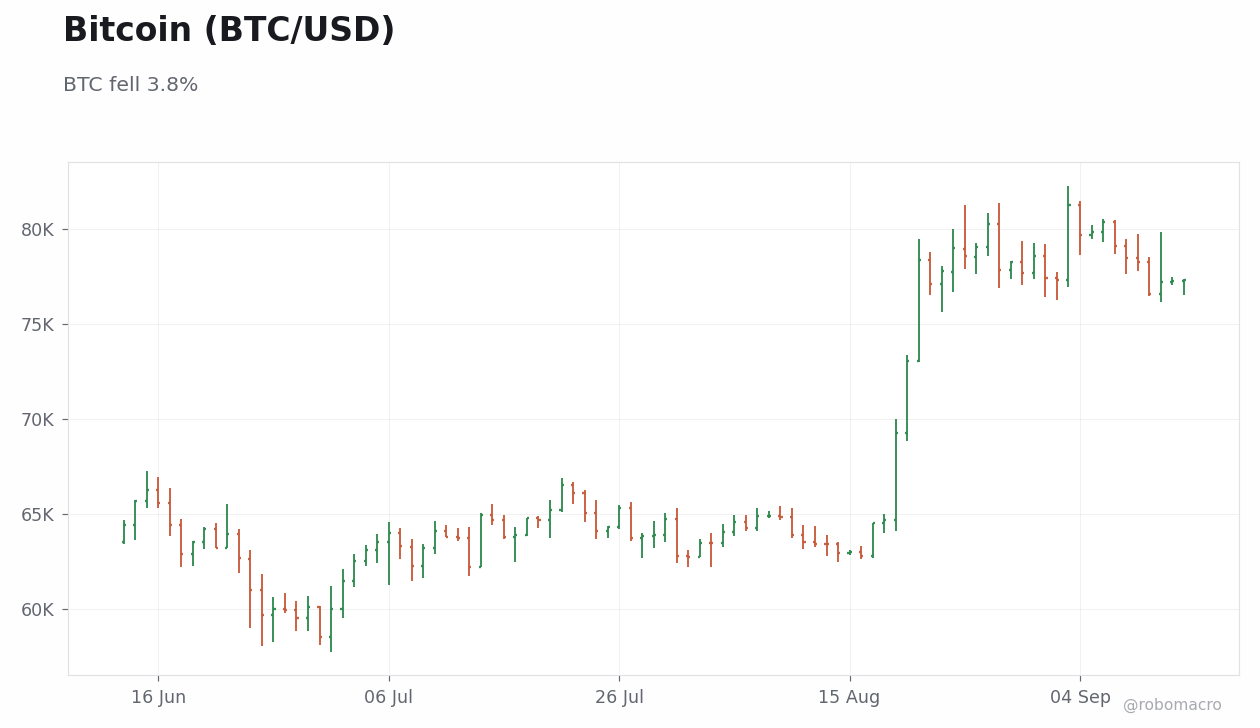
Bitcoin declined 3.8% to close at $77,305. Intra-week, Bitcoin moved from 78,260 on Wednesday to 76,568 on Thursday before recovering to 77,174 on Friday and 77,270 on Saturday, underscoring volatility even as the broader risk tone remained constructive. Ethereum was nearly flat, falling 0.1% to $2,513 with a modest rebound in the latter part of the period. Solana fell 4.6% to $102 while XRP dropped 4.4% to $1, underperforming Bitcoin as digital assets reflected selective profit-taking amid equity weakness and shifting macro sentiment.
Week Ahead
The economic calendar for the following week is light, with no major central bank rate decisions or CPI releases scheduled that would directly shift rate differentials. Trade balance data from select EM economies may influence currency positioning, though specific high-impact prints are limited. Markets will remain focused on ongoing data dependence across central banks and any commentary that could alter yield differentials. In digital assets, sentiment may hinge on broader risk appetite and regulatory discussions, with no specific on-chain events, protocol upgrades, or ETF deadlines noted.


Week in Review
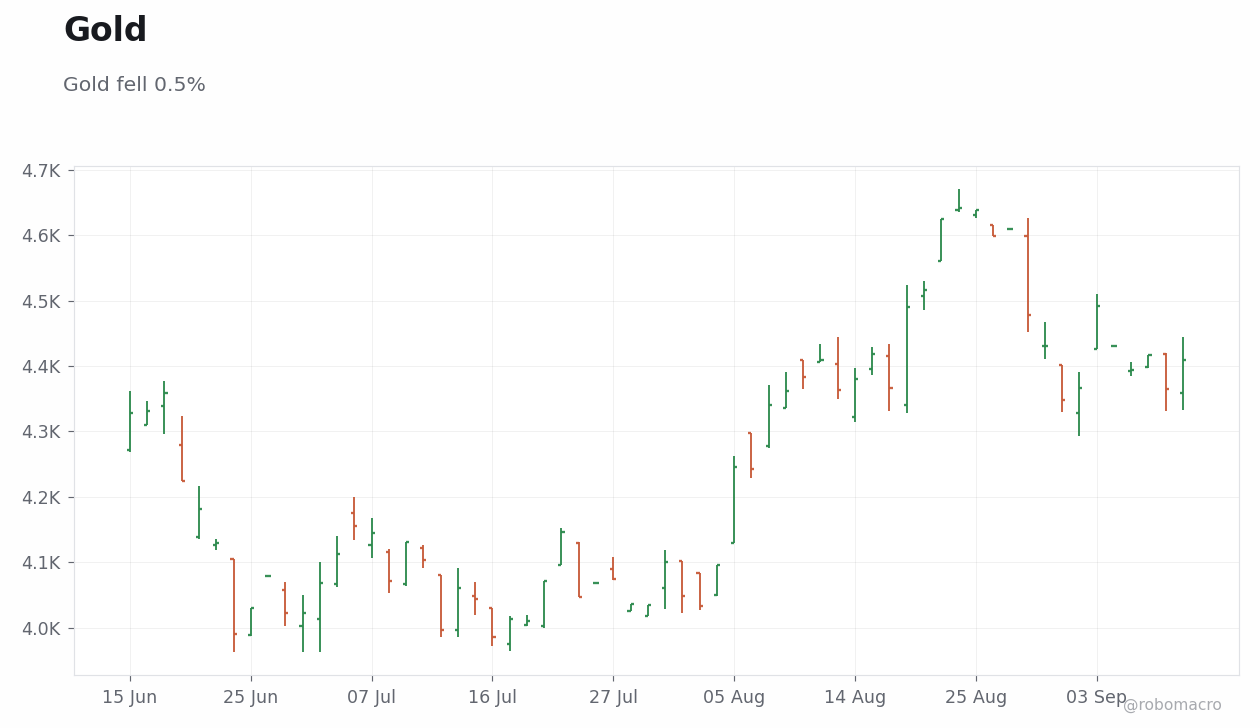
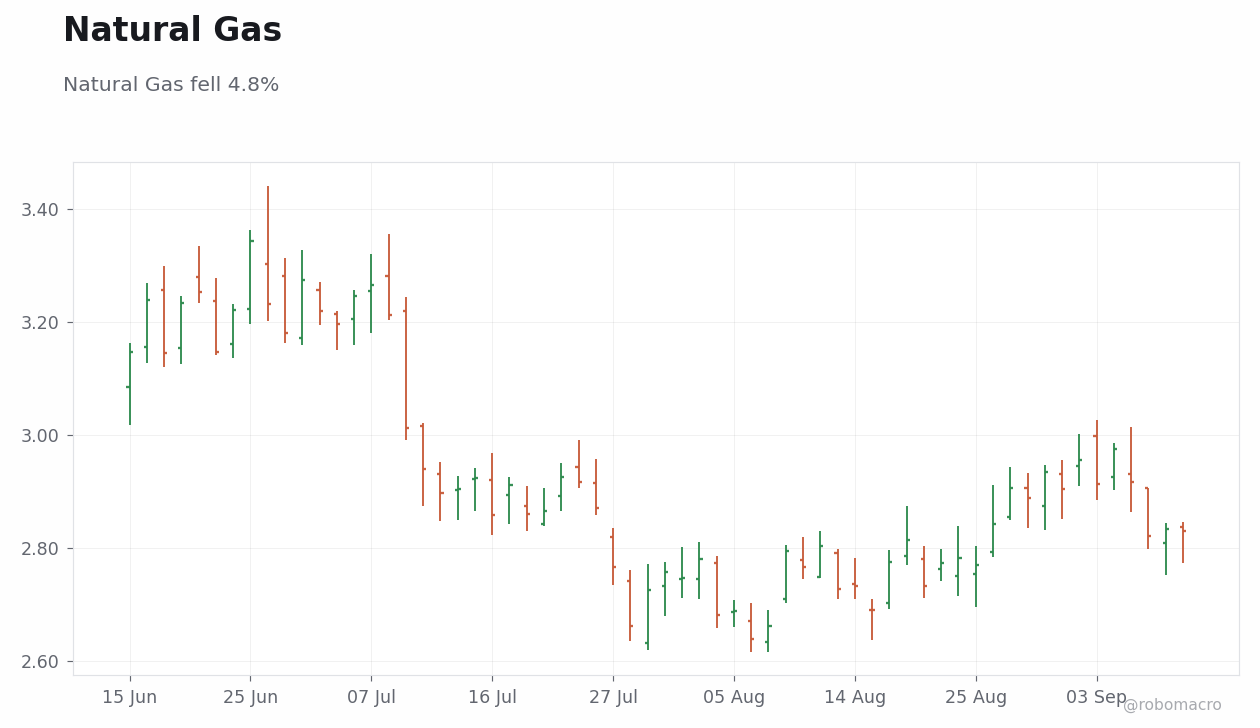
WTI Crude posted the largest weekly gain, rising +9.4% to 100.05. Brent Crude climbed +8.7% to 104.61 while Natural Gas fell -4.8% to 2.83. Gold declined -0.5% to 4408.90 and Silver fell -1.3% to 65.19. Copper slipped -0.7% to 6.55. Wheat rose +1.4% to 726.25. Using daily closes, WTI Crude advanced from 93.0 on Tuesday to 96.1 on Wednesday, reached 102 on Thursday, and settled at 100 on Friday while Gold moved from 4,394 to 4,416 then 4,364 before closing at 4,409.
Energy Complex
WTI Crude settled at 100.05 after a +9.4% weekly advance while Brent Crude reached 104.61 with an +8.7% gain. Natural Gas declined -4.8% to 2.83, trading from 2.9160 on Tuesday to 2.8220 on Wednesday before ending near 2.8310. Oil prices posted a big weekly gain amid supply risks tied to potential Middle East crude export disruptions even after slipping back on Friday. The energy surge reinforced inflation risks across global markets and highlighted persistent tightness in physical markets. Geopolitical factors remained central to the narrative as traders monitored developments that could affect future supply.
Metals & Ags
Gold closed at 4408.90 after falling -0.5% on the week while Silver declined -1.3% to 65.19. Copper fell -0.7% to 6.55, acting as a cautious growth signal amid mixed manufacturing trends. Wheat gained +1.4% to 726.25, diverging from its -4.9% month-to-date performance and offering selective support within agriculture. Iron Ore eased -1.6% to 98.02, adding to the softer tone across some industrial commodities. Precious metals showed relative resilience against the broader energy-driven inflation backdrop even as base metals reflected tempered optimism on global demand.
Week Ahead
The economic calendar for next week has no commodity-relevant events. There are no EIA crude or gas inventory reports, OPEC meetings, China PMI or industrial data releases, US CPI prints, or central bank meetings affecting commodity currencies such as the CAD, AUD, or BRL. With the schedule entirely light on fundamental catalysts, non-calendar risks will dominate. Geopolitical tensions, weather patterns for natural gas and agriculture, and OPEC diplomacy remain the primary drivers likely to shape commodity price action in the period ahead.
| Pair | Level | WoW | MTD | YTD |
|---|---|---|---|---|
| DXY | 99.12 | -0.0% | -0.6% | +0.7% |
| EUR/USD | 1.1601 | -0.1% | -0.1% | -1.3% |
| GBP/USD | 1.3523 | +0.0% | -0.2% | +0.4% |
| USD/JPY | 153.55 | -1.4% | -3.9% | -2.0% |
| AUD/USD | 0.7164 | -0.6% | -0.1% | +7.3% |
| NZD/USD | 0.5816 | -1.1% | -1.8% | +1.0% |
| USD/CAD | 1.3866 | +0.2% | +0.1% | +1.1% |
| USD/CHF | 0.8156 | +0.7% | +0.9% | +3.0% |
| USD/CNY | 6.7075 | -0.1% | -0.3% | -4.1% |
| USD/BRL | 5.1270 | +0.0% | -1.1% | -7.1% |
| USD/MXN | 16.96 | +0.5% | -0.2% | -5.7% |
| USD/INR | 95.54 | +1.2% | +0.5% | +6.2% |
| USD/ZAR | 16.16 | +1.2% | +0.4% | -2.4% |
| USD/TRY | 48.16 | -0.5% | -0.2% | +12.0% |
| Commodity | Level | WoW | MTD | YTD |
|---|---|---|---|---|
| WTI Crude | 100.05 | +9.4% | +10.9% | +74.5% |
| Brent Crude | 104.61 | +8.7% | +10.5% | +72.2% |
| Gold | 4408.90 | -0.5% | +1.4% | +2.2% |
| Silver | 65.19 | -1.3% | +0.9% | -7.6% |
| Copper | 6.55 | -0.7% | +0.6% | +16.1% |
| Natural Gas | 2.83 | -4.8% | -2.5% | -21.8% |
| Wheat | 726.25 | +1.4% | -4.9% | +43.4% |
| Iron Ore | 98.02 | -1.6% | -1.3% | -8.5% |
| Asset | Level | WoW | MTD | YTD |
|---|---|---|---|---|
| Bitcoin | $77,305 | -3.8% | -0.1% | -12.9% |
| Ethereum | $2,513 | -0.1% | +3.9% | -16.3% |
| Solana | $102 | -4.6% | +1.6% | -19.9% |
| XRP | $1 | -4.4% | +0.7% | -27.5% |
DXY was unchanged at 99.12 as USD/JPY led declines with a 1.4% drop to 153.55. NZD/USD fell 1.1% to 0.5816 and AUD/USD slipped 0.6% to 0.7164, while EUR/USD eased 0.1% to 1.1601. Offsetting gains came from USD/INR and USD/ZAR, both up 1.2% to 95.54 and 16.16, with USD/CHF rising 0.7% to 0.8156. USD/MXN added 0.5% to 16.96 as USD/TRY declined 0.5% to 48.16. The moves highlighted USD resilience against select EM currencies alongside broad JPY strength. Cross-market divergences widened between commodity-linked AUD and NZD versus INR and ZAR. Next week, attention turns to fresh inflation prints and central-bank commentary for further signals.
| Asset | Level | WoW |
|---|---|---|
| S&P 500 | 7656.98 | -0.2% |
| Nasdaq 100 | 29368.44 | -0.5% |
| Dow Jones | 52573.29 | -0.4% |
| Russell 2000 | 2903.94 | -1.9% |
| USD/JPY | 153.55 | -1.7% |
| EUR/USD | 1.16 | -0.1% |
| GBP/USD | 1.35 | +0.1% |
| Gold | 4408.9 | +0.3% |
| WTI Crude | 100.05 | +7.5% |
| Bitcoin | 77319.71 | -3.8% |


Labor Market Shows Resilience August payrolls arrived above the prior trend and sufficient to shift near-term policy pricing even as unemployment held steady. ADP employment change exceeded the prior reading and confirmed private-sector momentum. Weekly jobless claims remained near recent levels, providing no fresh downside surprise. These prints extended the pattern of selective labor-market softening observed in recent weeks without triggering an outright downturn signal.
Energy Prices Reassert Dominance WTI crude climbed over the five-day window, a 7.55 percent advance driven by inventory draws and supply signals. The move occurred against a backdrop of mid-phase expansion that left growth intact.
Yields Rise on Hawkish Repricing The 10-year Treasury yield advanced and the 2-year reached its weekly close, reversing earlier declines. Mortgage rates increased, transmitting higher borrowing costs into housing. Existing home sales forecasts pointed to month-over-month declines, underscoring rate-sensitive weakness.
Equities Absorb Mixed Flows The S&P 500 posted a net decline while the Russell 2000 fell further. Daily moves included losses early in the week before a rebound later. Trade tensions with Canada intensified with new tariffs, adding to cross-border uncertainty without immediate growth impact.
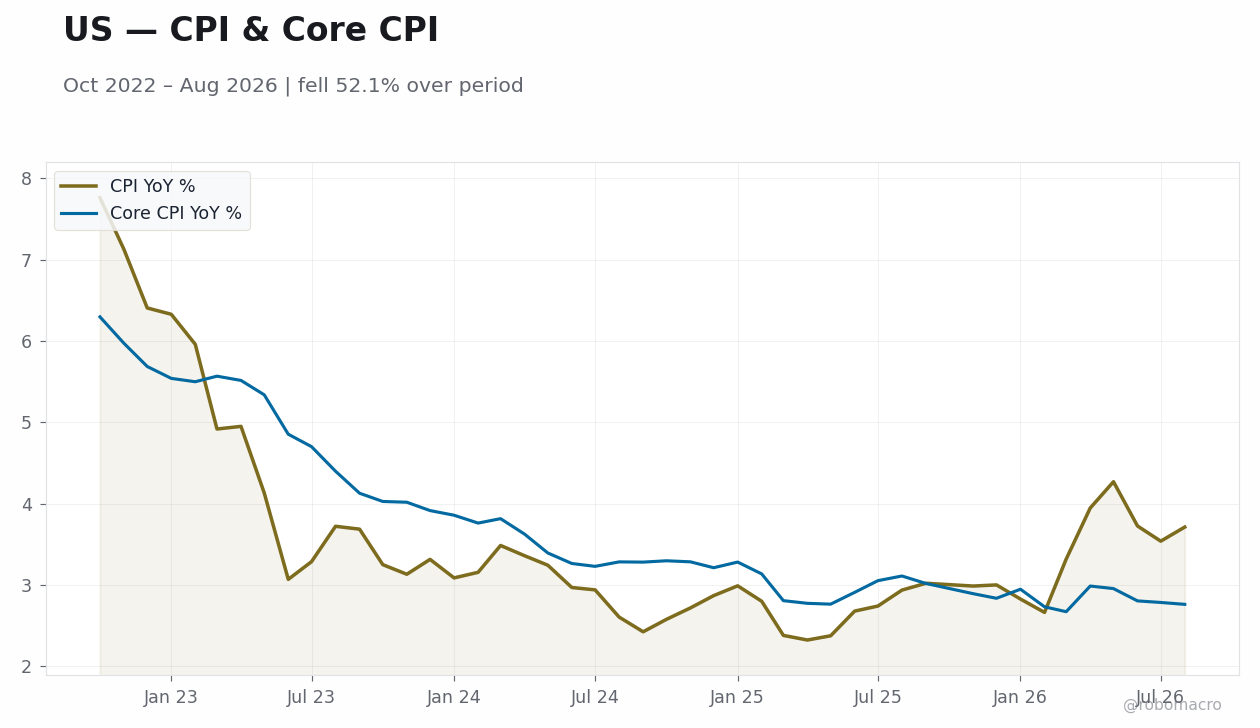
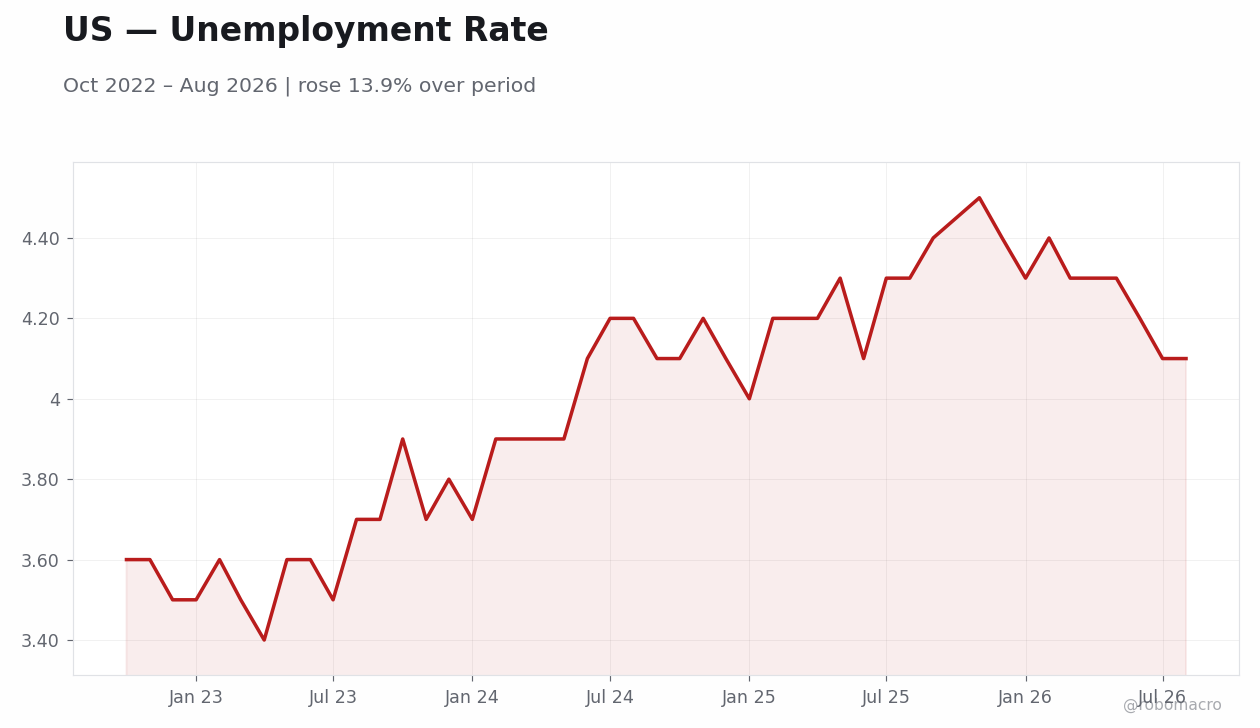
No Federal Reserve speakers or minutes were released during the September 7–11 window, leaving the policy rate path explicitly data-dependent. The August payrolls beat and ADP print reinforced labor-market resilience that supports a higher-for-longer stance. The 2-year yield closing at 4.56 percent and 10-year at 4.95 percent priced reduced near-term easing odds without invoking futures-implied probabilities. Prior FOMC communications had already flagged upside inflation risks from energy, a view reinforced by WTI’s advance to 100.05. The prior CPI YoY and unemployment rate remain the key anchors for the medium-term rate trajectory. We continue to expect the Federal Reserve to absorb the commodity impulse through incoming data rather than immediate recalibration. Trade tensions with Canada add a secondary uncertainty layer but have not yet altered domestic growth or inflation baselines.
No high-impact CPI or PPI actuals were released during the September 7–11 window, leaving the inflation picture anchored to prior readings. ADP employment change beat the prior print and aligned with the August payrolls beat that lifted hawkish Fed bets. Weekly jobless claims held near the recent consensus band, offering no material deviation. Existing home sales forecasts centered on continued month-over-month declines, confirming housing softness. Mortgage rates rose, transmitting the higher 10-year yield directly into consumer borrowing costs. API crude stocks declined versus an expected draw, supporting the 7.55 percent WTI advance. EIA inventory data showed a crude draw alongside a gasoline build, illustrating divergent product-market dynamics. These releases collectively point to a mid-cycle expansion where labor resilience offsets energy-driven inflation risks without altering the Federal Reserve’s data-dependent stance. Retail sales control group and import/export price prints scheduled for the following week will provide the next test of domestic demand momentum versus imported price pressure.
| Date | Ctry | Event | Prior | Cons. | Actual |
|---|---|---|---|---|---|
| Tue 8 | US | NFIB Business Optimism Ind | - | - | 98.7 |
| Tue 8 | US | ADP Employment Change Week | - | - | - |
| Tue 8 | US | Redbook Retail Sales Year- | - | - | - |
| Tue 8 | US | Used Car Prices Month-over | -1.4 | - | -0.90 |
| Tue 8 | US | Used Car Prices Year-over- | 1.3 | - | 0.40 |
| Tue 8 | US | Consumer Inflation Expecta | 3.6 | - | 3.6 |
| Tue 8 | US | 3-Month Treasury Bill Auct | - | - | 3.8 |
| Tue 8 | US | 6-Month Treasury Bill Auct | - | - | 3.9 |
| Tue 8 | US | 6-Week Treasury Bill Aucti | - | - | - |
| Tue 8 | US | 3-Year Treasury Note Aucti | - | - | 4.5 |
| Tue 8 | US | Consumer Credit Growth | 14.2bn | - | 18.1bn |
| Wed 9 | US | MBA 30-Year Mortgage Rate | - | - | 6.8 |
| Wed 9 | US | MBA Mortgage Applications | - | - | -2.7 |
| Wed 9 | US | MBA Mortgage Market Index | - | - | 241 |


Tuesday brings ADP employment change weekly and the NY Empire State Manufacturing Index. Wednesday features retail sales month-over-month, alongside import prices and the NAHB Housing Market Index. Business inventories are also due. Thursday includes the full CPI suite, directly testing the prior YoY pace. Friday offers no high-impact releases in the current calendar. These prints will shape views on whether expansion can withstand the 100.05 WTI level without fresh inflation pressure. Central bank speakers remain absent from the immediate schedule, preserving the data-dependent equilibrium.
The 7.55 percent WTI advance to 100.05 raises upside inflation risks that could delay any policy-rate reduction and extend the higher-for-longer configuration. Labor-market resilience at the August payrolls print and ADP reading reduces downside growth scenarios but leaves room for selective softening if claims rise. Trade tensions with Canada introduce cross-border spillover potential that has not yet affected GDP prints but could weigh on sentiment. Equity positioning appears stretched after the Russell 2000’s 1.90 percent decline while small-cap underperformance signals rotation away from rate-sensitive names. Volatility remains contained yet the 3.77 percent Bitcoin drop highlights risk-off flows that could accelerate if CPI exceeds consensus. Upside scenarios center on continued energy-driven price pressure without derailing growth; downside scenarios hinge on housing data confirming deeper weakness.
The S&P 500 fell 0.22 percent to 7656.98 while the Nasdaq 100 declined 0.47 percent to 29368.44 and the Dow Jones dropped 0.40 percent to 52573.29. The Russell 2000 underperformed with a 1.90 percent decline to 2903.94 amid small-cap sensitivity to higher yields. The 10-year Treasury yield rose and the 2-year reached 4.56 percent, producing a steeper curve on reduced easing odds. USD/JPY fell 1.69 percent to 153.55 while EUR/USD edged down 0.11 percent to 1.16 and GBP/USD gained 0.09 percent to 1.35, reflecting dollar softening against the yen. Gold advanced 0.34 percent to 4408.90 as a modest hedge against the energy impulse. WTI crude surged 7.55 percent to 100.05, the standout commodity move, while Bitcoin declined 3.77 percent to 77319.71 on risk-off flows. Daily equity rebounds on September 11 offset earlier losses but left the weekly net negative across major indices.
Brent crude’s earlier advance set the stage for WTI’s 7.55 percent surge to 100.05, transmitting imported inflation risks across net-energy importers. USD/JPY’s 1.69 percent decline to 153.55 aligned with yen strength observed in the prior window amid intervention warnings. Eurozone outcomes remained contained with German industrial production declining, offering no counter to the U.S. energy impulse. Canada–U.S. tariff escalation adds a direct trade channel that could affect North American supply chains without immediate GDP impact. Emerging-market data splits persist, with commodity exporters benefiting from the price move while domestic-demand economies face selective softening.
| Asset | Level | WoW |
|---|---|---|
| Euro Stoxx 50 | 6325.13 | -1.2% |
| DAX | 25568.56 | -1.7% |
| CAC 40 | 8179.77 | -1.5% |
| EUR/USD | 1.16 | -0.1% |
| EUR/GBP | 0.86 | -0.3% |
| EUR/JPY | 177.74 | -2.0% |
| Gold | 4408.9 | +0.3% |
| Brent Crude | 104.61 | +6.8% |
| Bitcoin | 77319.71 | -3.8% |


Manufacturing contraction leads the narrative. German industrial production fell 1.1% month-over-month in July, reversing the prior 0.2% gain. French industrial production also declined, extending the weakness beyond Germany’s borders. These outcomes reinforced the view that factory output remains the clearest drag on Eurozone momentum.
Trade balances diverged sharply. Germany’s trade surplus widened while exports dropped. France recorded a larger deficit. The combination of softer output and resilient surpluses in core economies left growth signals mixed rather than uniformly negative.
Markets absorbed the data without policy repricing. Equity indices posted modest early-week gains before closing lower, while the German 10-year Bund yield held steady. Brent crude’s advance to 104.61 dominated sentiment and offset some of the domestic growth concerns. Overall the week confirmed that energy price impulses continue to compete with activity softness without prompting immediate central-bank recalibration.
No ECB speakers delivered new guidance during the week, leaving the deposit rate path explicitly data-dependent as stated in prior communications. Minutes and recent interventions continued to tie policy adjustments to incoming inflation and activity prints rather than single-week surprises. The German industrial production miss and French output decline did not alter the medium-term rate outlook in official remarks. The data flow supports continued vigilance on energy-driven price pressures. Officials have reiterated that the deposit rate remains the primary instrument and will respond to cumulative evidence rather than isolated releases. The week’s energy price advance to 104.61 for Brent reinforces the case for monitoring imported inflation risks without shifting the current stance. Market participants therefore price the next policy move as conditional on subsequent growth and price data through the balance of the quarter.
German industrial production printed -1.1% month-over-month in July, reversing the prior 0.2% gain and marking the largest downside surprise of the period. Trade balance data showed a wider surplus than expected, driven by a month-over-month export decline that still produced a wider surplus than forecast. French industrial production fell while the French trade deficit widened. These releases together indicate that manufacturing momentum has deteriorated more than anticipated in the third quarter. The data point to a cycle position where domestic demand remains selective and external trade provides limited offset. The prints reinforce a data-dependent rate path that tolerates divergent activity signals without immediate adjustment. The combination of weak output and rising energy prices leaves the growth outlook tilted lower while inflation vigilance stays elevated.
| Date | Ctry | Event | Prior | Cons. | Actual |
|---|---|---|---|---|---|
| Mon 7 | NL | Household Consumption Year | 1.7 | - | - |
| Mon 7 | DE | Industrial Production Mont | 0.20 | - | -1.1 |
| Mon 7 | FR | Foreign Exchange Reserves | 357.1bn | - | 380.7bn |
| Mon 7 | AT | Wholesale Prices Month-ove | 0.80 | - | 0.90 |
| Mon 7 | AT | Wholesale Prices Year-over | 6.9 | - | 8.2 |
| Mon 7 | FR | 12-Month French BTF Treasu | - | - | 2.9 |
| Mon 7 | FR | 3-Month French BTF Treasur | - | - | 2.5 |
| Mon 7 | FR | 6-Month French BTF Treasur | - | - | 2.7 |
| Mon 7 | DE | 3-Month German Bubill (Tre | 2.4 | - | 2.5 |
| Mon 7 | DE | 9-Month German Bubill (Tre | 2.6 | - | 2.7 |
| Mon 7 | NL | 3-Month Treasury Bill Auct | 2.4 | - | 2.5 |
| Mon 7 | NL | 6-Month Treasury Bill Auct | 2.5 | - | 2.6 |
| Mon 7 | IE | Construction PMI Index | 53.0 | - | - |
| Tue 8 | NL | Inflation Rate Month-over- | 1.6 | - | 0.30 |
High-impact releases will test whether sentiment has stabilized after the industrial production weakness. The sequence will provide fresh signals on price pressures and labor-market resilience ahead of the next ECB meeting. Central bank speakers remain light, keeping focus on the data prints themselves. Markets will watch whether upcoming prints confirm or contradict the manufacturing slowdown signaled earlier in September.
The German industrial production contraction raises downside growth risks while Brent’s advance to 104.61 elevates upside inflation scenarios. Positioning appears light on duration given the German 10-year Bund yield stability, suggesting limited conviction on near-term easing. Volatility in energy markets could amplify equity swings if Brent sustains levels above 100. The data-dependent ECB stance reduces the probability of immediate policy mispricing but leaves room for repricing if subsequent prints deviate sharply. Upside risks center on resilient trade surpluses supporting the euro, while downside risks stem from further manufacturing spillovers into services. Flow considerations favor defensive positioning until the next round of activity data clarifies the cycle trajectory.
Equities opened the week higher before reversing. Euro Stoxx 50 closed the period at 6,325.13 for a 1.23% net decline. DAX moved to 25,568.56, down 1.68% week-over-week, while CAC 40 declined 1.52% to 8,179.77. Bonds saw the German 10-year Bund yield hold steady after an early decline. FX markets showed limited movement, with EUR/USD closing at 1.16 for a 0.11% weekly decline and EUR/JPY falling 2.02% to 177.74. Commodities dominated price action as Brent crude surged 6.83% to 104.61 and gold rose 0.34% to 4,408.90. The configuration reflects energy-driven inflation concerns offsetting equity downside from manufacturing data.
Brent crude’s weekly gain to 104.61 reflects ongoing supply concerns that spill directly into Eurozone imported inflation. Trade dynamics remain pressured by the German export decline, limiting offset from external demand. Broader DM refusal to recalibrate policy on single prints continues to anchor the global data-dependent equilibrium.
| Asset | Level | WoW |
|---|---|---|
| Nikkei 225 | 64011.34 | -3.6% |
| USD/JPY | 153.55 | -1.7% |
| EUR/JPY | 177.74 | -2.0% |
| GBP/JPY | 207.04 | -1.9% |
| Gold | 4408.9 | +0.3% |
| Brent Crude | 104.61 | +6.8% |
| Bitcoin | 77319.71 | -3.8% |


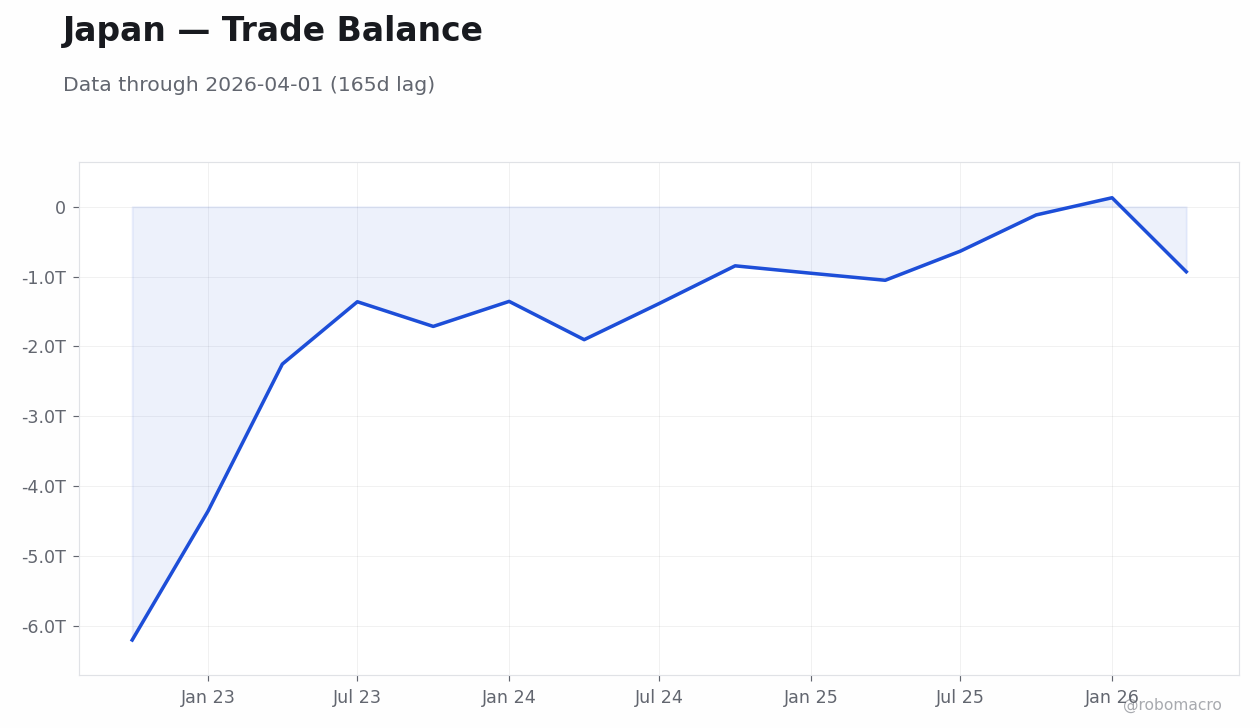
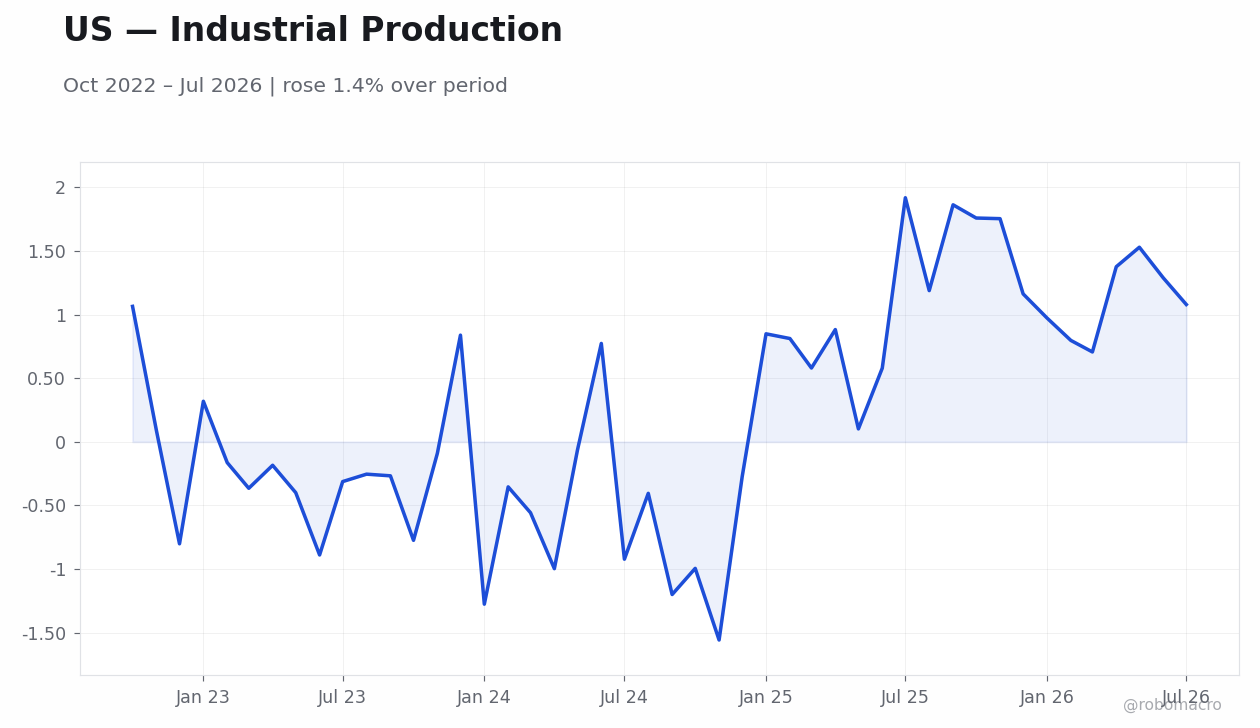
GDP Revision and External Strength Final Q2 GDP annualized exceeded consensus though below the prior reading, while quarter-over-quarter growth held in line with expectations. The current account balance shifted to surplus versus the prior deficit. These releases confirmed resilience in external demand and supported expectations that underlying inflation remains near the CPI target.
Yen Strength and Equity Pressure USD/JPY declined to close the week at 153.55 while the Nikkei 225 fell 3.6 percent to 64,011.34. The yen touched its strongest level since February amid repeated reports of Ministry of Finance Treasury sales to fund intervention. Japanese exporters, particularly automakers, faced margin compression as the currency move arrived faster than internal hedging plans anticipated.
Commodity Impulse and Yield Response Brent crude advanced 6.83 percent to 104.61, lifting imported inflation risks and weighing on risk assets. The Japan 2-year yield rose and the 10-year yield moved higher, reflecting sustained pressure at the front end of the curve. Wage growth at its fastest pace since 1997 further anchored the view that domestic momentum supports gradual normalization.
Policy Communication Overlay BoJ board member Masu’s speech on economic activity, prices and monetary policy reinforced the case for additional tightening to complete normalization. Markets absorbed the remarks without immediate policy recalibration, consistent with the data-dependent stance maintained across the prior three weeks. The combination of the GDP beat, current account surplus and elevated energy prices left the expansion in its mid-phase.
BoJ board member Masu stated that further rate increases are required to complete normalization, directly linking the GDP print and wage momentum to the policy outlook. The final Q2 data and current account surplus supplied fresh evidence that domestic demand and external balances remain consistent with the inflation target. Officials have kept the path explicitly data-dependent, with no indication of a shift in parameters on the basis of single-week prints. The 2-year yield and 10-year yield reflect the cumulative effect of these communications on the front end of the curve. Incoming inflation and trade prints will inform whether the current policy rate requires further adjustment ahead of the next meeting.
| Date | Ctry | Event | Prior | Cons. | Actual |
|---|---|---|---|---|---|
| Mon 7 | JP | Average Cash Earnings Year | 3.4 | - | 4.7 |
| Mon 7 | JP | Overtime Pay Year-over-Yea | 2.8 | - | 3.1 |
| Mon 7 | JP | Current Account Balance | -923.0bn | - | 2989.0bn |
| Mon 7 | JP | GDP Growth Annualized Fina | 1.8 | 1.1 | 1.4 |
| Mon 7 | JP | GDP Growth Quarter-over-Qu | 0.50 | 0.30 | 0.40 |
| Mon 7 | JP | Bank Lending Year-over-Yea | 5.4 | - | 5.4 |
| Mon 7 | JP | GDP Capital Expenditure Qu | -0.70 | - | -0.90 |
| Mon 7 | JP | GDP External Demand Quarte | 0.30 | 0.50 | 0.50 |
| Mon 7 | JP | GDP Price Index Year-over- | 3.2 | - | 2.6 |
| Mon 7 | JP | GDP Private Consumption Qu | 0.30 | - | 0 |
| Mon 7 | JP | 5-Year Japanese Government | 2.2 | - | - |
| Tue 8 | JP | Eco Watchers Survey Curren | 45.7 | - | 46.4 |
| Tue 8 | JP | Eco Watchers Survey Outloo | - | - | 48.3 |
| Tue 8 | JP | 6-Month Treasury Bill Auct | 1.2 | - | - |

Trade Balance, Exports Year-over-Year, Machinery Orders Month-over-Month and Machinery Orders Year-over-Year release mid-week and will update external demand signals that feed directly into Bank of Japan assessments of the rate path. Inflation Rate Year-over-Year and Core Inflation Rate Year-over-Year print later in the week, providing the clearest read on whether elevated energy costs are passing through to consumer prices. The Bank of Japan Interest Rate Decision follows. These releases matter because they will show whether the GDP outcome and current account surplus are being sustained amid the commodity impulse. Stronger-than-expected inflation or machinery orders would reinforce the case for further adjustment at upcoming decisions, while softer prints would keep the path tethered to incoming data without immediate recalibration. Cross-yen volatility is expected to remain sensitive to any shift in global risk appetite around these releases.
The advance in Brent crude raises the possibility that imported inflation could outpace the CPI target and force a faster pace of adjustment than the current data-dependent framework anticipates. Further yen gains beyond the recent close could constrain exporters and weigh on the Nikkei level, creating a downside scenario for growth that offsets the GDP beat. Upside risks center on sustained wage momentum and the current account surplus supporting a quicker return to the inflation target. The market appears to underweight the interaction between the oil shock and the BoJ’s stated need for additional tightening, leaving scope for sharper front-end yield moves if inflation data confirm pass-through.
| Asset | Level | WoW |
|---|---|---|
| S&P/TSX | 35697.5 | -1.2% |
| USD/CAD | 1.39 | +0.2% |
| EUR/CAD | 1.61 | +0.1% |
| WTI Crude | 100.05 | +7.5% |
| Natural Gas | 2.83 | -2.9% |
| Gold | 4408.9 | +0.3% |
| Brent Crude | 104.61 | +6.8% |
| Bitcoin | 77319.71 | -3.8% |


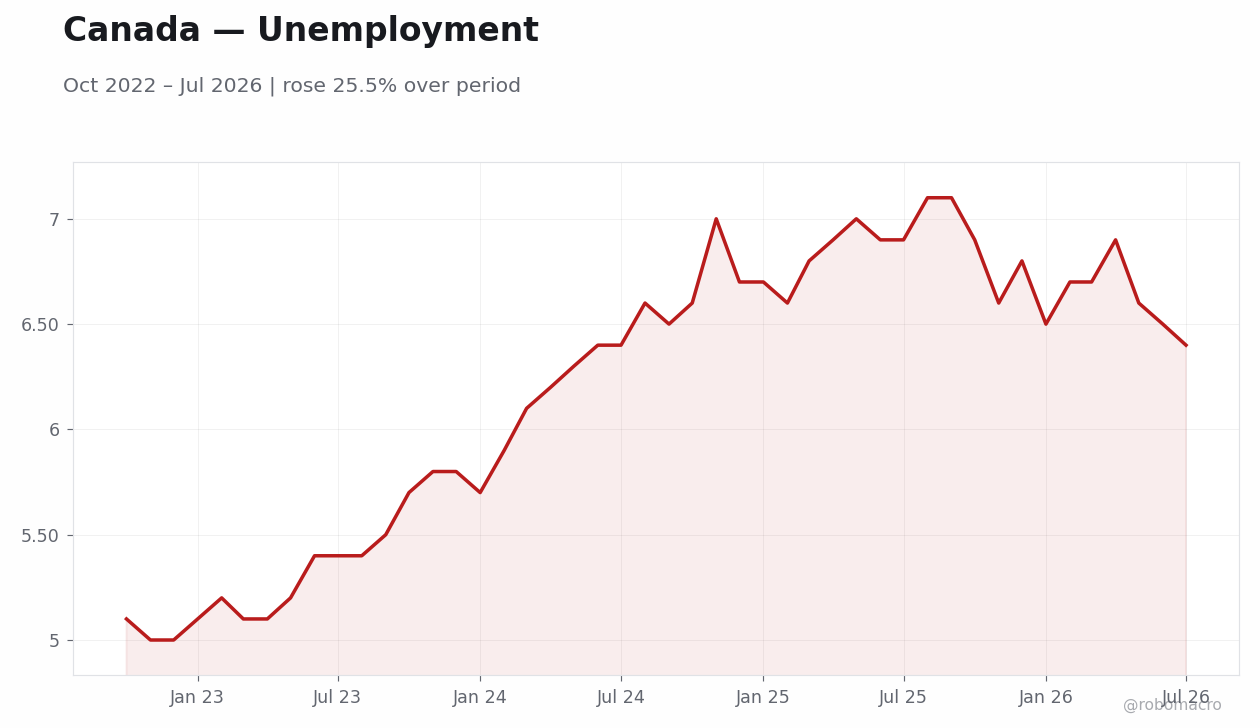
Labor market softening dominates domestic narrative. Statistics Canada reported a jobs decline for August that exceeded expectations and left the unemployment rate unchanged, marking the clearest downside surprise of the week. The broad-based employment drop weighed on the S&P/TSX, which closed the period at 35697.5 for a 1.18 percent weekly decline.
Trade tensions escalate alongside energy strength. Canada implemented retaliatory tariffs on U.S. imports after negotiations stalled, shifting market focus from domestic indicators to external policy risks. WTI crude climbed from 91.48 to 100.05 while Brent advanced from 96.28 to 104.61, providing a revenue tailwind for energy producers even as export-oriented equities faced pressure.
Policy rate decision reinforces data dependence. The Bank of Canada left the overnight target unchanged on September 9, referencing the latest CPI reading as justification for holding amid rising imported inflation risks from tariffs and higher oil. The 10-year government yield fell while the 2-year yield held steady, flattening the curve.
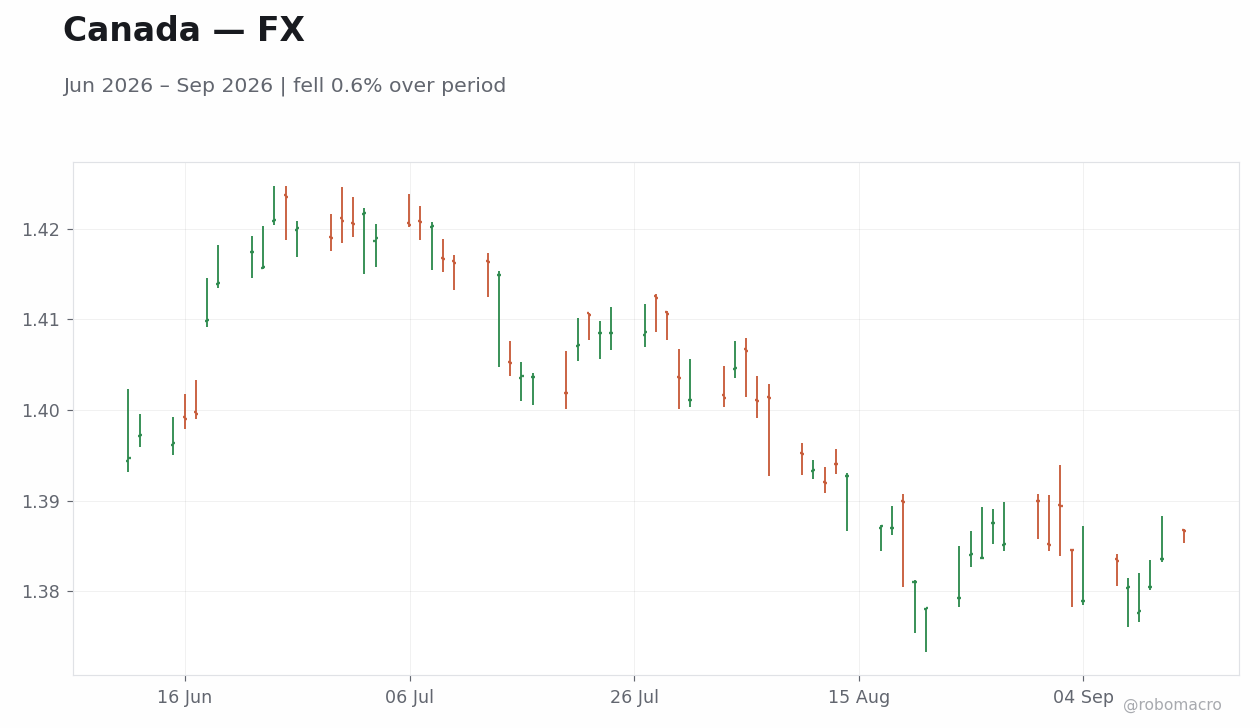
Currency and equity markets reflect mixed impulses. USD/CAD finished at 1.39 after modest weekly gains of 0.23 percent, supported by oil strength yet tempered by the jobs miss. EUR/CAD closed at 1.61, up 0.09 percent over the week, as investors weighed trade-war headlines against steady policy.
Broader cycle positioning remains mid-phase. The combination of labor-market weakness and commodity-driven price pressures left the expansion without synchronized momentum, consistent with the pattern observed in prior weeks where central banks absorbed divergent prints without immediate recalibration.
The Bank of Canada held the policy rate steady on September 9 after the August employment report showed a jobs decline and unemployment remained unchanged. Officials cited the year-over-year CPI print as evidence that inflation risks remain elevated, particularly with retaliatory tariffs now in force on U.S. goods. No forward guidance shifts were signaled, leaving the path explicitly tethered to incoming data on prices and activity. The jobs shortfall and steady rate decision together indicate that labor-market softening has not yet overridden the inflation vigilance embedded in recent communications. Energy price gains, with WTI at 100.05 and Brent at 104.61, add to imported cost pressures that the Bank must monitor through the next decision window.
| Date | Ctry | Event | Prior | Cons. | Actual |
|---|---|---|---|---|---|
| Wed 9 | CA | 5-Year Bond Auction | - | - | 3.5 |


Canada’s Inflation Rate Year-over-Year is scheduled for release on September 14 alongside the Core Inflation Rate Year-over-Year and Inflation Rate Month-over-Month prints, providing the first fresh gauge of price momentum. Housing Starts Level data follow on September 16 and will test whether elevated borrowing costs continue to constrain residential construction after the August jobs miss. These releases matter for the Bank of Canada rate path because they will clarify whether tariff-related cost pressures are feeding through to headline and core measures or whether demand weakness is beginning to dominate. The Inflation Rate Year-over-Year outcome will be watched particularly closely for any deviation from the prior level that could alter the balance between inflation vigilance and growth concerns. Housing Starts will offer an early read on whether the labor-market softening is translating into reduced household formation and spending. Together the data will inform whether the current policy rate remains appropriate or whether the upcoming decisions will require adjustment in either direction.
The jobs miss introduces downside risks to domestic demand that could compound if trade tensions persist, while higher oil prices simultaneously lift fiscal balances and imported inflation. Upside scenarios center on energy-driven CAD support and producer revenues offsetting tariff costs, whereas downside scenarios feature further labor-market deterioration feeding into weaker consumer spending and housing. The market appears to underweight the persistence of elevated inflation amid tariff implementation, potentially mispricing the duration of the current policy rate stance. Escalating cross-border measures could sustain price pressures longer than expected, shifting the growth-inflation balance toward caution at the next decision.
| Asset | Level | WoW |
|---|---|---|
| IPC Bolsa | 63924.77 | -1.2% |
| USD/MXN | 16.96 | +0.5% |
| EUR/MXN | 19.68 | +0.3% |
| WTI Crude | 100.05 | +7.5% |
| Silver | 65.19 | -1.7% |
| Gold | 4408.9 | +0.3% |
| Brent Crude | 104.61 | +6.8% |
| Bitcoin | 77319.7 | -3.8% |


Inflation undershoot shapes the data flow. Mexico’s August inflation rate came in below consensus on a monthly basis and below expectations on a year-over-year basis. The modest shortfall arrived mid-week and produced limited immediate market reaction beyond curve steepening.
Commodity strength offsets equity weakness. WTI crude and Brent crude climbed over the week, providing direct support to Mexican energy linkages. The IPC Bolsa index nevertheless finished lower week-over-week.
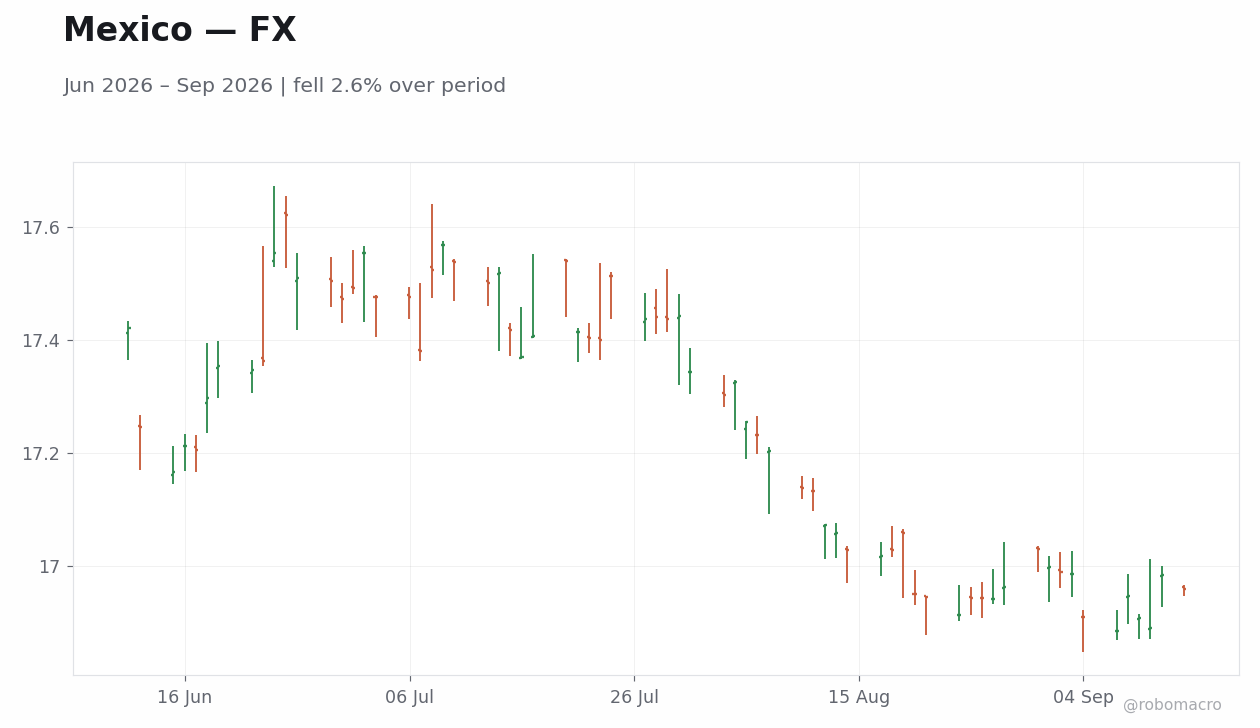
Peso resilience persists amid thin domestic data. USD/MXN traded in a narrow range before settling at 16.96, a net gain that kept the currency below the 17 threshold. EUR/MXN ended at 19.68 after a weekly advance, consistent with remittance inflows noted earlier in the period.
Yield curve steepens on mixed signals. The short-term Mbono rate held steady while the long-term rate moved higher, producing a steeper profile despite the soft inflation release. No domestic releases occurred to alter that configuration.
External energy impulse dominates the narrative. Rising crude prices coincided with the inflation print and limited any downside pressure on the peso. The configuration left growth and inflation signals in tension without prompting immediate policy recalibration.
Activity backdrop remains secondary. No high-impact Mexican releases beyond inflation appeared on the calendar, so attention stayed on global commodity moves and their pass-through to imported components. The week therefore reinforced a data-dependent equilibrium rather than shifting expectations for the policy rate.
Banco de Mexico received a below-consensus August inflation print with no accompanying communications from board members. The undershoot relative to consensus expectations arrived against elevated energy prices that could still influence future imported inflation components. Officials maintained the explicit data-dependent stance observed in prior periods, with the policy rate unchanged and no minutes or speeches released during the week. The soft print supplies additional evidence that price pressures remain contained, yet the concurrent advance in WTI crude and rise in Brent crude introduce an offsetting channel that policymakers will need to monitor through the next decision cycle. Absent fresh forward guidance, the configuration leaves the rate path tethered to incoming inflation and activity data rather than any single release.
| Date | Ctry | Event | Prior | Cons. | Actual |
|---|---|---|---|---|---|
| Mon 7 | MX | Auto Exports Year-over-Yea | - | - | 1.3 |
| Mon 7 | MX | Auto Production Year-over- | -2.2 | - | -1.4 |
| Wed 9 | MX | Inflation Rate Month-over- | 0.03 | - | 0.20 |
| Wed 9 | MX | Inflation Rate Year-over-Y | 3.1 | - | 3.3 |
| Wed 9 | MX | Core Inflation Rate Month- | 0.23 | - | 0.16 |
| Wed 9 | MX | Core Inflation Rate Year-o | 4.0 | - | 3.9 |
| Wed 9 | MX | Producer Price Index Month | -0.03 | - | 0.06 |
| Wed 9 | MX | Producer Price Index Year- | 2.6 | - | 3.0 |
| Wed 9 | MX | Foreign Exchange Reserves | 255.5bn | - | 258.5bn |
| Fri 11 | MX | Industrial Production Mont | 0.20 | - | 0.50 |
| Fri 11 | MX | Industrial Production Year | 1.7 | - | 2.7 |

The domestic calendar for the coming week contains no scheduled Mexican releases, shifting focus to external drivers that could affect imported inflation and peso flows. US CPI and any ECB signals will likely set the tone for global risk sentiment and commodity volatility, both of which feed directly into Banco de Mexico’s assessment of the inflation trajectory. Elevated Brent and WTI levels will remain relevant for energy-linked components in the next inflation prints. Market participants will also track any updates on USMCA trade flows and nearshoring indicators that continue to underpin Mexican manufacturing. The absence of domestic data leaves the upcoming decision path dependent on how external prints interact with the recent inflation outcome. The quiet week therefore extends the data-dependent equilibrium without introducing new domestic anchors.
The August inflation undershoot reduces near-term price pressure but coincides with a sharp commodity impulse that could reintroduce upside risks in coming quarters. Upside scenarios center on sustained energy prices sustaining imported inflation, while downside scenarios would require further labor-market softening or weaker activity prints to open additional policy space. The peso’s stability despite the IPC Bolsa decline suggests markets are not yet pricing aggressive depreciation, yet any reversal in Brent or WTI could quickly alter that balance. The configuration leaves the outlook balanced between contained domestic inflation and external commodity volatility, with the data-dependent stance at Banco de Mexico providing the primary buffer against mispricing on either side.
| Asset | Level | WoW |
|---|---|---|
| Bovespa | 187207.0 | -0.1% |
| USD/BRL | 5.13 | +0.0% |
| EUR/BRL | 5.95 | +0.1% |
| Vale | 15.23 | -2.1% |
| Petrobras | 21.2 | +1.8% |
| WTI Crude | 100.05 | +7.5% |
| Gold | 4408.9 | +0.3% |
| Bitcoin | 77319.7 | -3.8% |


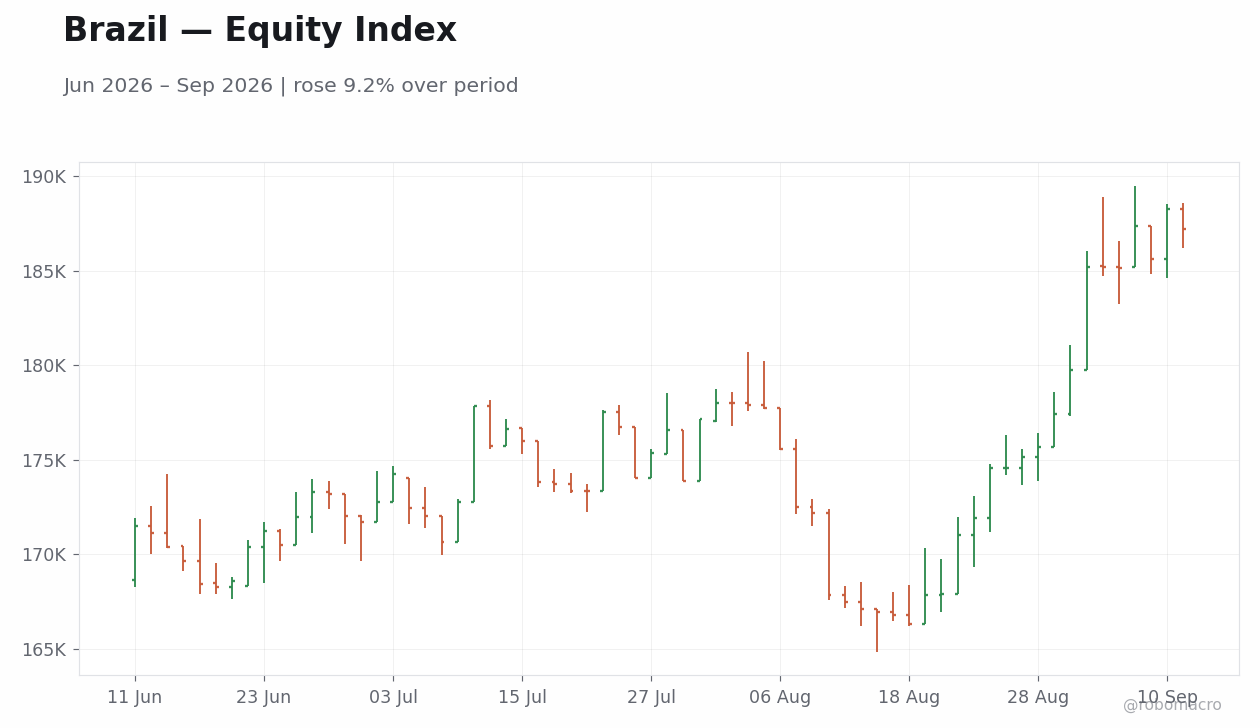
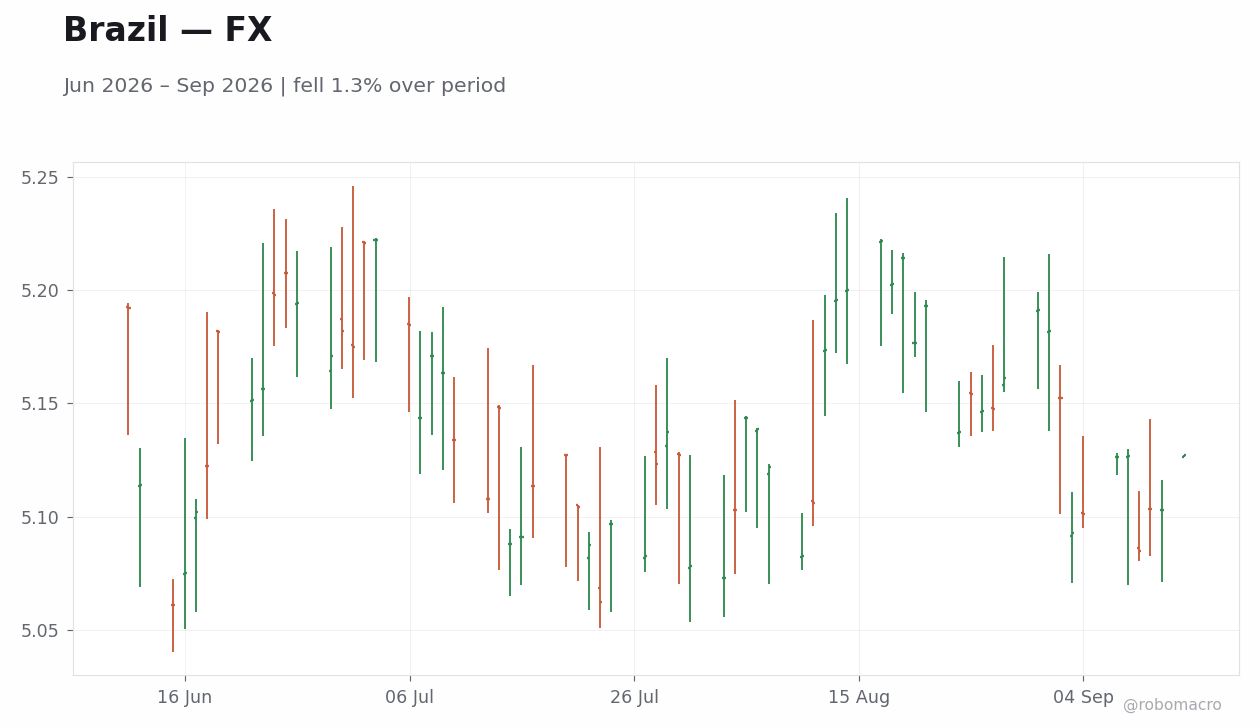
Commodity-driven equity and FX moves Bovespa rose mid-week before closing the week at 187207, down 0.09% week-over-week. USD/BRL traded in a tight range and finished at 5.13, up 0.02% week-over-week, while EUR/BRL ended at 5.95. Petrobras gained 1.78% to 21.2 while Vale declined 2.12% to 15.23 as WTI Crude climbed 7.55% to 100.05.
Policy rate stability persists The Brazil short-term rate eased during the week. Markets absorbed the commodity impulse without shifting near-term rate expectations.
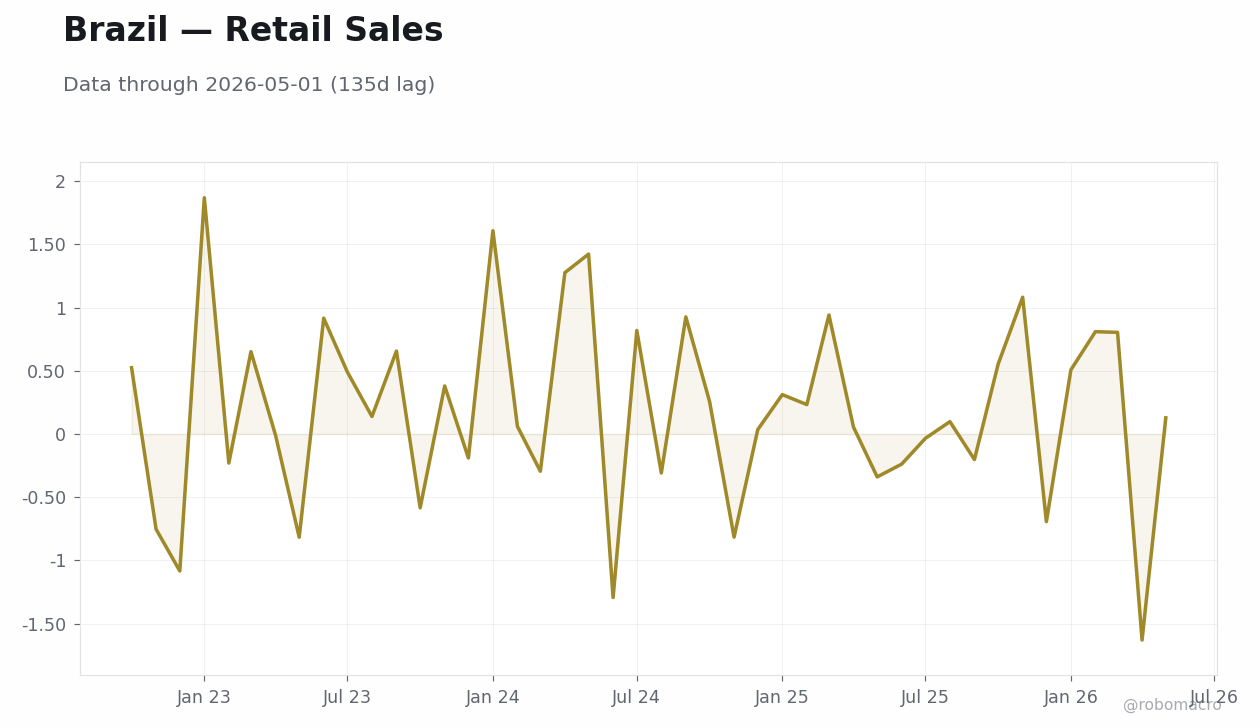
No Banco Central do Brasil speakers delivered remarks. The next inflation release will supply the first update since the prior meeting and will directly inform the data-dependent path ahead. Trade surplus strength and higher WTI Crude suggest contained imported price pressures, while earlier services sector data point to moderating domestic demand. Officials have maintained explicit data dependence without forward guidance shifts.
| Date | Ctry | Event | Prior | Cons. | Actual |
|---|---|---|---|---|---|
| Mon 7 | BR | BCB Focus Market Readout | - | - | - |
| Wed 9 | BR | Car Production Month-over- | 3.1 | - | - |
| Wed 9 | BR | New Car Registrations Mont | 2.6 | - | - |
| Fri 11 | BR | Inflation Rate Month-over- | 0.07 | - | -0.32 |
| Fri 11 | BR | Inflation Rate Year-over-Y | 4.4 | - | 4.2 |

Markets will monitor activity and inflation releases for signals on growth momentum and imported price pressures. These prints will inform the data-dependent policy path.
The week’s advance in WTI Crude risks re-accelerating imported inflation. Moderating domestic demand indicators raise downside growth risks that could accelerate the case for policy easing if confirmed by upcoming releases. The configuration leaves the outlook balanced between external price support and domestic demand trends.
| Asset | Level | WoW |
|---|---|---|
| MERVAL | 3098898.0 | +2.1% |
| USD/ARS | 1508.5 | -0.0% |
| EUR/ARS | 1749.31 | -0.2% |
| Gold | 4408.9 | +0.3% |
| Brent Crude | 104.61 | +6.8% |
| Soybean | 1299.0 | -0.3% |
| Bitcoin | 77321.25 | -3.8% |


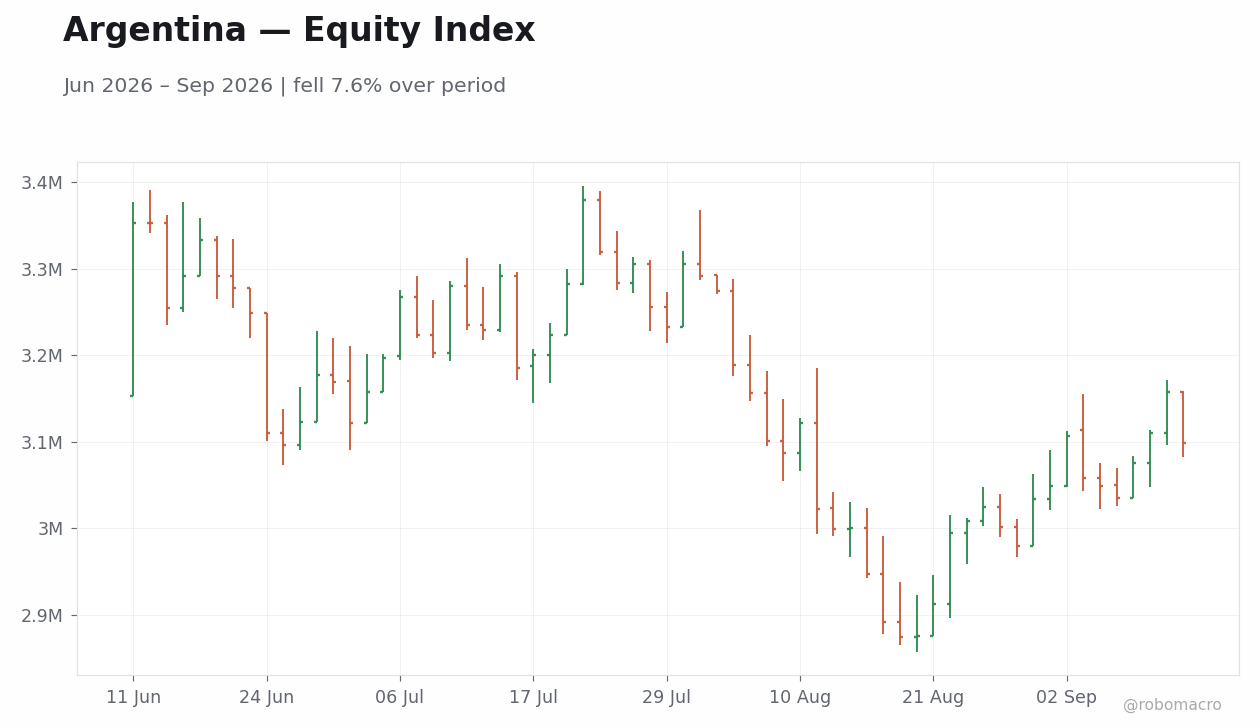
Commodity-driven equity resilience amid data vacuum. Argentine markets operated without any inflation, activity, or fiscal prints across the week. The MERVAL index posted a net advance after Brent crude delivered a clear external impulse that lifted sentiment toward energy-related fiscal inflows. Soybean prices reinforced expectations for agricultural export receipts that continue to anchor trade-balance and foreign-exchange supply.
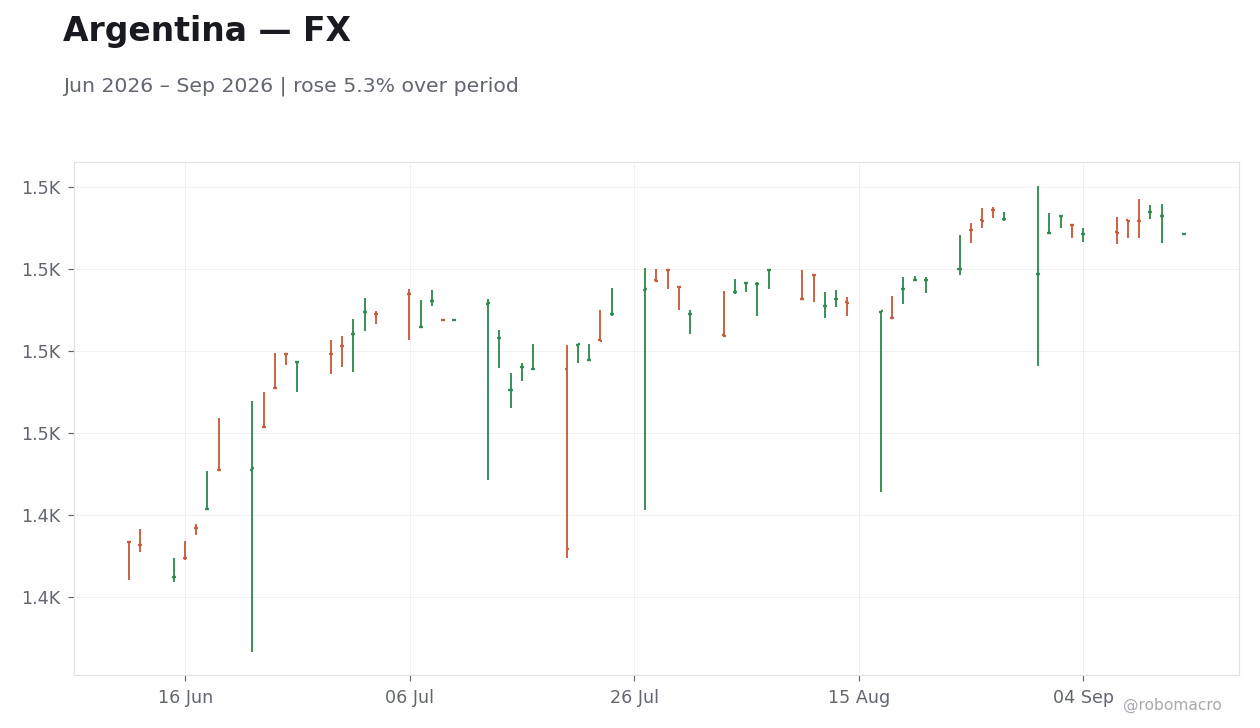
Peso stability and thin local flows. USD/ARS remained stable. EUR/ARS followed a similar pattern with a modest weekly decline. The absence of Central Bank of Argentina intervention signals kept the managed-float dynamics intact, while daily volume remained light as investors rotated selectively into commodity-exposed names.
Political rhetoric overlays fiscal narrative. President Milei renewed Argentina’s Falklands claim and directed authorities to pursue criminal cases against oil firms active in the disputed area. These statements occurred against a backdrop of ongoing primary-surplus targets under the IMF program, with no fresh data to alter expectations for expenditure control or reserve rebuilding. Youth debt pressures and real-wage lags were noted in market commentary but did not shift the week’s price action.
Global energy impulse dominates local pricing. The Brent advance aligned with broader commodity strength and offset the lack of domestic releases, leaving market participants focused on export-parity dynamics rather than policy recalibration. Gold and Bitcoin provided modest hedging flows without altering the core equity-currency configuration.
The Central Bank of Argentina released no statements, minutes, or policy adjustments during the week, consistent with the empty domestic calendar. Reserve accumulation therefore remained the operative variable linking fiscal execution to the policy rate path, with soybean and crude export proceeds continuing to supply the primary hard-currency inflows. The peso’s stability signaled that liquidity operations stayed on autopilot, preserving the managed-float framework without fresh guidance. Data absence reinforced the administration’s emphasis on primary surpluses as the prerequisite for any future easing discussion, while elevated Brent levels offered incidental support to fiscal buffers. Officials’ silence left the rate trajectory explicitly tethered to IMF review milestones and net foreign-asset trajectories rather than incoming prints.
| Date | Ctry | Event | Prior | Cons. | Actual |
|---|---|---|---|---|---|
| Tue 8 | AR | Industrial Production Year | 2.0 | - | -4.9 |
| Thu 10 | AR | Inflation Rate Month-over- | 2.1 | - | - |
| Thu 10 | AR | Inflation Rate Year-over-Y | 33.8 | - | - |
The September 14–18 calendar shows no scheduled releases for Argentina, extending the data vacuum into the following week. Attention will center on soybean export registrations and corn shipment volumes that directly influence BCRA reserve trajectories ahead of the next IMF program discussion. Brent crude above 100 dollars and any follow-through statements from the Milei administration on Falklands-related legal steps could shape near-term sentiment toward fiscal inflows. Market participants will track USD/ARS for signs of renewed liquidity operations should commodity momentum fade. Sustained primary-surplus delivery remains the key signal for the policy rate path, with reserve targets continuing to anchor expectations for upcoming decisions. External drivers such as global energy prices will likely dictate short-term trade-balance forecasts in the absence of domestic activity or inflation prints.
The week’s commodity rally reduced immediate downside pressure on the trade balance but left Argentina exposed to any reversal in Brent or soybean prices that could slow reserve accumulation. Political escalation over the Falklands introduces headline risk that could weigh on investor appetite even as fiscal consolidation continues to support credibility with multilateral lenders. The lack of data prints heightens uncertainty around the timing of any policy rate adjustment, with the Central Bank of Argentina remaining data-dependent by default. Upside scenarios hinge on sustained energy prices above 100 dollars supporting fiscal buffers, while downside risks center on renewed youth-debt strains or external demand weakness eroding export volumes. Markets appear to price a stable peso path, yet any slippage in primary-surplus execution could quickly reprice intervention odds ahead of the next IMF review.
| Asset | Level | WoW |
|---|---|---|
| MSCI Chile | 39.48 | -3.9% |
| MSCI Peru | 90.72 | -2.8% |
| USD/COP | 3079.23 | -1.6% |
| USD/CLP | 941.13 | +1.1% |
| USD/PEN | 3.35 | +2.0% |
| Copper | 6.55 | -2.8% |
| Gold | 4408.9 | +0.3% |
| Brent Crude | 104.61 | +6.8% |
| Bitcoin | 77305.69 | -3.8% |


Policy holds anchor the region. Chile’s central bank kept the policy rate unchanged, matching consensus and leaving the short-term rate steady from the prior meeting. Peru’s central bank faced an identical decision with markets expecting a hold. No high-impact releases occurred in Colombia during the week.
Commodity price swings dominate flows. Copper closed the week lower while Brent crude advanced. These moves supported fiscal revenue projections for Chile and Peru even as copper output contracted year-on-year.
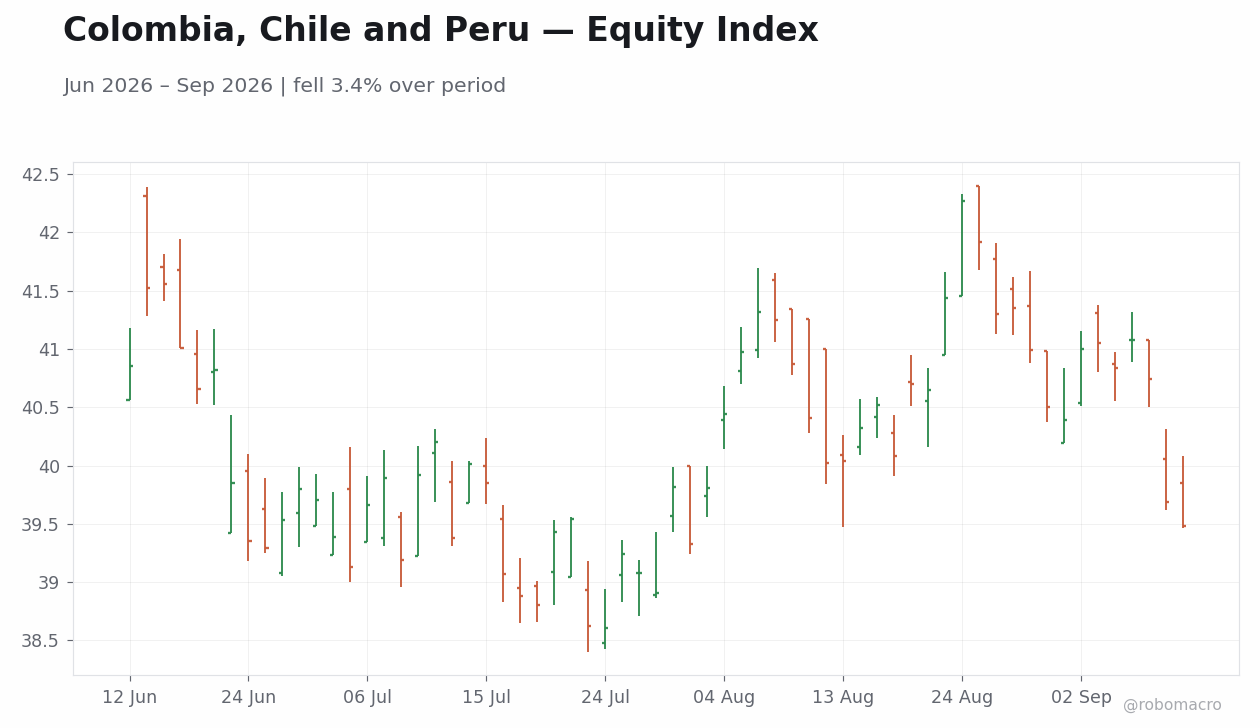
Equity indices close lower. MSCI Chile declined 3.89% week-over-week to 39.48 and MSCI Peru fell 2.77% to 90.72, while MSCI Colombia remained flat.
Currencies reflect commodity differentials. USD/COP eased 1.57% to 3,079.23, USD/CLP rose 1.14% to 941.13, and USD/PEN advanced 2.05% to 3.35. Gold ended at 4,408.90 after a 0.34% weekly gain.
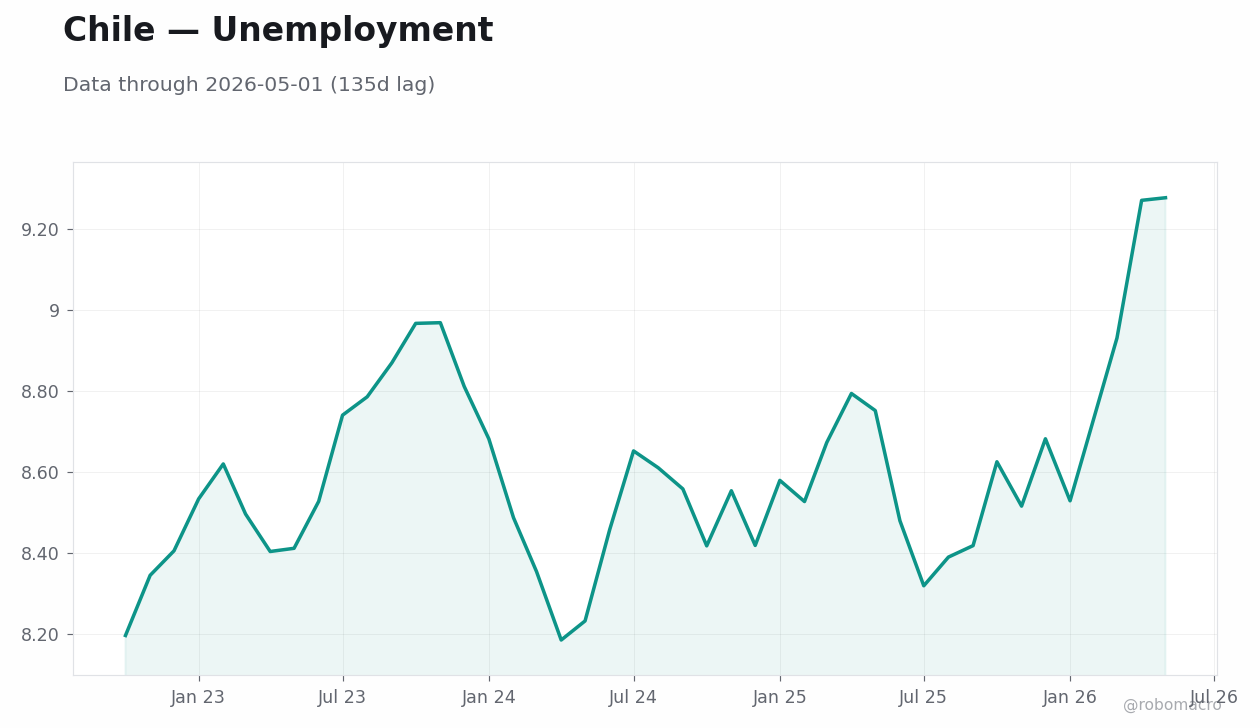
Activity backdrop remains soft. Chile’s mining contraction added to elevated unemployment and downward revisions to growth forecasts. Peru and Colombia recorded no offsetting domestic data prints that altered the external-demand narrative.
Fiscal balances receive mixed signals. Higher Brent and copper spot prices lifted prospective royalty and tax receipts, yet lower production volumes in Chile reduced near-term inflows. The configuration left current-account projections stable for the coming quarters.
BCCh held the policy rate unchanged, citing the absence of new inflation prints and a soft growth backdrop that included copper output down year-on-year. BCRP is scheduled to announce with consensus for no change, leaving forward guidance focused on inflation credibility and reserve management. BanRep maintained its tighter stance with no meeting this week. The data showed commodity strength offsetting domestic weakness, keeping all three banks on a data-dependent path without immediate recalibration. Officials’ communications emphasized monitoring external demand and copper prices rather than shifting parameters on single-week prints.
| Date | Ctry | Event | Prior | Cons. | Actual |
|---|---|---|---|---|---|
| Mon 7 | CL | Exports Level | 10.2bn | - | 9.5bn |
| Mon 7 | CL | Imports Level | 8.3bn | - | 7.8bn |
| Mon 7 | CL | Trade Balance | 2.0bn | - | 1.7bn |
| Mon 7 | CO | Inflation Rate Month-over- | 0.17 | - | 0.39 |
| Mon 7 | CO | Inflation Rate Year-over-Y | 6.0 | - | 6.2 |
| Tue 8 | CL | Core Inflation Rate Month- | 0.40 | - | 0.40 |
| Tue 8 | CL | Inflation Rate Month-over- | 0.10 | - | 0.60 |
| Tue 8 | CL | Inflation Rate Year-over-Y | 3.5 | - | 4.1 |
| Tue 8 | CL | Central Bank Interest Rate | 4.5 | - | 4.5 |
| Thu 10 | CO | Consumer Confidence Index | 20.7 | - | - |
| Thu 10 | PE | Central Bank Interest Rate | 4.2 | - | 4.2 |
| Thu 10 | PE | Trade Balance | 3.2bn | - | - |


No high-impact releases are scheduled across Colombia, Chile or Peru. Attention will center on any post-meeting statements from BCRP. Copper and Brent price movements will continue to shape fiscal and current-account projections for the next meeting cycle. BanRep speakers may address reserve management amid stable USD/COP levels. BCCh will likely reiterate its monitoring of labor-market and mining data ahead of upcoming decisions. The configuration leaves rate paths explicitly tied to incoming activity and commodity prints rather than preset easing paces.
Copper’s weekly decline after an earlier peak raises downside risks to Chile’s royalty revenues and CLP stability. Brent’s advance supports Colombia’s external accounts but increases imported inflation exposure for net-energy importers. The absence of fresh CPI or employment prints leaves policy expectations anchored to prior guidance, creating potential for surprises if activity data deteriorate further in coming quarters. Markets appear to underweight the persistence of soft domestic momentum against elevated commodity volatility, particularly for Peru’s current-account balance.
| Asset | Level | WoW |
|---|---|---|
| FTSE 100 | 10650.4 | -1.6% |
| FTSE 250 | 23975.7 | -2.2% |
| GBP/USD | 1.35 | +0.1% |
| GBP/EUR | 1.17 | +0.1% |
| GBP/JPY | 207.04 | -1.9% |
| Brent Crude | 104.61 | +6.8% |
| Gold | 4408.9 | +0.3% |
| UK Nat Gas | 2.83 | -2.9% |
| Bitcoin | 77305.69 | -3.8% |


Housing market cools further Housing indicators declined, extending the softening trend observed in prior weeks without triggering immediate policy recalibration.
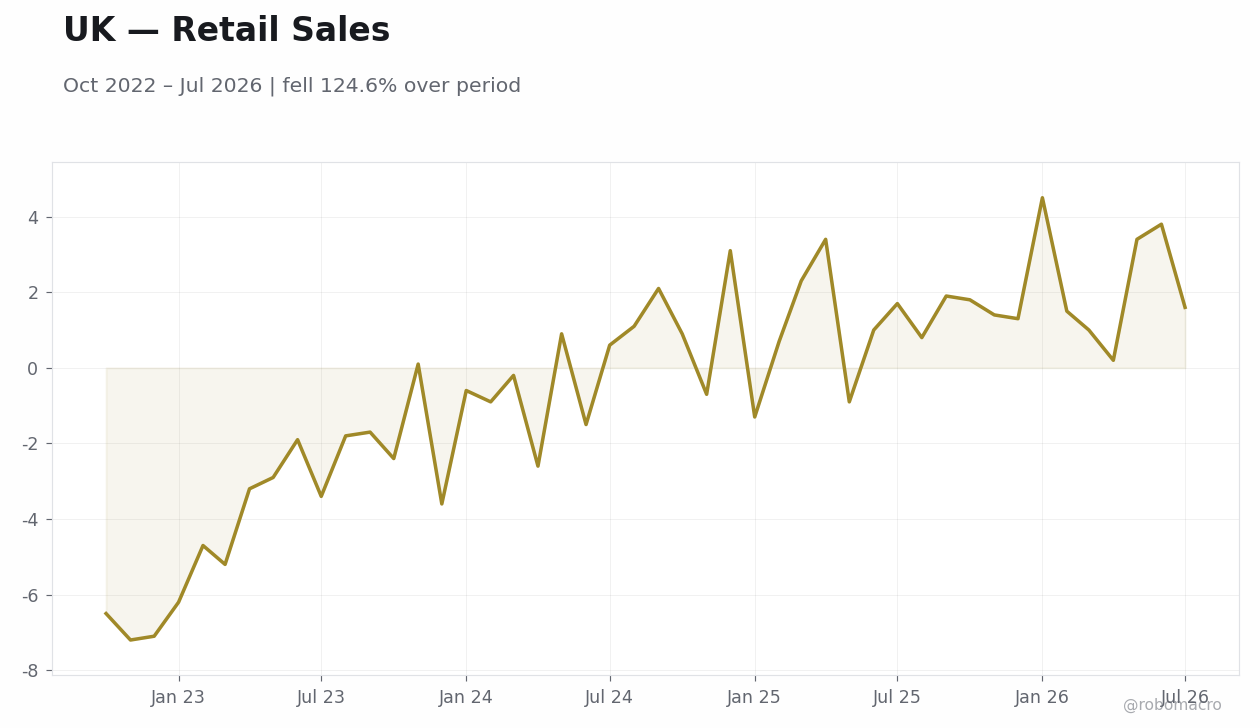
Consumer spending signals weaken Retail indicators printed below expectations, reinforcing downside risks to domestic demand through the middle of September.
Commodity impulse dominates Brent crude rose from prior levels to 104.61 over the week after supply cuts were confirmed. The 6.83% advance occurred alongside gold moving to 4408.9. Energy price pressure offset softer activity data and kept imported inflation risks in focus for the Bank of England.
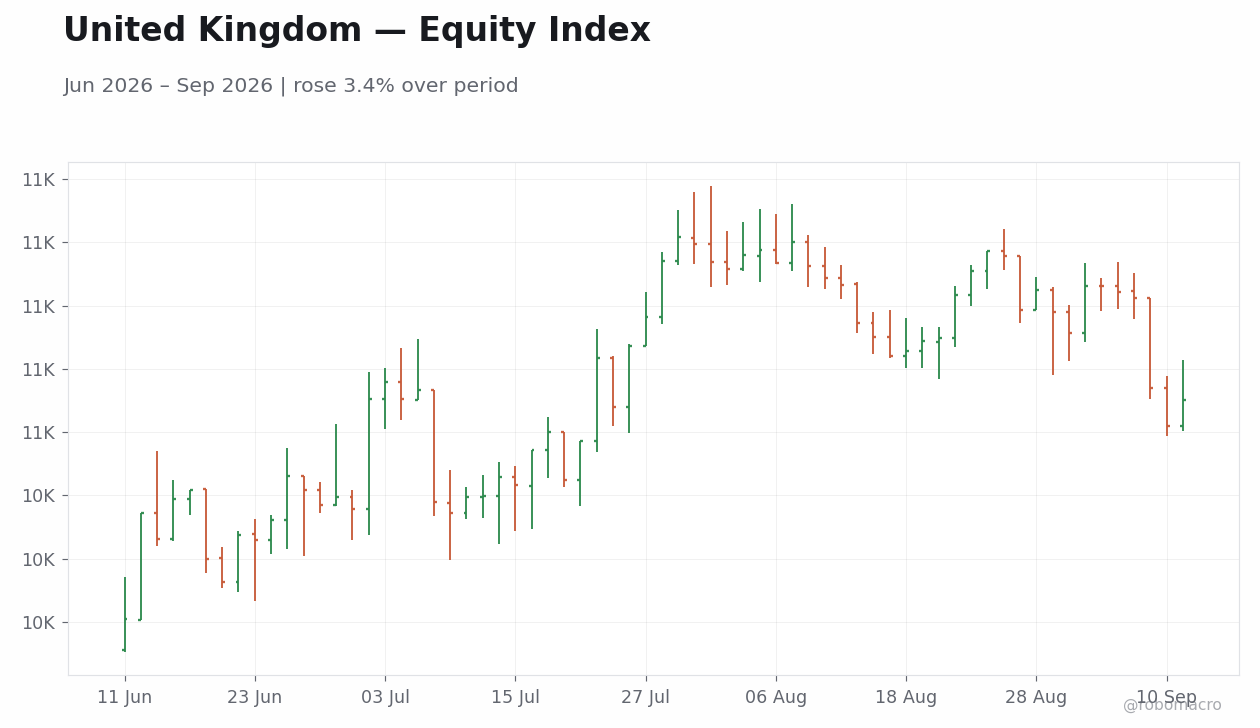
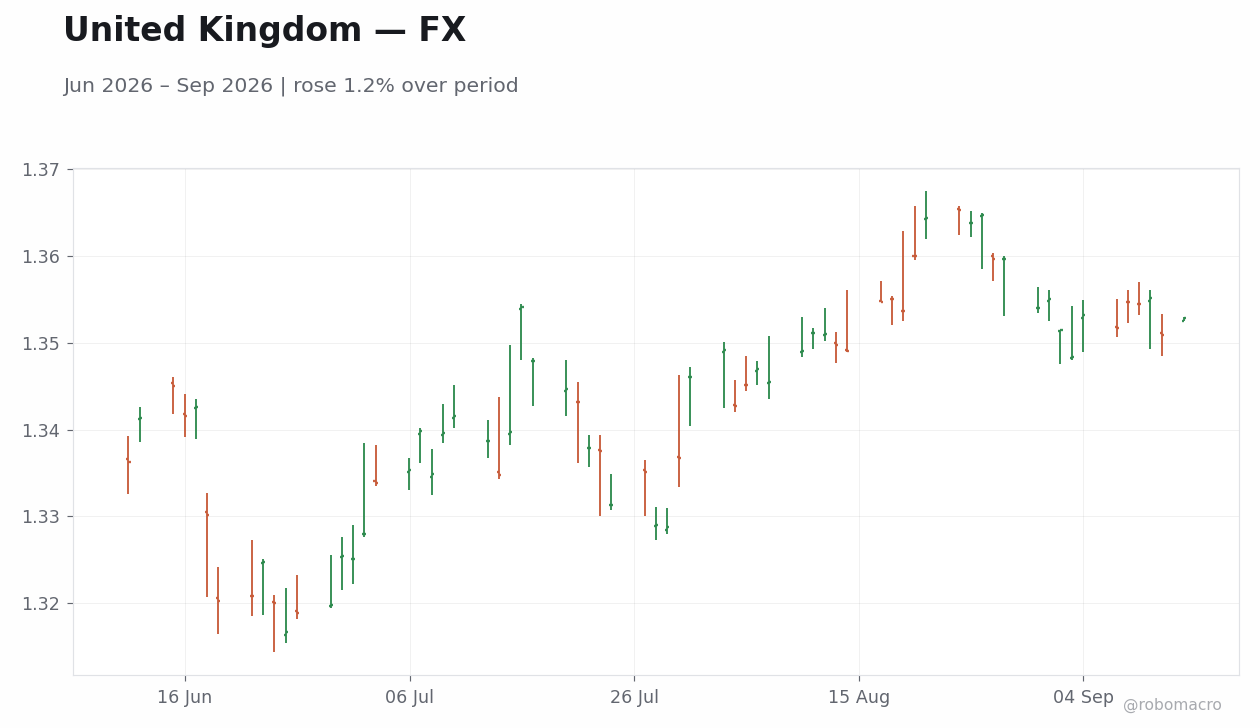
Equities and sterling absorb mixed flows FTSE 100 closed at 10650.4 on September 11 after declining 1.59% week-over-week. FTSE 250 fell 2.17% to 23975.7. GBP/USD ended at 1.35 with a net 0.09% gain while GBP/JPY declined 1.94% to 207.04. The 10-year gilt yield moved lower amid lower growth expectations.
No MPC members spoke during the week of September 7–11. The Bank Rate remains unchanged with the next decision scheduled for mid-September. Soft housing and retail prints reduce the urgency for near-term easing while the Brent advance to 104.61 raises imported inflation risks. Forward guidance stays explicitly data-dependent, consistent with the stance maintained through prior weeks. The configuration leaves the medium-term rate path anchored around the current level absent material deviations in upcoming inflation and labour data. Markets continue to price limited volatility around the next decision.
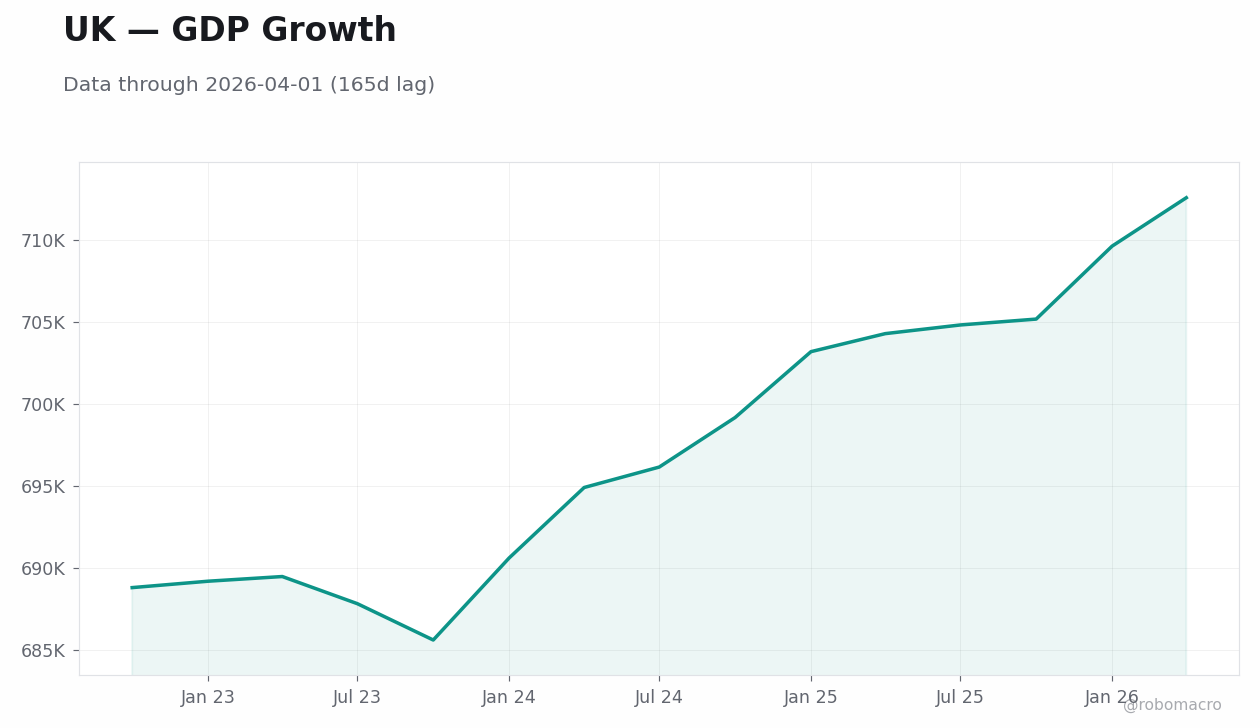
Housing and retail indicators came in below consensus, marking the clearest downside surprise of the week. These releases collectively point to cooling domestic demand in the current mid-cycle phase. The data reinforce that growth momentum has moderated without yet producing recessionary signals. The configuration leaves the Bank of England on a data-dependent path. No high-impact GDP or industrial production prints arrived during the week itself. The soft prints reduce near-term wage pressure signals and support the view that imported energy costs now represent the dominant inflation risk.
| Date | Ctry | Event | Prior | Cons. | Actual |
|---|---|---|---|---|---|
| Mon 7 | GB | Lloyds House Price Index M | 0 | - | -0.20 |
| Mon 7 | GB | Lloyds House Price Index Y | 0.10 | - | -0.40 |
| Mon 7 | GB | BBA Mortgage Rate | 6.6 | - | - |
| Mon 7 | GB | BRC Retail Sales Monitor Y | 1.0 | - | 0.50 |
| Wed 9 | GB | RICS House Price Balance | -30.0 | - | -28.0 |
| Thu 10 | GB | New Conventional Gilt 2030 | - | - | - |
| Fri 11 | GB | GDP Month-over-Month | 0.30 | - | 0.40 |
| Fri 11 | GB | GDP 3-Month Avg Level | 0.40 | - | 0.40 |
| Fri 11 | GB | Goods Trade Balance | -23.0bn | - | -21.0bn |
| Fri 11 | GB | Goods Trade Balance Non-Eu | -10.4bn | - | -9.7bn |
| Fri 11 | GB | Industrial Production Mont | -0.20 | - | 0.20 |
| Fri 11 | GB | Manufacturing Production M | -0.50 | - | 0.90 |
| Fri 11 | GB | Construction Output Year-o | -2.3 | - | -2.5 |
| Fri 11 | GB | GDP Year-over-Year | 1.1 | - | 1.6 |


Labour market and inflation releases are scheduled for the week of September 14–18. The Bank of England Interest Rate Decision arrives mid-week with the policy rate expected to hold. Retail sales follow later in the week. These releases will test whether the energy price impulse has begun to feed into headline inflation and wage dynamics. Any material upside surprise in CPI could reinforce the hold stance into October.
The week’s data shift the outlook toward greater tolerance for divergent prints without immediate policy adjustment. Upside risks centre on further Brent advances above 104.61 that could lift imported inflation and delay easing. Downside risks stem from continued retail and housing weakness that could pressure GDP prints scheduled for later in September. Market positioning shows limited duration extension in gilts after the 10-year yield moved lower. Volatility remains contained as participants await the next data cluster. Flow considerations favour energy-exposed sectors while rate-sensitive equities face headwinds from the commodity impulse.
FTSE 100 declined 1.59% to 10650.4 over the week while FTSE 250 fell 2.17% to 23975.7. The 10-year gilt yield moved lower as duration buying emerged after the retail and housing misses. GBP/USD finished at 1.35 with a modest 0.09% weekly gain while GBP/JPY dropped 1.94% to 207.04. Brent crude surged 6.83% to 104.61 after supply cuts, with intraday spikes reaching higher levels on September 10. Gold advanced 0.34% to 4408.9, providing a partial hedge against the energy-driven inflation impulse. Sterling showed resilience against the dollar despite the domestic data weakness, reflecting broader USD softening. Equity underperformance concentrated on September 9–10 when Brent’s advance weighed on rate-sensitive sectors.
Brent crude’s 6.83% advance to 104.61 over the past seven days mirrors the energy-driven price pressure observed across developed markets in prior weeks. The move occurred alongside gold reaching 4408.9 and reflects supply-side tightening rather than broad demand strength. Trade dynamics remain stable with no new tariff announcements affecting UK exports in the last seven days. Geopolitical risks tied to supply decisions now represent the primary cross-border spillover for UK inflation. The configuration sustains the mid-phase expansion without altering the data-dependent equilibrium shared by the Bank of England and peer central banks.
| Asset | Level | WoW |
|---|---|---|
| OMX Stockholm 30 | 3255.23 | -1.1% |
| Oslo Bors | 2110.54 | +0.6% |
| OMX Copenhagen 25 | 1865.05 | -2.3% |
| OMX Helsinki 25 | 6540.5 | +0.7% |
| USD/SEK | 9.69 | +1.2% |
| USD/NOK | 9.28 | -0.2% |
| EUR/SEK | 11.24 | +1.1% |
| EUR/NOK | 10.76 | -0.4% |
| Brent Crude | 104.61 | +6.8% |
| Gold | 4408.9 | +0.3% |
| Bitcoin | 77308.29 | -3.8% |


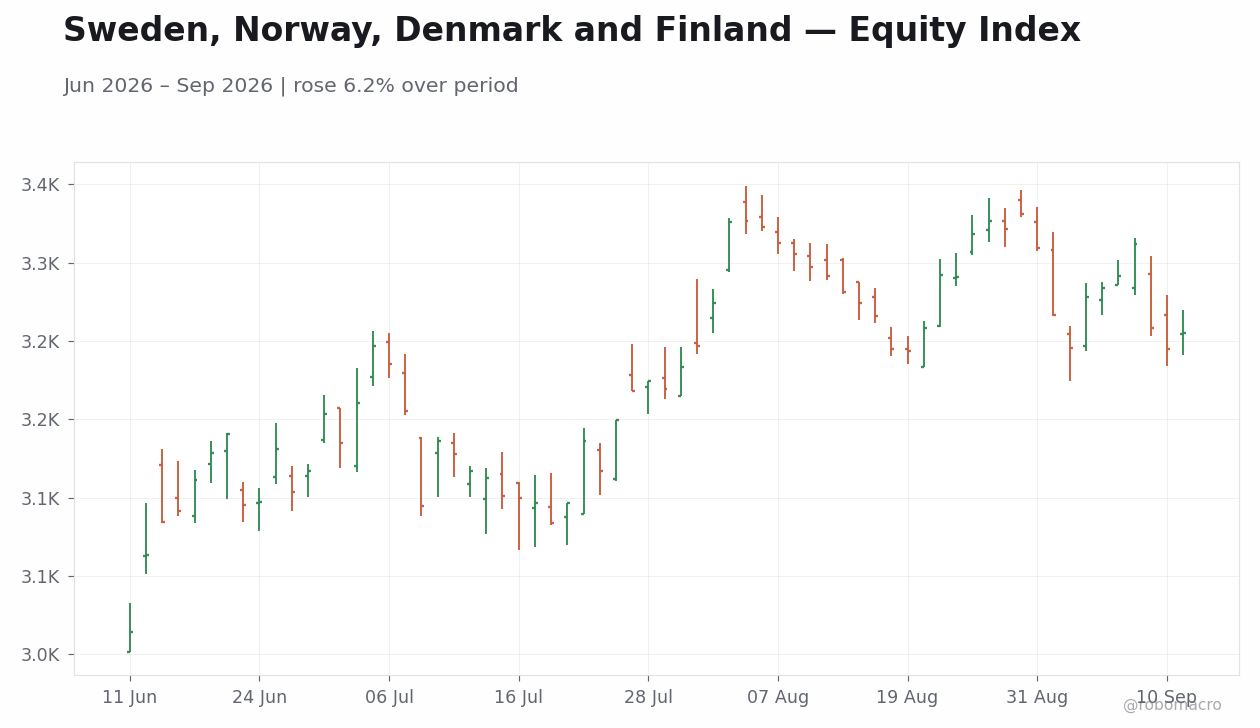
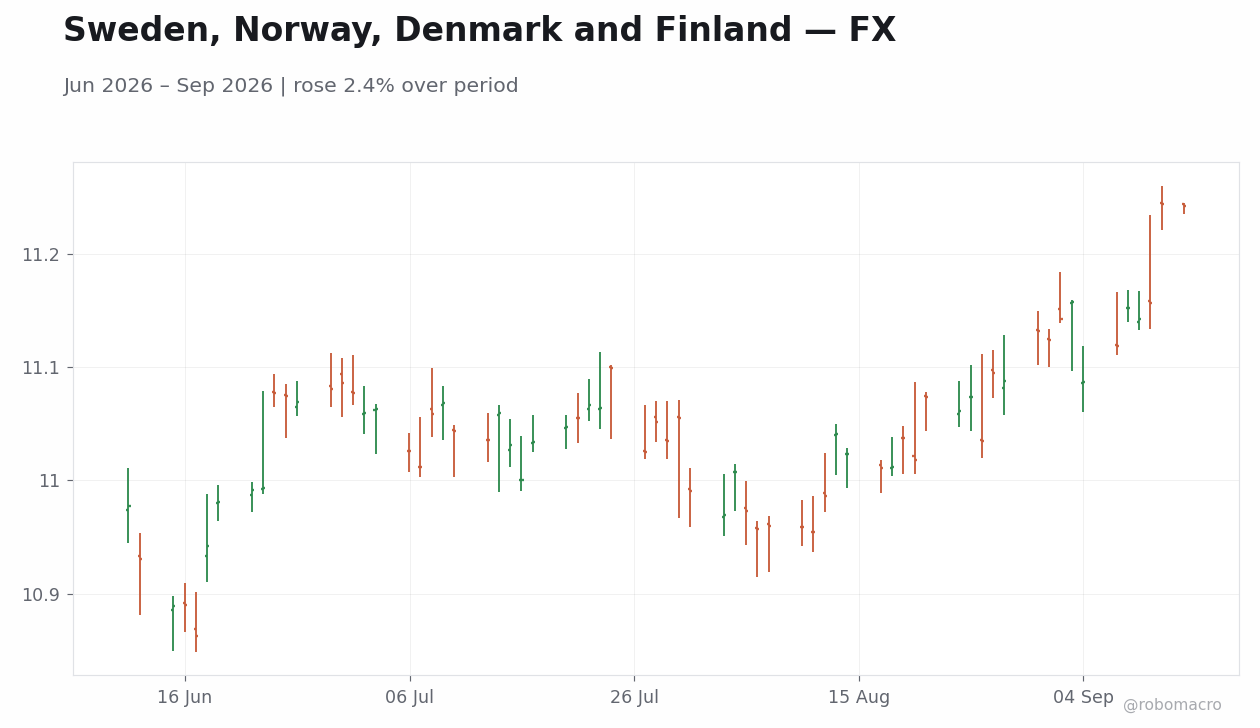
Thin calendar leaves focus on external drivers. No material domestic releases appeared across Sweden, Norway, Denmark or Finland. Equity markets posted modest net moves, with OMX Stockholm 30 closing the week at 3255.23 after a 1.11% decline while OMX Helsinki 25 rose 0.70% to 6540.50.
Oil price surge supports Norway. Brent crude climbed from 96.28 on September 7 to 104.61 by September 11, a 6.83% weekly gain that coincided with Oslo Bors advancing 0.59% to 2110.54. USD/NOK eased 0.23% to 9.28 over the same period, reflecting the terms-of-trade support for the krone. Norway 10-year government yields moved lower while Sweden 10-year yields rose.
Cross-Nordic equity divergence persists. OMX Copenhagen 25 declined 2.33% to 1865.05 and OMX Stockholm 30 posted the largest single-day drop of 1.62% on September 9, whereas Helsinki and Oslo indices recorded net gains. USD/SEK rose 1.24% to 9.69 and EUR/SEK increased 1.11% to 11.24, consistent with broader external drivers.
Activity data remain absent. No Manufacturing Production Month-over-Month, GDP Growth Quarter-over-Quarter, or Household Consumption Year-over-Year prints were released in Sweden, Norway, Denmark or Finland between September 7 and 11. The data-empty week left market focus on Brent’s advance.
Currency and bond moves stay contained. EUR/NOK declined 0.36% to 10.76 while USD/NOK posted a net 0.23% decline, showing limited volatility despite the oil move. Government bond operations proceeded on routine terms without altering yield curves beyond the observed moves in the Swedish 10-year.
Growth momentum references stay external. Swedish investment and consumption were cited in analyst commentary as supporting factors, yet no new quarterly GDP figures appeared. The configuration left the four economies in the same mid-phase expansion described in prior weeks, with imported energy prices now the dominant variable.
Riksbank officials issued no new statements or minutes during the week. Norges Bank likewise released no fresh guidance, though the 6.83% Brent advance to 104.61 reinforced the external balance backdrop for any future policy adjustments. Danmarks Nationalbank and Bank of Finland, operating under the ECB framework, saw no domestic data or speeches that altered the data-dependent stance already communicated in prior periods. The absence of meetings or forward-guidance updates kept all four central banks on a wait-and-see footing.
| Date | Ctry | Event | Prior | Cons. | Actual |
|---|---|---|---|---|---|
| Mon 7 | NO | Manufacturing Production M | -1.0 | - | 0.70 |
| Mon 7 | SE | CPIF Month-over-Month Prel | - | - | -0.30 |
| Mon 7 | SE | CPIF Year-over-Year Prelim | - | - | 0.70 |
| Mon 7 | SE | Inflation Rate Month-over- | - | - | -0.30 |
| Mon 7 | SE | Inflation Rate Year-over-Y | - | - | 0.30 |
| Tue 8 | DK | Manufacturing Production M | - | - | -5.5 |
| Tue 8 | DK | Trade Balance | 28.7bn | - | 40.5bn |
| Tue 8 | FI | Finnish Treasury Bill (RFT | - | - | - |
| Wed 9 | DK | Current Account Balance | 32.5bn | - | - |
| Wed 9 | FI | Trade Balance | 1.9bn | - | -740.0mn |
| Wed 9 | NO | Producer Price Index Year- | 23.4 | - | 30.1 |
| Thu 10 | FI | Industrial Production Year | 4.5 | - | 4.5 |
| Thu 10 | DK | Harmonised Inflation Rate | 1.6 | - | 2.0 |
| Thu 10 | DK | Inflation Rate Month-over- | 1.3 | - | -0.30 |

No high-impact releases are scheduled for Sweden, Norway, Denmark or Finland between September 14 and 18. The empty calendar means attention will remain on any follow-up commentary from Riksbank or Norges Bank officials. Brent crude price action near 104.61 will continue to influence Norway’s external accounts and krone valuation ahead of the next Norges Bank decision. Routine Riksbank certificate sales and liquidity operations are expected to carry limited market impact. Broader euro-area and US prints will set the tone for Nordic fixed-income and FX markets given the open-economy structure. The data-dependent frameworks at Riksbank, Norges Bank, Danmarks Nationalbank and Bank of Finland will absorb any external signals without immediate parameter shifts.
The 6.83% weekly rise in Brent to 104.61 introduces upside risk to imported inflation for energy-importing Nordic economies while supporting Norway’s fiscal position. Equity divergence, with OMX Stockholm 30 down 1.11% and Oslo Bors up 0.59%, highlights sector-specific exposure to commodity prices that could widen if energy remains elevated. Currency moves, including the 1.24% rise in USD/SEK to 9.69, remain modest and could reverse if external risk sentiment shifts. The continued absence of activity data keeps the growth outlook tethered to prior-quarter trends rather than fresh confirmation.
| Asset | Level | WoW |
|---|---|---|
| BIST 100 | 14467.3 | +2.2% |
| iShares Poland | 45.56 | -0.4% |
| EUR/PLN | 4.32 | +0.2% |
| EUR/HUF | 363.13 | +0.5% |
| EUR/CZK | 24.22 | +0.2% |
| USD/TRY | 48.16 | -0.5% |
| Brent Crude | 104.61 | +6.8% |
| Gold | 4408.9 | +0.3% |
| Bitcoin | 77309.15 | -3.8% |


Equity markets post selective gains amid energy price strength. Regional equities advanced on the week with the BIST 100 closing higher after a net rise while the iShares Poland ETF ended lower. Poland’s official reserves provided a buffer that supported zloty stability against the euro. Hungary’s forint showed mixed moves with EUR/HUF closing higher after a weekly increase.
Central bank decisions anchor policy expectations. Romania’s second-estimate GDP growth came in at -0.4 percent year-over-year for the latest quarter, matching consensus and confirming subdued momentum. No high-impact releases emerged from the Czech Republic or Hungary during the period.
Yields tighten on commodity and risk-on flows. Brent crude’s advance lifted sentiment in energy-linked assets and contributed to compression in sovereign yields. Cross-border defence contracts between Turkish and Polish firms added to bilateral flows without immediate macro impact.
No decisions or minutes were released by the NBP, CNB, MNB, BNR or CBRT during the week. Romania’s year-over-year GDP print aligned with the BNR’s current assessment of subdued growth. Hungary’s forint strength on MNB pause speculation kept market focus on the next MNB meeting without any official communication. The configuration leaves all five central banks on an unchanged medium-term rate path pending further inflation and activity data.
Romania’s second-estimate GDP growth printed at -0.4 percent year-over-year, exactly in line with consensus and confirming the prior contractionary trend. The quarter-over-quarter reading revised to 0.0 percent from -0.1 percent, offering limited relief on the domestic-demand side. No comparable high-impact prints occurred in Poland, Czech Republic, Hungary or Turkey, leaving the data flow limited. The absence of surprises in the releases leaves the growth outlook anchored in the mid-cycle phase where imported energy costs compete with soft domestic activity. These prints collectively point to unchanged rate paths for the NBP, CNB, MNB, BNR and CBRT in the near term, with forward guidance remaining explicitly tied to incoming inflation and activity data.
| Date | Ctry | Event | Prior | Cons. | Actual |
|---|---|---|---|---|---|
| Mon 7 | RO | GDP Growth Quarter-over-Qu | -0.10 | - | 0 |
| Mon 7 | RO | GDP Growth Year-over-Year | -1.2 | -0.40 | -0.40 |
| Mon 7 | HU | Industrial Production Year | 10.1 | - | 4.7 |
| Mon 7 | CZ | Construction Output Year-o | 2.0 | - | 1.8 |
| Mon 7 | CZ | Industrial Production Mont | 1.2 | - | -1.1 |
| Mon 7 | CZ | Industrial Production Year | 4.0 | - | 3.1 |
| Mon 7 | CZ | Trade Balance | 15.5bn | - | -8.5bn |
| Tue 8 | HU | Core Inflation Rate Year-o | 1.9 | - | 2.0 |
| Tue 8 | HU | Inflation Rate Month-over- | -0.10 | - | 0.20 |
| Tue 8 | HU | Inflation Rate Year-over-Y | 1.2 | - | 1.3 |
| Tue 8 | CZ | Foreign Exchange Reserves | 181.0bn | - | 184.6bn |
| Tue 8 | CZ | Unemployment Rate | 5.0 | - | 5.0 |
| Tue 8 | HU | 3-Month Hungarian Discount | - | - | 5.2 |
| Tue 8 | HU | Budget Balance | - | - | -2311.0bn |

The calendar for September 14-18 shows no scheduled high-impact releases across Poland, Czech Republic, Hungary, Romania or Turkey. Markets will therefore focus on any unscheduled central-bank speaker comments from the NBP, CNB, MNB, BNR or CBRT. External euro-area inflation prints and ECB communications remain the dominant drivers for regional rate expectations. Energy price stability will stay in focus given shared import dependencies and Brent’s recent move higher. Investors will monitor any follow-through from the MSPO defence expo on bilateral trade flows. Positioning is expected to remain light ahead of the data-empty window.
The week’s limited data flow leaves the outlook exposed to external commodity shocks, with Brent’s rise already lifting imported inflation risks. Upside inflation surprises could prompt earlier hawkish signals from the NBP or CBRT than currently priced. Downside growth risks remain elevated given Romania’s GDP print. Market mispricing appears limited. Volatility in regional FX stayed contained with EUR/PLN moving only modestly on the week. Positioning data suggest light exposure ahead of the empty calendar, reducing near-term flow-driven swings.
Equities recorded a net positive week with the BIST 100 rising while the iShares Poland ETF declined. Bonds tightened on the back of Brent’s advance. FX markets showed contained moves with EUR/PLN rising, EUR/HUF advancing, EUR/CZK increasing and USD/TRY declining. Commodities dominated price action as Brent crude climbed while gold added and Bitcoin fell.
Brent crude’s advance over the past seven days reasserts energy-price dominance across net importers in the region. US activity signals continued to point to cooling momentum without shifting any major central bank from its data-dependent posture. Eurozone inflation prints remained contained, allowing the ECB to maintain its deposit-rate path. The configuration sustains the mid-cycle expansion where imported inflation risks from energy compete with selective labour-market softening. Geopolitical spillovers from defence expo activity between Turkey and Poland added minor bilateral flow without altering broader trade dynamics.
| Asset | Level | WoW |
|---|---|---|
| JSE Top 40 | 107759.5 | -1.7% |
| USD/ZAR | 16.16 | +1.2% |
| EUR/ZAR | 18.74 | +1.1% |
| Platinum | 1797.6 | -2.7% |
| Gold | 4408.9 | +0.3% |
| Brent Crude | 104.61 | +6.8% |
| Naspers | 72528.0 | -2.3% |
| Bitcoin | 77310.39 | -3.8% |


Light domestic data flow left markets focused on external drivers. No high-impact South African releases appeared during the week. Equity and currency moves tracked global commodity prices and external flows instead. The JSE Top 40 fell 1.69 percent to 107,759.50. USD/ZAR rose 1.24 percent to 16.16 and EUR/ZAR advanced 1.11 percent to 18.74. Brent crude climbed 6.83 percent to 104.61, adding imported inflation pressure. Platinum declined 2.74 percent to 1,797.60 while gold rose 0.34 percent to 4,408.90. Naspers fell 2.33 percent to 72,528.00.
Rand showed resilience against commodity-driven inflation signals. Short-term rates held steady and the yield curve remained modestly flatter. External commodity strength offset any relief from subdued domestic demand indicators, leaving imported price risks intact.
The South African Reserve Bank released no official communications during the week. Officials continue to emphasize incoming activity and price prints rather than shifting guidance on the basis of external moves alone. Imported inflation risks from Brent crude’s advance to 104.61 keep vigilance intact while softer domestic demand reduces near-term pressure to adjust the policy rate. The forward path remains tethered to subsequent quarters’ data on demand and external prices.
| Date | Ctry | Event | Prior | Cons. | Actual |
|---|---|---|---|---|---|
| Mon 7 | ZA | Foreign Exchange Reserves | 73.5bn | - | 76.0bn |
| Mon 7 | ZA | 182-Day Treasury Bill Auct | - | - | - |
| Mon 7 | ZA | 273-Day Treasury Bill Auct | - | - | - |
| Mon 7 | ZA | 364-Day Treasury Bill Auct | - | - | - |
| Mon 7 | ZA | 91-Day Treasury Bill Aucti | - | - | - |
| Tue 8 | ZA | GDP Growth Quarter-over-Qu | 0.50 | - | -0.20 |
| Tue 8 | ZA | GDP Growth Year-over-Year | 1.9 | - | 0.90 |
| Tue 8 | ZA | Weekly Bond Auction | - | - | - |
| Thu 10 | ZA | Current Account Balance | 190.7bn | - | -205.5bn |
| Thu 10 | ZA | Gold Production Year-over- | 6.2 | - | -7.4 |
| Thu 10 | ZA | Mining Production Month-ov | 0.30 | - | -1.9 |
| Thu 10 | ZA | Mining Production Year-ove | -4.0 | - | -7.5 |
| Thu 10 | ZA | Manufacturing Production M | 0.90 | - | 2.2 |
| Thu 10 | ZA | Manufacturing Production Y | -1.7 | - | 1.1 |


No South African data releases are scheduled for September 14–18. Attention shifts to global commodity prints and major-economy activity figures that feed into imported inflation assessments. Traders will monitor follow-through from Brent crude’s recent advance to 104.61 and any pass-through to domestic prices. The data-dependent framework keeps focus on how external releases shape expectations for growth and inflation trajectories ahead of the next policy decision. External risk-off moves could affect rand volatility and bond yields without domestic catalysts.
Subdued domestic demand indicators shift the growth outlook toward a more protracted slowdown, raising downside scenarios for fiscal revenue. Upside risks center on sustained Brent crude strength that could re-anchor inflation vigilance. Non-macro events add tail risks that could indirectly pressure investor sentiment and rand flows. Markets appear to price limited volatility in USD/ZAR despite the external commodity backdrop.
| Asset | Level | WoW |
|---|---|---|
| ASX 200 | 8741.2 | -3.0% |
| NZX 50 | 13580.33 | -2.6% |
| AUD/USD | 0.72 | -0.6% |
| NZD/USD | 0.58 | -1.1% |
| AUD/NZD | 1.23 | +0.4% |
| BHP | 60.87 | -3.3% |
| Gold | 4408.9 | +0.3% |
| Brent Crude | 104.61 | +6.8% |
| Bitcoin | 77310.38 | -3.8% |


Consumer Sentiment Deterioration Australian data releases showed clear weakening in domestic demand indicators. Westpac Consumer Confidence Index dropped while NAB Business Confidence Index also slipped. These prints occurred alongside RBA communications that inflation still required attention.
Equity and Currency Divergence Equity markets reflected the softening readings as ASX 200 closed the week lower after a decline, while NZX 50 finished lower for the week. AUD/USD held steady despite daily pressure, supported by commodity flows.
Commodity Impulse and External Support Brent crude rose, with BHP moving lower over the period and illustrating mixed commodity equity performance. Gold advanced modestly.
Policy Communication Overlay RBA speeches reinforced that growth and inflation remain elevated, with officials noting prior rate adjustments cooling housing without triggering recession. RBNZ remarks focused on repo-market reforms while leaving the OCR unchanged. Short-term rates eased. The through-line was domestic sentiment weakness failing to shift central bank vigilance, with external energy prices providing partial offset to AUD.
RBA officials used multiple speeches to highlight that inflation and ongoing price pressures necessitate continued policy caution at the prevailing cash rate. Officials explicitly stated inflation and growth remain too high, while downplaying migration as a primary driver and noting housing-market cooling from prior adjustments. RBNZ maintained its OCR with remarks addressing operational reforms rather than forward guidance. The data on consumer and business confidence showed no immediate shift in either bank's data-dependent stance, leaving the path for upcoming decisions tied to incoming inflation and activity prints. Officials across both banks absorbed the Brent advance without altering parameters, extending the pattern of tolerance for divergent domestic signals.
| Date | Ctry | Event | Prior | Cons. | Actual |
|---|---|---|---|---|---|
| Mon 7 | NZ | Manufacturing Sales Year-o | 2.8 | - | 6.4 |
| Mon 7 | AU | Building Permits Month-ove | 7.2 | - | - |
| Mon 7 | AU | Building Permits Year-over | 8.9 | - | - |
| Mon 7 | AU | Private House Approvals Mo | 0.40 | - | - |
| Mon 7 | NZ | 1-Year Treasury Bill Aucti | - | - | - |
| Mon 7 | NZ | 3-Month Treasury Bill Auct | - | - | - |
| Mon 7 | NZ | 6-Month Treasury Bill Auct | - | - | - |
| Tue 8 | AU | Westpac Consumer Confidenc | 6.0 | - | -5.2 |
| Tue 8 | AU | Westpac Consumer Confidenc | 88.9 | - | 84.4 |
| Tue 8 | AU | NAB Business Confidence In | -6.0 | - | -8.0 |
| Thu 10 | NZ | Business NZ PMI Index | 54.3 | - | 53.1 |
| Thu 10 | AU | Consumer Inflation Expecta | 4.9 | - | 4.9 |
| Sun 13 | NZ | Composite NZ PCI Level | 52.6 | - | - |
| Sun 13 | NZ | Services NZ PSI Level | 50.6 | - | - |


Attention turns to an RBA speech that may provide further signals on the cash rate path ahead of the next meeting. New Zealand releases begin with Current Account Balance, followed by GDP growth quarter-over-quarter and year-over-year prints that will inform RBNZ assessment of recovery momentum. Trade Balance follows. The releases matter for rate path calibration because they directly test whether domestic demand softening observed this week is broadening into activity data that could influence upcoming decisions. No Australian data prints are scheduled, leaving external commodity and US data flows as key variables for RBA considerations through the balance of the period.
The week's confidence deterioration raises downside risks to Australian growth if housing cooling from prior RBA adjustments intensifies, potentially challenging the base case of no recession. Brent strength introduces upside inflation risks that could extend the higher-for-longer stance at both central banks if energy prices remain elevated. NZ GDP and current account prints next week carry scope to either confirm or challenge the cautious RBNZ outlook on consumer recovery. Markets appear to underweight the persistence of inflation in RBA communications relative to the domestic demand weakness, creating potential for repricing if upcoming activity data disappoint. The configuration leaves both economies exposed to commodity volatility that could shift the balance between imported inflation and selective labor-market softening observed in prior weeks.
| Asset | Level | WoW |
|---|---|---|
| Shanghai Composite | 3888.11 | -1.1% |
| Hang Seng | 24805.63 | -2.4% |
| TAIEX | 46184.85 | -2.4% |
| USD/CNY | 6.71 | -0.1% |
| USD/HKD | 7.84 | +0.0% |
| Copper | 6.55 | -2.8% |
| Brent Crude | 104.61 | +6.8% |
| Gold | 4408.9 | +0.3% |
| Bitcoin | 77310.39 | -3.8% |

Trade data confirmed external resilience. China exports grew at a faster pace than the prior month while imports rose more slowly, lifting the trade surplus above the prior level. The export performance was driven by overseas demand for high-tech products, while the import outcome pointed to softer domestic momentum. Mainland equities advanced modestly on the export print before reversing later in the week.
Inflation outcomes aligned with subdued cycle signals. August CPI rose from the prior month while PPI advanced modestly. These releases left the PBoC with continued room for accommodative settings without immediate pressure to adjust the policy rate.
Equity markets diverged regionally amid commodity volatility. Shanghai Composite closed the week lower, while Hang Seng and TAIEX also declined. Copper eased on softer demand signals even as Brent advanced.
Policy and cross-border initiatives provided steady support. The PBoC purchased gold during the week, and Hong Kong Chief Executive John Lee outlined the city’s five-year plan emphasizing expanded offshore yuan usage. USD/CNY eased over the week, reflecting reduced immediate easing expectations.
Overall narrative centered on external strength offsetting domestic softness. The configuration sustained the mid-phase expansion without altering central bank parameters, consistent with the data-dependent equilibrium observed in prior weeks.
The PBoC added to gold reserves during the week despite elevated prices, signaling continued reserve diversification without any adjustment to the policy rate. HKMA maintained the USD/HKD peg with no interventions reported, while CBC kept policy settings unchanged ahead of scheduled data. No PBoC open-market operations, MLF or reverse-repo actions occurred, leaving liquidity conditions steady. Hong Kong’s five-year plan outlined by Chief Executive John Lee prioritized wider offshore yuan usage and deeper cross-border investment links. The August inflation prints left the medium-term rate path explicitly data-dependent, with no forward guidance shifts from any of the three central banks. These developments reinforced tolerance for divergent prints without immediate recalibration, consistent with the pattern across DM and EM policymakers in recent weeks.
China trade balance widened after exports grew faster than the prior month while imports rose more slowly than expected. The export performance was driven by overseas demand for high-tech and AI-related products, while the import outcome pointed to weaker domestic consumption momentum. CPI rose from the prior month and exceeded the consensus estimate on a monthly basis. PPI advanced modestly, indicating stable producer price pressures without signaling overheating. These outcomes reinforced that the economy remains in a mid-cycle phase where external demand supports growth while domestic activity stays subdued. The inflation prints reduced near-term expectations for PBoC policy rate easing yet left ample room for continued accommodation. Fixed asset investment and retail sales data scheduled for next week will clarify whether the consumption weakness evident in imports persists. Overall the releases confirmed selective resilience in exports without altering the broader growth outlook or imported inflation risks from energy prices.
| Date | Ctry | Event | Prior | Cons. | Actual |
|---|---|---|---|---|---|
| Mon 7 | CN | Foreign Exchange Reserves | 3419.0bn | - | 3438.0bn |
| Mon 7 | CN | Exports Year-over-Year | 23.9 | - | - |
| Mon 7 | CN | Imports Year-over-Year | 27.5 | - | - |
| Mon 7 | CN | Trade Balance | 112.5bn | - | - |
| Mon 7 | CN | Balance of Trade Yuan | - | - | - |
| Tue 8 | TW | Inflation Rate Month-over- | 0.18 | - | 0.13 |
| Tue 8 | TW | Inflation Rate Year-over-Y | 2.5 | - | 2.0 |
| Tue 8 | CN | Inflation Rate Year-over-Y | 0.50 | - | - |
| Tue 8 | CN | Inflation Rate Month-over- | -0.10 | - | - |
| Tue 8 | CN | Producer Price Index Year- | 3.5 | - | - |
| Wed 9 | TW | Exports Year-over-Year | 32.9 | - | 41.0 |
| Wed 9 | TW | Imports Year-over-Year | 37.4 | - | 44.3 |
| Wed 9 | TW | Trade Balance | 17.2bn | - | 22.3bn |
| Fri 11 | CN | Vehicle Sales Year-over-Ye | -0.30 | - | - |
Attention centers on China’s scheduled releases including House Price Index, Industrial Production, Retail Sales and Fixed Asset Investment. These prints will clarify momentum in property and consumption after the steady inflation outcome. No PBoC liquidity operations or rate signals are scheduled. HKMA is expected to maintain the USD/HKD peg through routine operations while CBC calendars remain quiet. Markets will monitor any follow-through from the August trade and inflation data into risk assets ahead of the releases. The 26th China International Fair for Investment and Trade concludes with limited central bank speaker activity expected next week.
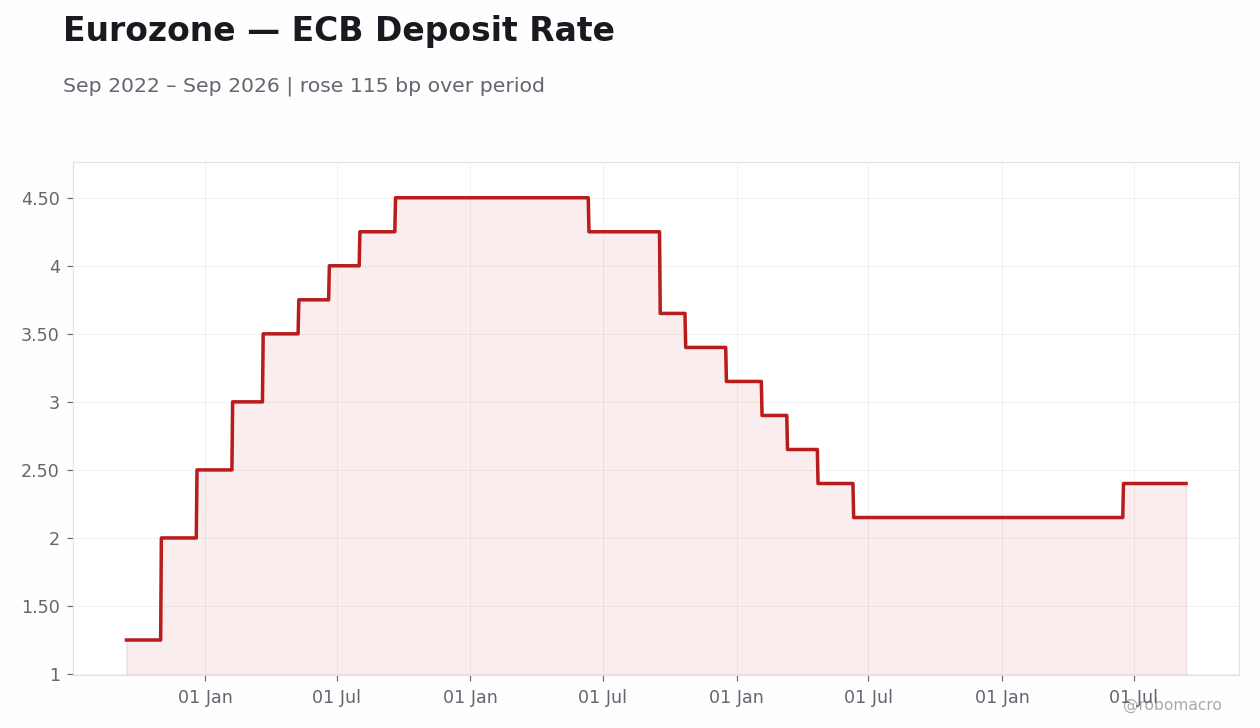
The August trade beat reduced downside risks to growth but left domestic consumption signals mixed, shifting positioning toward selective export-exposed sectors. Brent’s advance raises imported inflation risks that could pressure the PBoC’s accommodative stance if sustained. Equity outflows from Hong Kong and Taiwan signal potential further volatility if next week’s industrial production and retail sales miss consensus. Upside scenario centers on stronger-than-expected IP and retail prints supporting a modest re-rating of mainland equities, while downside hinges on continued property weakness. Market mispricing appears limited given the consensus alignment on recent data, though copper’s decline suggests positioning for softer industrial demand. Flow considerations favor mainland indices over Hong Kong amid the five-year yuan internationalization push.
Equities closed lower across Greater China with Shanghai Composite declining, Hang Seng falling and TAIEX dropping. Daily moves included modest Shanghai Composite gains early in the week before larger declines later. FX showed USD/CNY easing while USD/HKD rose modestly, reflecting modest yuan support from the trade surplus. Commodities diverged sharply as Brent crude advanced on geopolitical supply risks and gold rose, while copper fell amid softer China demand signals. Bitcoin declined over the week. The moves occurred against a backdrop of no major bond yield changes reported for China 2Y or 10Y government debt.
Brent crude’s advance reflected geopolitical supply risks that fed through to global inflation pressures over the past seven days. US activity signals from prior weeks showed cooling momentum, leaving the Federal Reserve on a data-dependent path without immediate recalibration. Energy price strength supported commodity-exposed sectors globally while pressuring net importers including China. Cross-border spillovers from the US-China trade discussions highlighted in the export surge remain contained, with no new tariff announcements in the last seven days. The configuration sustains the mid-phase global expansion amid divergent real-economy signals.
| Asset | Level | WoW |
|---|---|---|
| KOSPI | 6909.91 | -1.2% |
| KOSDAQ | 820.64 | -0.2% |
| USD/KRW | 1344.48 | -0.0% |
| Samsung | 259500.0 | -3.9% |
| SK Hynix | 1812000.0 | +1.6% |
| Brent Crude | 104.61 | +6.8% |
| Gold | 4408.9 | +0.3% |
| Bitcoin | 77313.22 | -3.8% |


GDP Strength and Labor Market South Korea’s export momentum remained intact, supporting the current-account position and reinforcing the second-half growth impulse. The labor market stayed tight, aiding domestic consumption.
Equity and Currency Moves KOSPI closed the week at 6909.91 after a 1.22% decline. The won finished at 1344.48 against the dollar, little changed on the week. SK Hynix rose 1.63% to 1812000 while Samsung fell 3.89% to 259500, illustrating differentiation within the equity market.
Inflation and Yield Pressures Brent crude’s 6.83% advance to 104.61 added to imported cost pressures. Mortgage lending expanded further in August, adding to household-debt dynamics already flagged by authorities.
Policy-Relevant Cross-Currents The data flow reinforced export resilience without altering the Bank of Korea’s data-dependent stance, as growth momentum coexisted with imported cost pressures from energy. Overall, the week’s arc showed growth momentum persisting while external price shocks began to test the durability of that momentum.
Bank of Korea officials highlighted that any sharp rate surge could strain vulnerable borrowers and increase financial-stability risks, directly tying the observation to the August increase in household loans. Growth strength and the inflation rebound together reinforced the case for maintaining a steady policy rate ahead of the next meeting. Labor-market tightness and sustained income gains supplied further evidence that policymakers must weigh against imported inflation. No speeches or minutes were released during the week, leaving the data prints themselves as the clearest signal that the Bank of Korea continues to monitor both growth strength and cost pressures without immediate recalibration. The configuration leaves the policy path explicitly tethered to incoming prints on inflation and external demand.
| Date | Ctry | Event | Prior | Cons. | Actual |
|---|---|---|---|---|---|
| Mon 7 | KR | GDP Growth Quarter-over-Qu | 1.8 | - | 0.60 |
| Mon 7 | KR | GDP Growth Year-over-Year | 3.8 | - | 3.7 |
| Tue 8 | KR | Unemployment Rate | 2.8 | - | 2.7 |
| Thu 10 | KR | 20-Year Korean Treasury Bo | - | - | - |
No high-impact South Korea data releases are scheduled for September 14–18, leaving markets to track follow-through from the prior week’s oil-price advance and nominal growth strength. Attention will center on any Bank of Korea commentary ahead of the next policy meeting and on whether labor-market tightness sustains consumption momentum. Global semiconductor demand and Brent crude movements at 104.61 will remain key external variables for export-oriented sectors. Mortgage lending expansion in August keeps household-debt dynamics in focus for upcoming decisions. The absence of domestic prints shifts emphasis to how growth and inflation together shape the Bank of Korea’s assessment of the growth-inflation balance over coming quarters. Traders will also monitor won movements near 1344.48 for any renewed pressure on chip and auto exporters.
The Brent advance of 6.83% to 104.61 introduces upside risk to imported inflation that could challenge the Bank of Korea’s tolerance for steady policy even as nominal growth momentum remained strong. A further tightening of household credit raises the possibility that financial-stability concerns begin to influence upcoming decisions more than growth data alone. Downside scenarios center on any reversal in semiconductor export strength. Markets appear to underweight the persistence of energy-driven cost pressures relative to labor-market tightness, leaving scope for repricing if inflation prints remain elevated into the next meeting window.
| Asset | Level | WoW |
|---|---|---|
| JCI | 6541.38 | -1.2% |
| KLCI | 1686.74 | -1.6% |
| STI | 5695.93 | -1.7% |
| USD/IDR | 17606.0 | -0.2% |
| USD/THB | 33.04 | +0.4% |
| USD/MYR | 4.07 | +0.7% |
| USD/PHP | 62.69 | +0.1% |
| USD/SGD | 1.27 | +0.0% |
| Brent Crude | 104.61 | +6.8% |
| Gold | 4408.9 | +0.3% |
| Bitcoin | 77316.61 | -3.8% |


Labor Market and Domestic Demand Signals Philippines labor-market indicators pointed to weaker demand in a remittance-reliant economy. Indonesia consumer confidence and retail sales improved, supporting the 2026 growth outlook. Thailand expansion drew support from global technology and electronics exports while SME loan pressures persisted.
Commodity Price Impulse and External Buffers Brent crude rose 6.83% to close at 104.61, lifting imported-inflation risks for net-energy importers. Indonesia foreign reserves increased in August, widening scope for Bank Indonesia FX operations. The rupiah closed at 17,606 after touching a multi-month high, aided by capital inflows and local-currency measures.
Equity and Currency Market Divergence JCI declined 1.18% week-over-week to 6,541.38 while KLCI fell 1.64% to 1,686.74 and STI dropped 1.66% to 5,695.93. USD/IDR eased 0.18% to 17,606 while USD/MYR rose 0.65% to 4.07 and USD/THB gained 0.36% to 33.04. Regional markets absorbed the commodity move without immediate policy shifts.
Policy and Structural Context Bank Indonesia advanced local-currency settlement frameworks with BRICS partners to reduce dollar dependence. Thailand inflation reached a three-month high in August on fuel and food costs, yet the policy-rate path remained unchanged. Growth expectations for 2026 stayed intact across the six economies.
Bank Indonesia cited the August reserve increase and local-currency transaction rollout as stability tools. Bank Negara Malaysia held the overnight policy rate amid balanced growth and inflation. Bangko Sentral ng Pilipinas viewed labor-market softening as consistent with holding the policy rate. Bank of Thailand noted the three-month high inflation print alongside tech-supported growth without altering guidance. Monetary Authority of Singapore and State Bank of Vietnam left policy rates on hold. The absence of meetings reinforced that upcoming decisions hinge on the next inflation and activity prints.
| Date | Ctry | Event | Prior | Cons. | Actual |
|---|---|---|---|---|---|
| Mon 7 | PH | Unemployment Rate | 4.9 | - | - |
| Tue 8 | SG | MAS 12-Week Treasury Bill | - | - | 1.6 |
| Tue 8 | SG | MAS 4-Week Treasury Bill A | - | - | 1.6 |
| Tue 8 | SG | Foreign Exchange Reserves | 549.3bn | - | - |
| Tue 8 | ID | Consumer Confidence Index | 117 | - | - |
| Wed 9 | MY | Industrial Production Year | 6.5 | - | 4.7 |
| Wed 9 | ID | Motorbike Sales Year-over- | 8.3 | - | 3.2 |
| Wed 9 | TH | Monetary Policy Meeting Mi | - | - | - |
| Wed 9 | PH | Foreign Direct Investment | 200.0mn | - | - |
| Wed 9 | ID | Retail Sales Year-over-Yea | -3.0 | - | - |
| Thu 10 | SG | 6-Month Treasury Bill Auct | - | - | 1.7 |
| Fri 11 | MY | Retail Sales Year-over-Yea | 6.6 | - | 6.4 |
| Fri 11 | MY | Unemployment Rate | 3.0 | - | 3.0 |
| Fri 11 | TH | Foreign Exchange Reserves | 275.4bn | - | 283.1bn |

No high-impact releases are scheduled for Indonesia, Thailand, Philippines, Singapore, Malaysia or Vietnam. Officials at the six central banks will continue to weigh external commodity and USD moves against domestic demand indicators when setting policy-rate paths.
The Brent advance to 104.61 introduces upside risk to inflation across import-dependent economies, potentially delaying easing at BI, BoT and BSP. Philippines labor-market softening raises downside growth risks that could keep BSP on hold. Indonesia reserve accumulation mitigates near-term rupiah volatility but does not offset external price shocks. Markets appear to underweight SME debt pressures in Thailand and labor fragility in the Philippines. The region remains exposed to further commodity volatility.
| Asset | Level | WoW |
|---|---|---|
| Nifty 50 | 23398.1 | -1.6% |
| Sensex | 74781.76 | -1.8% |
| USD/INR | 95.54 | +1.2% |
| EUR/INR | 110.8 | +1.1% |
| Reliance | 1257.5 | -4.0% |
| HDFC Bank | 708.25 | -0.3% |
| Brent Crude | 104.61 | +6.8% |
| Gold | 4408.9 | +0.3% |
| Bitcoin | 77316.61 | -3.8% |


Oil shock dominates market pricing. Brent crude posted a 6.83 percent weekly gain to 104.61, lifting India’s oil import bill and testing external balances.
Rupee breaches 95 threshold. USD/INR rose 1.18 percent to 95.54.
Equity indices absorb the pressure. Nifty 50 fell 1.6 percent to 23,398.10 and Sensex declined 1.77 percent to 74,781.76, with Reliance dropping 3.97 percent to 1,257.50 while HDFC Bank finished 0.32 percent lower at 708.25.
Growth narrative remains intact. External pressures weighed on asset prices while the broader expansion continued to support resilience.
No domestic data prints altered the arc. The absence of scheduled releases left markets focused on external oil dynamics.
Sector rotation reflected external stress. IT and defensives drew attention while energy-exposed names faced valuation pressure from the Brent advance above 100.
Bond market stayed range-bound. Indian bonds finished flat as participants assessed external price pressures.
External cross-currents set the tone. Gold rose 0.34 percent to 4,408.90 while Bitcoin fell 3.78 percent to 77,316.61, underscoring the risk-off flavor that accompanied the commodity impulse.
The central bank intervened in spot and forward markets and executed currency swaps to contain volatility in USD/INR. Officials maintained the policy rate while absorbing liquidity. Record forex reserves signal continued dollar accumulation even as intervention intensity increased with Brent above 100. The combination of oil-driven import costs and liquidity absorption points to a continued focus on currency stability ahead of the next meeting.
| Date | Ctry | Event | Prior | Cons. | Actual |
|---|---|---|---|---|---|
| Fri 11 | IN | Foreign Exchange Reserves | - | - | 785.7bn |
| Sat 12 | IN | Inflation Rate Year-over-Y | 4.5 | - | - |
| Sat 12 | IN | Inflation Rate Month-over- | 0.88 | - | - |

No high-impact domestic indicators appear on the calendar through September 18, keeping attention on external oil dynamics and any further central bank operations. Markets are expected to price policy response to oil volatility through observed intervention. Traders will also monitor any updates from ongoing India-Thailand trade discussions that could affect the current-account outlook.
The sharp Brent advance raises the prospect of second-round inflation effects that could challenge the central bank’s ability to maintain the current policy stance. Continued foreign investor exits from bonds highlight the risk that higher global yields divert capital and widen the current-account funding gap. Upside scenarios center on sustained reserve accumulation providing additional intervention capacity, while downside scenarios involve further oil spikes that force larger liquidity drains and test rupee tolerance above 95. The market appears to underweight the persistence of the commodity impulse relative to data-dependent signals, leaving room for repricing if the next inflation outcome deviates from expectations.
| Asset | Level | WoW |
|---|---|---|
| BIST 100 | 14467.3 | +2.2% |
| USD/TRY | 48.16 | -0.5% |
| EUR/TRY | 56.43 | +0.3% |
| GBP/TRY | 65.69 | +0.3% |
| Gold (TRY) | 4408.9 | +0.3% |
| Brent Crude | 104.61 | +6.8% |
| EUR/USD | 1.16 | -0.1% |
| Bitcoin | 77312.11 | -3.8% |


Equity and currency resilience amid energy impulse The BIST 100 closed the week at 14,467.30 for a net 2.23 percent advance. This performance occurred against Brent crude’s 6.83 percent rise to 104.61, confirming the commodity-driven price pressure.
TRY stability despite imported inflation risks USD/TRY posted a net 0.54 percent weekly softening to 48.16. EUR/TRY and GBP/TRY posted smaller net gains of 0.29 percent and 0.31 percent respectively, indicating limited broad-based depreciation pressure. Gold priced in lira rose 0.34 percent to 4,408.90, consistent with the global commodity bid.
Absence of domestic data releases The economic calendar contained no Turkish releases for the week of September 7–13. Bitcoin’s 3.78 percent weekly decline to 77,312.11 provided an additional risk-off signal that failed to transmit to Turkish equities.
Policy continuity confirmed With no Central Bank of the Republic of Turkey communications, the data-dependent equilibrium remained intact. The configuration leaves imported inflation risks from the latest energy move competing with the absence of fresh activity prints.
No Central Bank of the Republic of Turkey speakers, minutes, or decisions were released during the week. The policy rate therefore stayed on its existing data-dependent path. Brent’s 6.83 percent advance to 104.61 reinforced the imported inflation channel that has guided recent communications, while the lack of domestic activity or inflation prints left officials without new inputs for recalibration. The lira’s 0.54 percent weekly gain against the dollar supplied a modest offset to energy-driven price pressures, yet the Central Bank of the Republic of Turkey’s forward guidance remains tethered to incoming data rather than single-week market moves. Officials’ prior emphasis on a broad range of options continues to apply, with the next decisions still conditioned on the balance between commodity impulses and real-economy prints.
| Date | Ctry | Event | Prior | Cons. | Actual |
|---|---|---|---|---|---|
| Mon 7 | TR | Treasury Cash Balance | -395.6bn | - | - |
| Thu 10 | TR | Industrial Production Year | -1.4 | - | -0.30 |
| Thu 10 | TR | Industrial Production Mont | 0.10 | - | -1.0 |
| Thu 10 | TR | TCMB Interest Rate Decisio | 37.0 | - | 37.0 |
| Thu 10 | TR | Overnight Borrowing Rate | 35.5 | - | 35.5 |
| Thu 10 | TR | Overnight Lending Rate | 40.0 | - | 40.0 |
| Thu 10 | TR | Foreign Exchange Reserves | - | - | 70.4bn |
| Fri 11 | TR | Current Account Balance | -4.2bn | - | 36.0mn |
| Fri 11 | TR | Retail Sales Month-over-Mo | 0.70 | - | 0.20 |
| Fri 11 | TR | Retail Sales Year-over-Yea | 11.8 | - | 10.4 |
The calendar for September 14–18 shows no high-impact Turkish releases, extending the quiet period observed this week. Attention will therefore remain on global energy prints and any follow-through from Brent’s move to 104.61. Should additional commodity data confirm sustained elevation, the Central Bank of the Republic of Turkey’s data-dependent framework will incorporate the implications for coming quarters’ inflation trajectory. Any external central bank communications that alter global rate differentials could influence TRY flows, though the policy rate path itself stays anchored to domestic releases. The absence of scheduled events leaves the upcoming decisions reliant on incoming data.
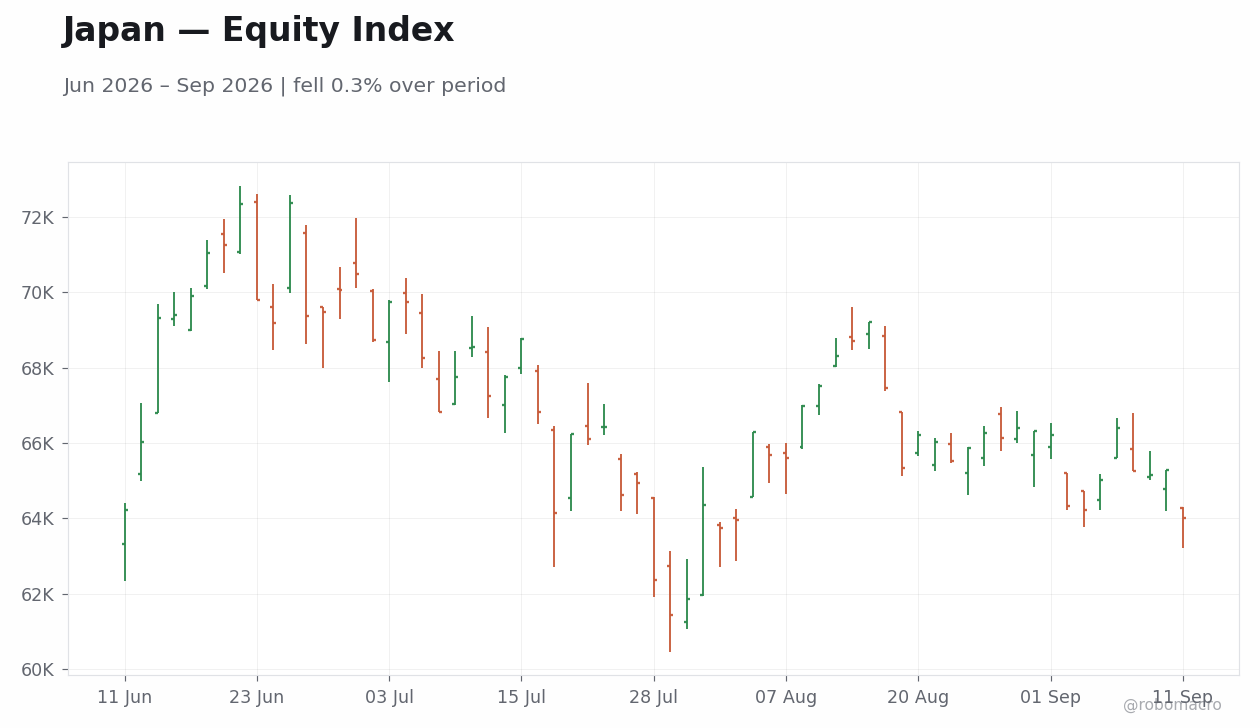
Brent’s further advance introduces upside risk to the imported inflation component that has shaped the Central Bank of the Republic of Turkey’s recent posture, potentially extending the period of vigilance into coming quarters. The BIST 100’s 2.23 percent gain may overstate underlying momentum if energy prices remain elevated without offsetting domestic demand strength. Conversely, any reversal in Brent would ease the inflation impulse faster than currently embedded in the data-dependent path. The lira’s modest weekly appreciation against the dollar suggests markets are not yet pricing persistent depreciation pressure, yet this could shift quickly on the next commodity or activity surprise. Overall, the configuration favors continued tolerance for divergent prints without immediate policy adjustment.
| Asset | Level | WoW |
|---|---|---|
| Saudi Aramco | 25.72 | -0.9% |
| MSCI Saudi | 38.22 | -0.6% |
| MSCI UAE | 19.89 | +1.3% |
| MSCI Qatar | 17.32 | -0.4% |
| MSCI Kuwait | 37.74 | +0.1% |
| Brent Crude | 104.61 | +6.8% |
| WTI Crude | 100.05 | +7.5% |
| Gold | 4408.9 | +0.3% |
| USD/SAR | 3.75 | +3.1% |
| USD/AED | 3.67 | +0.0% |
| USD/KWD | 0.31 | -0.6% |
| Bitcoin | 77312.11 | -3.8% |


Geopolitical Oil Shock Dominates Brent crude closed at 104.61 and WTI crude finished at 100.05. Saudi Aramco shares ended at 25.72, down 0.92 percent week-over-week.
Saudi Growth Divergence No PMI, CPI, or trade releases emerged from Saudi Arabia, UAE, Qatar, Kuwait, Oman, or Bahrain during the period.
Regional Equity Divergence MSCI UAE advanced 1.27 percent to close at 19.89, while MSCI Qatar finished at 17.32 after a 0.38 percent decline. MSCI Saudi eased 0.57 percent to 38.22 and MSCI Kuwait rose 0.05 percent to 37.74. USD/SAR moved to 3.75, up 3.09 percent week-over-week, while USD/AED held at 3.67 and USD/KWD closed at 0.31 after a 0.61 percent decline.
Commodity and Safe-Haven Flows Gold finished at 4408.90, up 0.34 percent for the week. Bitcoin declined 3.78 percent to 77312.11.
Fiscal and Market Implications Elevated crude prices provided fiscal breathing room for GCC exporters. Regional equity performance remained sensitive to external factors. The configuration leaves the expansion in its mid-phase where imported inflation risks from energy compete with selective labor-market softening observed in prior weeks.
No GCC central bank meetings, minutes, or speeches took place during the week. The data-dependent equilibrium observed across developed markets in prior weeks therefore extended to the GCC, with officials absorbing the Brent advance without immediate recalibration of the policy rate. Elevated oil prices should support fiscal balances across GCC exporters, reducing near-term pressure on the policy rate path. The absence of new inflation or activity prints left the deposit rate trajectory explicitly tethered to incoming data.
| Date | Ctry | Event | Prior | Cons. | Actual |
|---|---|---|---|---|---|
| Tue 8 | SA | GDP Growth Year-over-Year | 3.0 | - | -4.7 |
| Thu 10 | SA | Industrial Production Year | -16.3 | - | -8.1 |
No high-impact data releases or central bank decisions are scheduled across the GCC states next week. Markets will monitor Brent and WTI for additional supply-premium adjustments that could influence fiscal balances. Regional equity flows may continue to favor UAE and Qatar indices on relative stability perceptions. Sovereign credit spreads may widen if external tensions persist, keeping the policy rate on a data-dependent footing. Broader attention stays on fiscal impacts from sustained crude prices above 100.
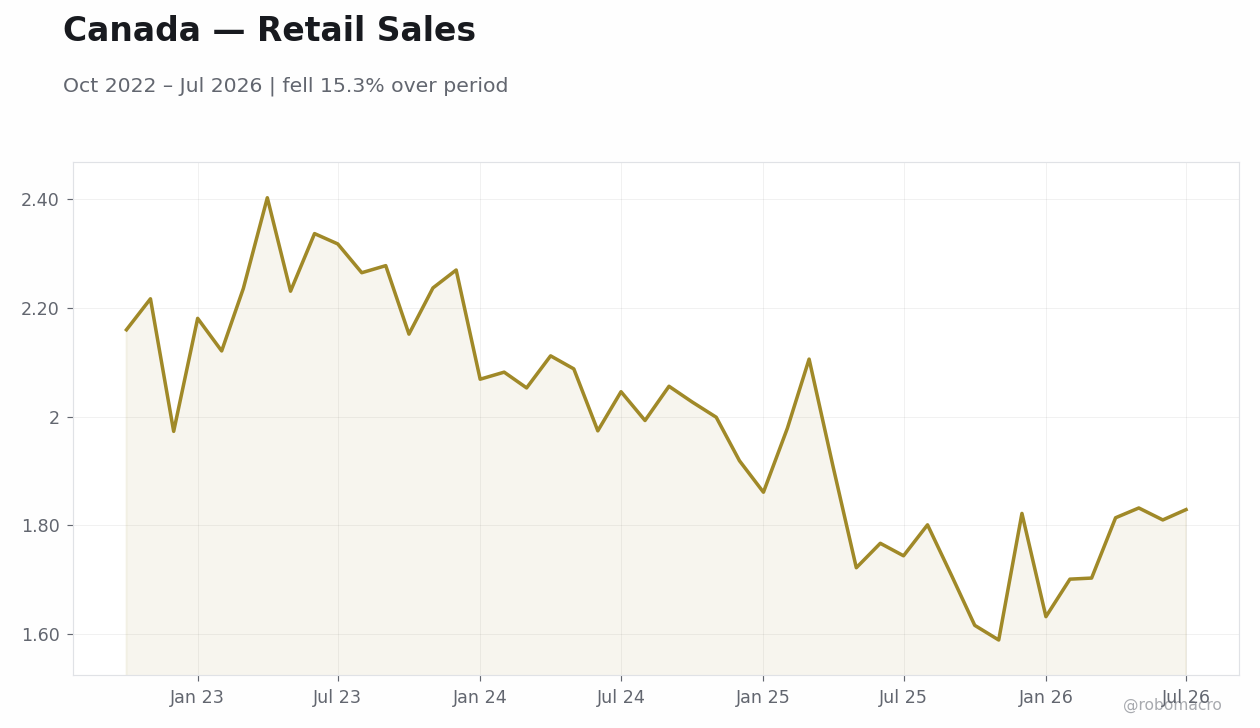
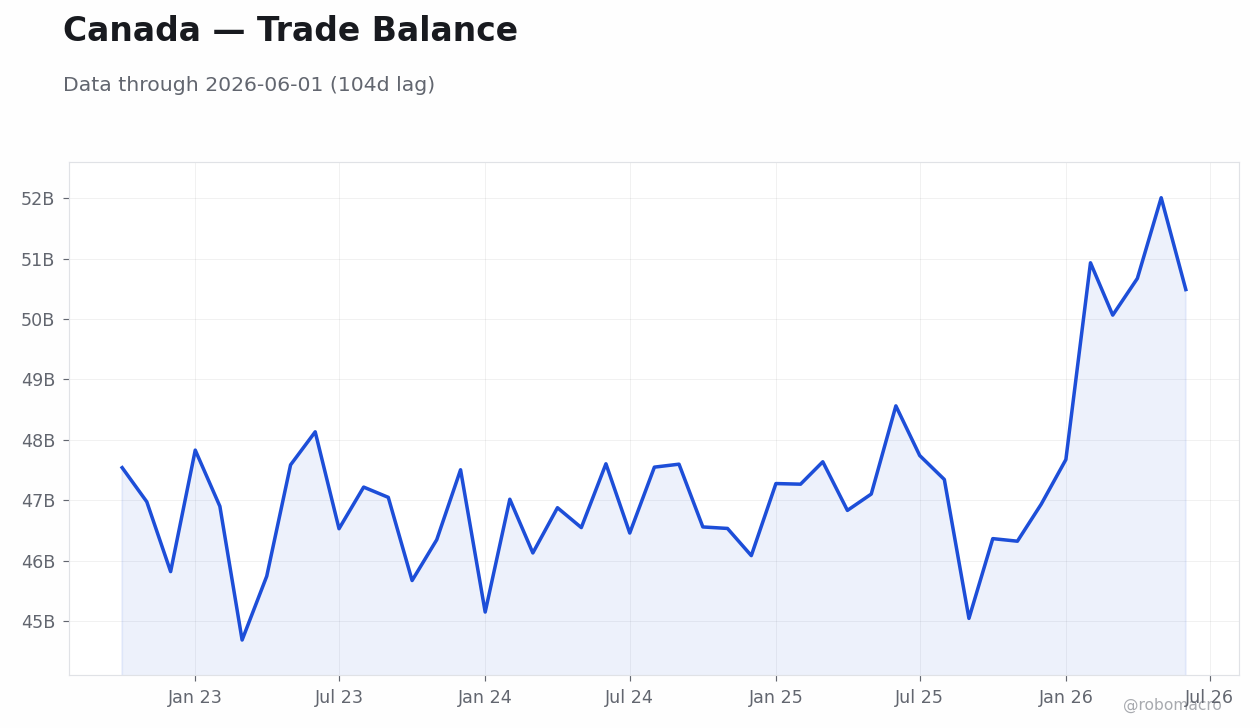
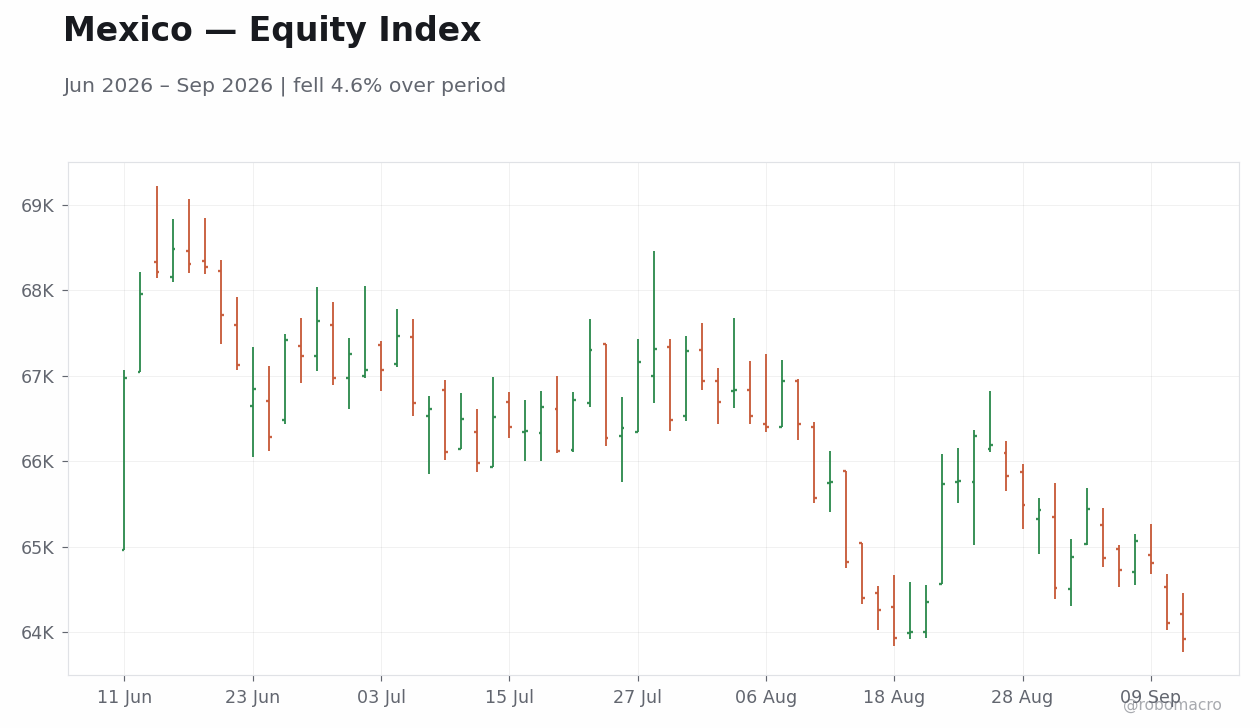
The week’s oil surge to 104.61 shifts the outlook toward upside risks for GCC fiscal balances but introduces downside scenarios for non-oil investment if external conditions deter capital inflows. Equity markets appear to price relative stability in the UAE and Qatar while underweighting direct Saudi exposure, creating potential for further divergence. The data-dependent stance across GCC central banks leaves room for the policy rate to stay unchanged.
| Time | Country | Event | Our Est. | Consensus | Prior | Impact |
|---|
AI-Generated Content: This publication is 100% generated by artificial intelligence systems and should not be considered as financial advice, investment recommendation, or professional research. All analysis, forecasts, and commentary are algorithmically produced.
Data Sources: Market data from public exchange and market-data providers. US Treasury yields from the Federal Reserve (FRED constant-maturity series). Macroeconomic data from central banks and national statistics offices. Economic calendar data from RoboMacro Economic Calendar. All data subject to revision and may be delayed.
No Warranty: RoboMacro makes no warranty, express or implied, regarding the accuracy, completeness, or reliability of the information contained in this publication. Data may be delayed, incomplete, or contain errors. Past performance is not indicative of future results.
Not Financial Advice: Nothing in this publication constitutes investment advice, tax advice, legal advice, or any other form of professional advice. Any opinions expressed are AI-generated and do not represent the views of any individual or organisation. Readers should consult qualified professionals before making investment decisions.
Nowcasts and Model Output: The US labour nowcast is the median of a ten-model ensemble. Activity indices are composite z-scores of weekly public high-frequency indicators, seasonally adjusted, published only for weeks meeting a minimum indicator-coverage threshold; the as-of date and coverage are shown on every row. All model output carries significant uncertainty.
Contact: [email protected] | robomacro.com
Publication: Global Macro Watch is published weekly on Sundays, covering the preceding Monday-to-Friday week. © 2026 RoboMacro. All rights reserved.