Published every Sunday afternoon 100% AI-generated — not financial advice
Risk Appetite Holds Selective Ground
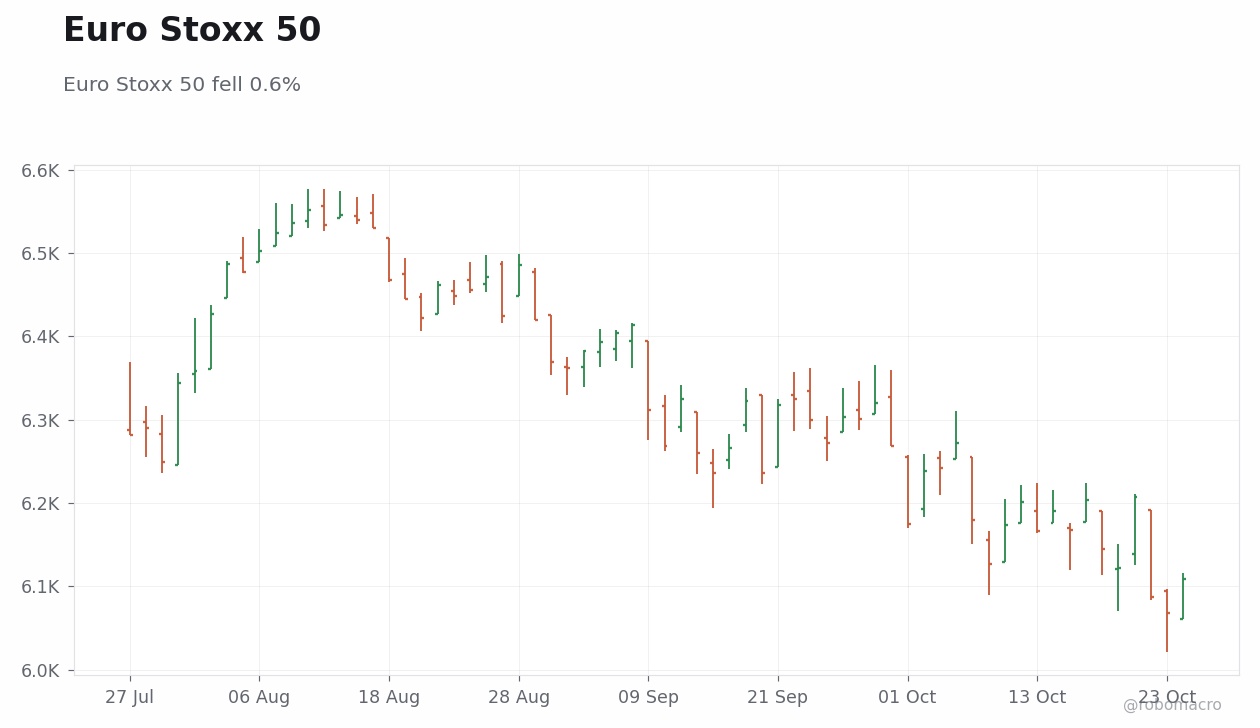
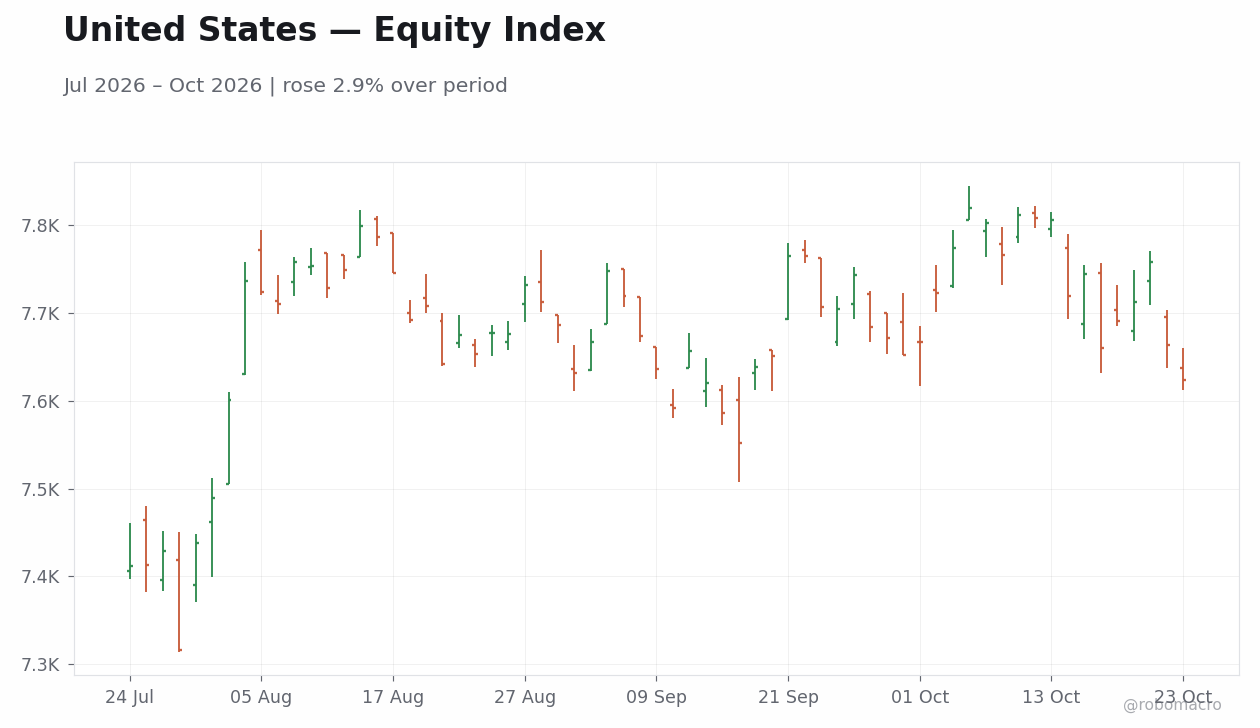
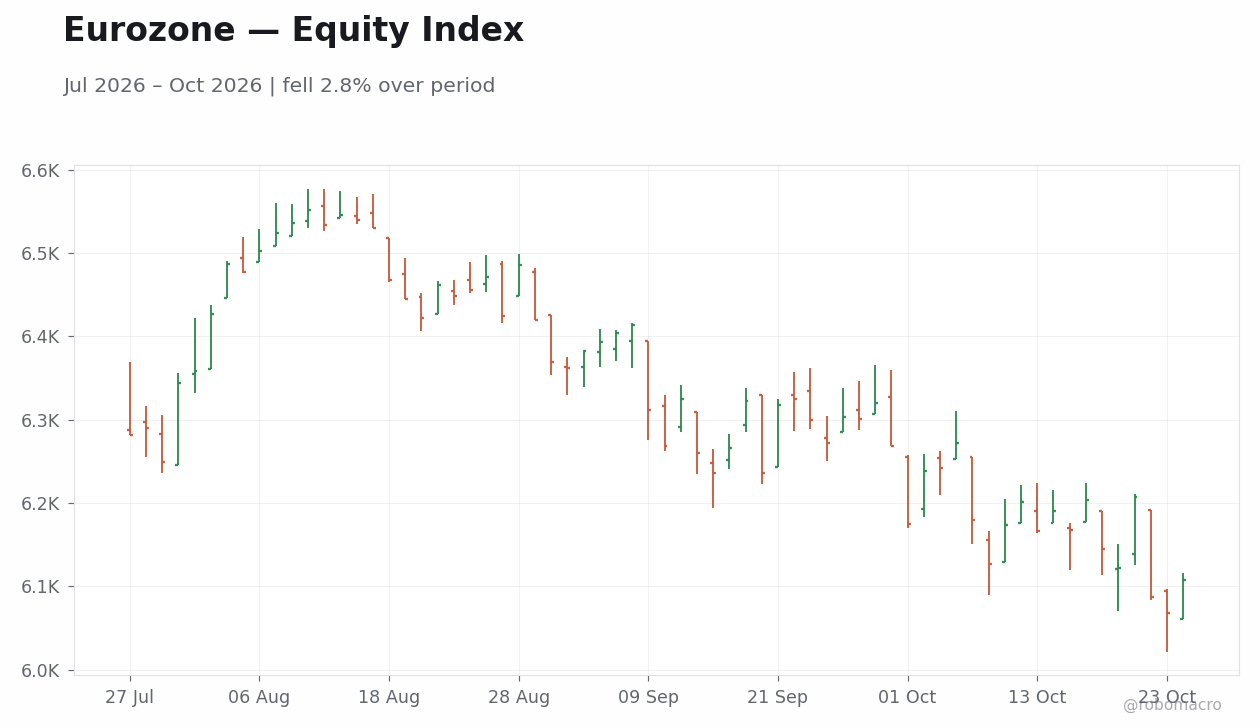
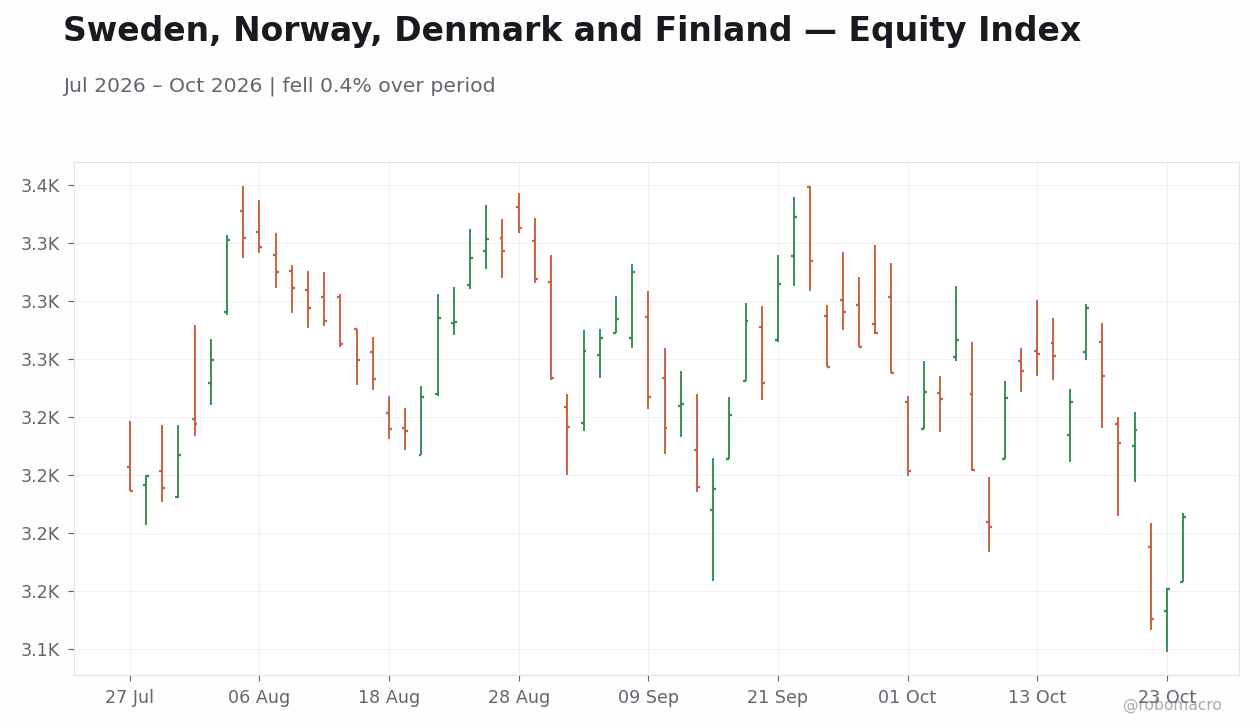
Global risk appetite led the tape this week even as headline equity indices posted uneven results. The S&P 500 declined 0.87% while the Nasdaq 100 fell 1.94%, yet the Russell 2000 advanced 1.74%, pointing to rotation into smaller-capitalization names rather than outright de-risking. Euro Stoxx 50 closed at 6,107.98, down 0.6%, while the DAX gained 0.41% to 25,422.41, underscoring national divergence inside the euro area. We note that these patterns align with the 4.57 reading that placed equities and risk appetite at the top of the weekly ranking. The data suggest investors are testing rather than abandoning exposure, with small-cap outperformance offsetting pressure on large-cap technology names.
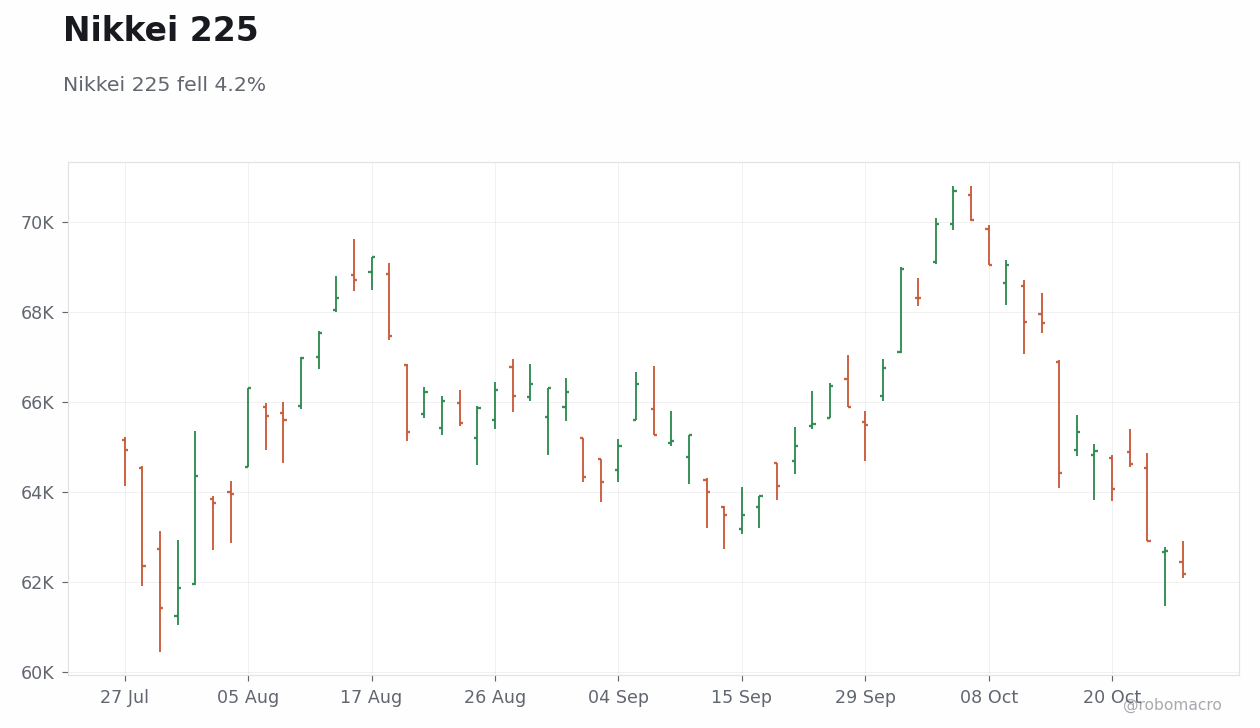
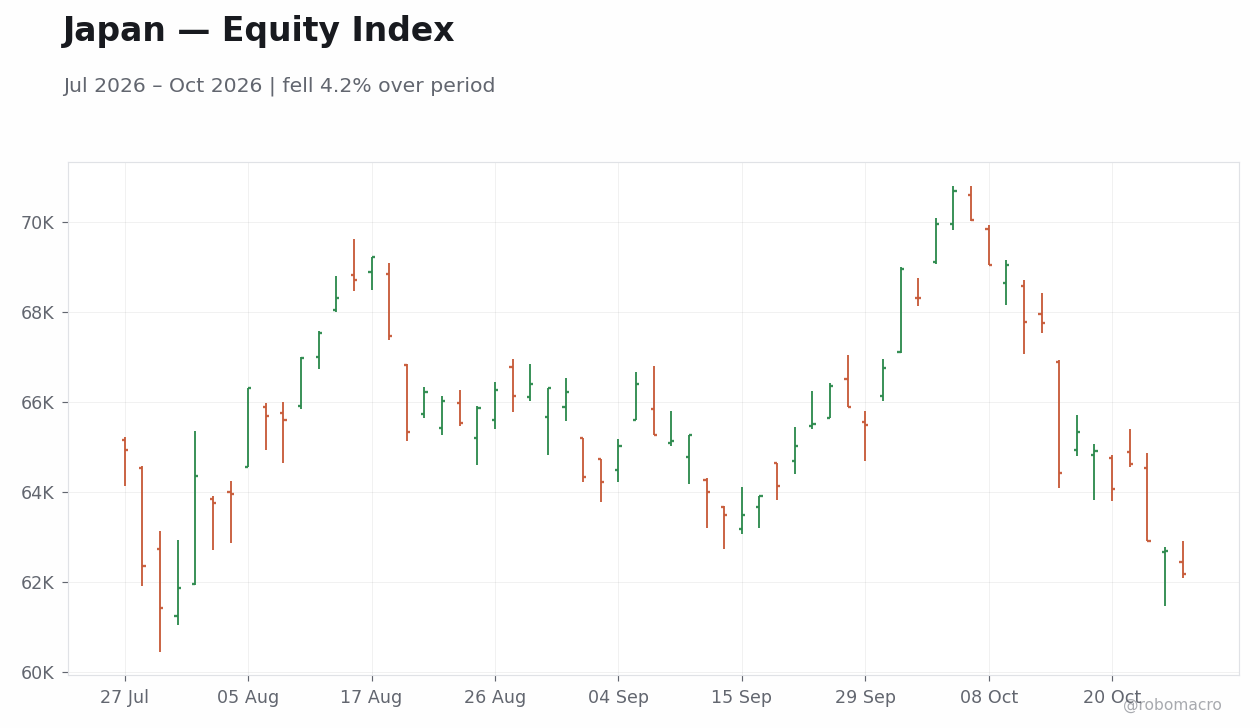
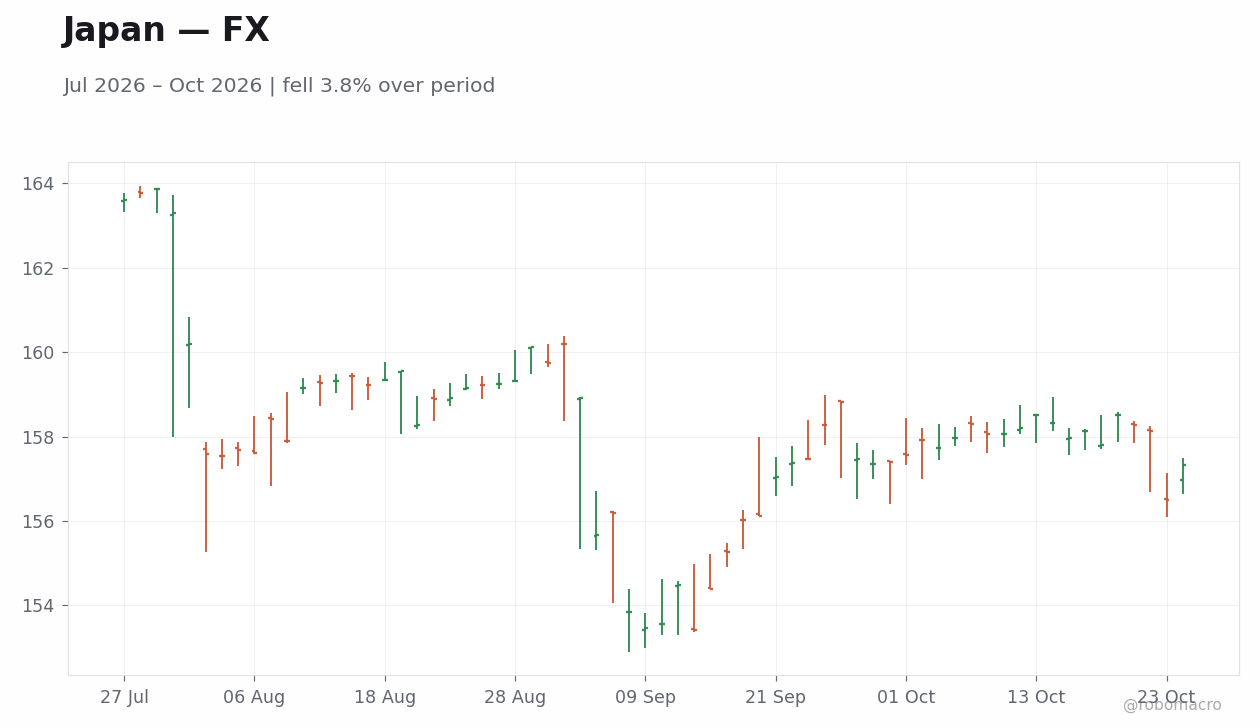
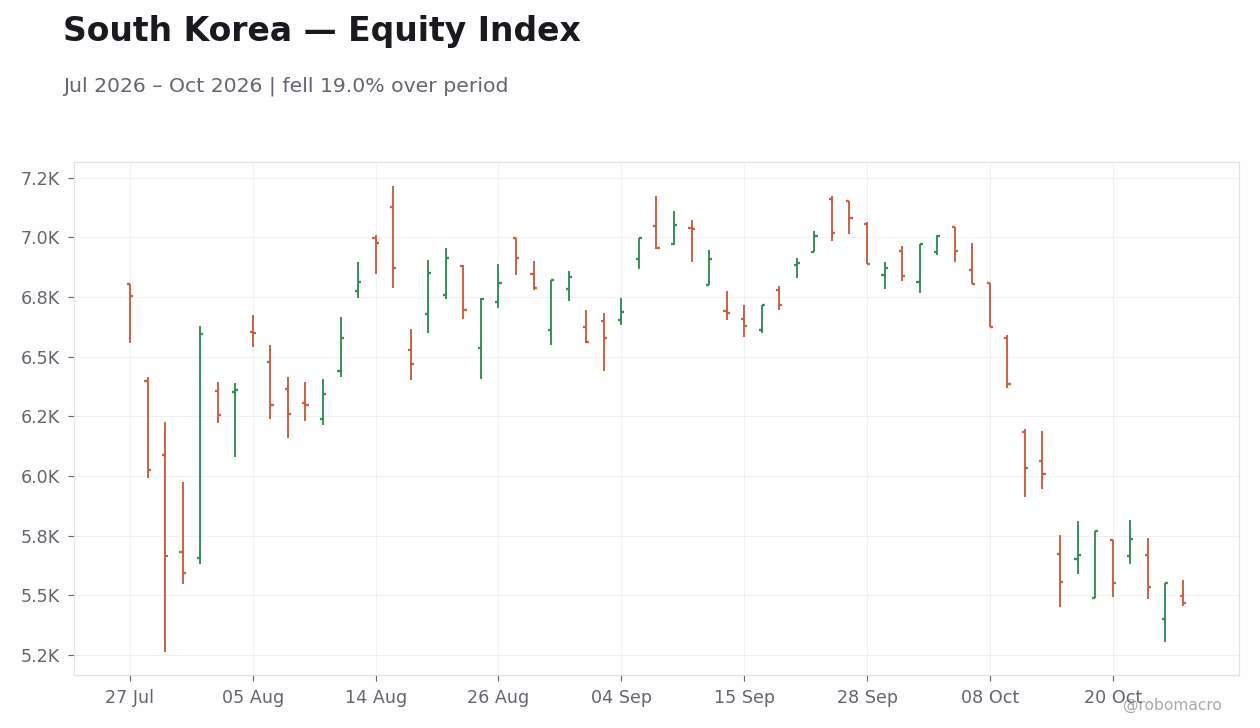
Nikkei 225 fell 4.2% to 62,189.65 and KOSPI dropped 5.18% to 5,469.47, yet both markets absorbed the moves without triggering broader outflows. USD/JPY eased to 157.32, tempering the yen’s earlier strength and limiting imported-cost pressure on Japanese exporters. The combination of equity weakness and contained currency volatility indicates that risk appetite remains intact rather than in retreat. We observe that gold’s 3.03% decline further supports this reading, as reduced safe-haven demand typically accompanies steady or improving risk sentiment.
DM Divergence Reflects Policy Anchors
In developed markets, equity and rate outcomes diverged along policy lines. US 10-year yields moved lower by 14bp even as the curve steepened, consistent with firm near-term growth expectations and unchanged policy rates. UK inflation and labor data surprised higher, lifting front-end gilt yields while sterling rose against softer global risk readings. Governor Bailey noted that second-round inflation pressures remain subdued, leaving the Bank of England’s path data-dependent rather than pre-committed.
Japanese officials reinforced hawkish signals as underlying inflation approaches the 2% target. Bank of Japan Governor Ueda and Deputy Governor Himino both flagged readiness for further rate increases, yet the equity market absorbed the commentary without disorderly selling. Nordic equities finished mixed, with OMX Copenhagen 25 and Oslo Bors advancing while OMX Stockholm 30 declined, reflecting commodity-linked differentiation inside the region. The pattern across DM equity and rate markets points to policy divergence that supports selective risk taking rather than broad de-risking.
EM Flows Show Contained Pressure
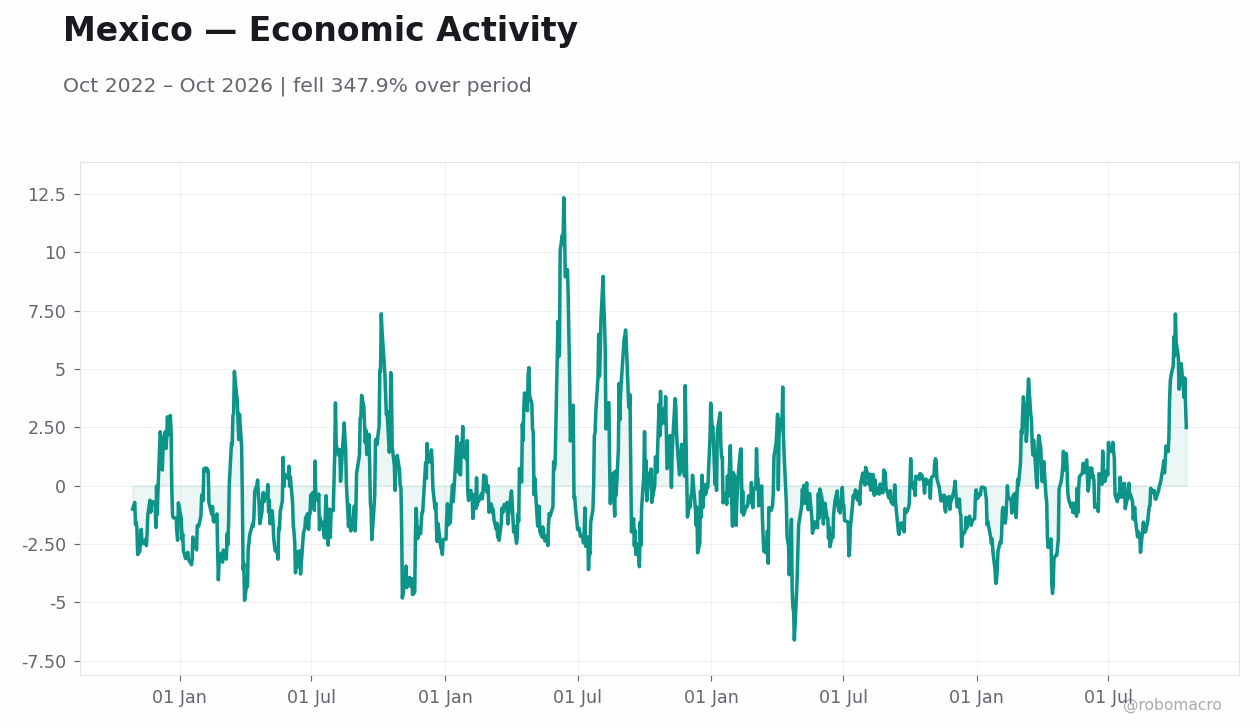
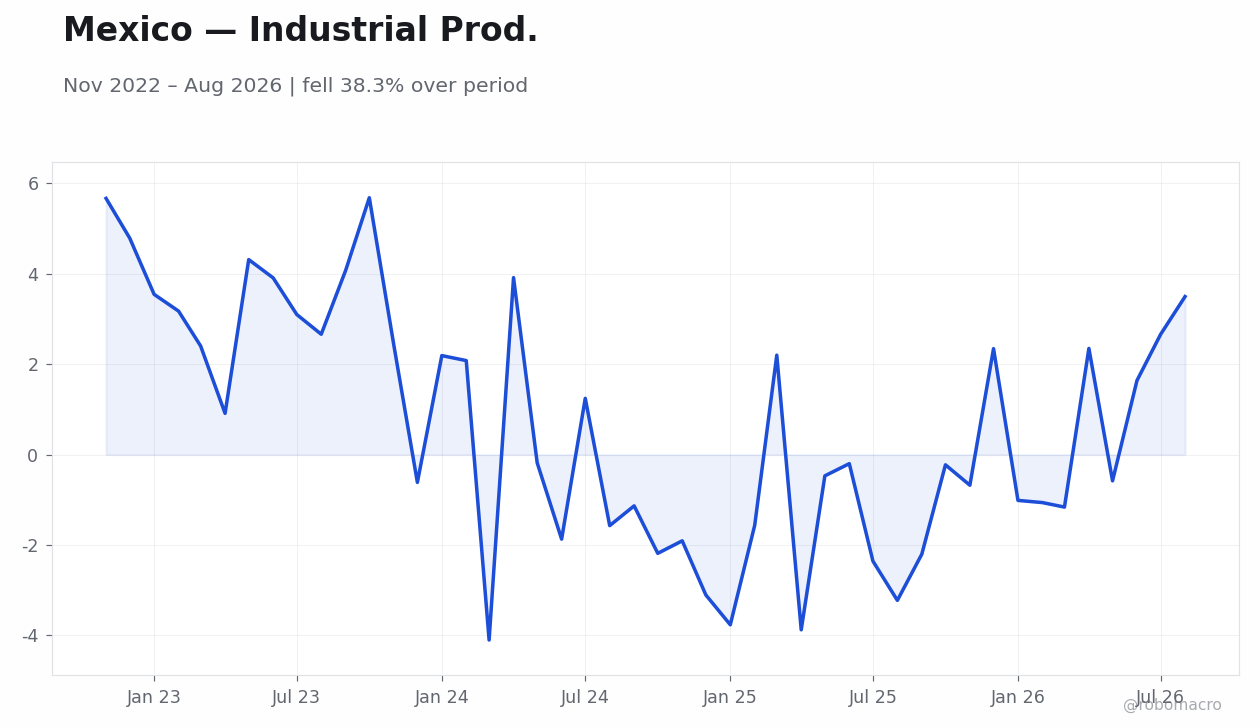
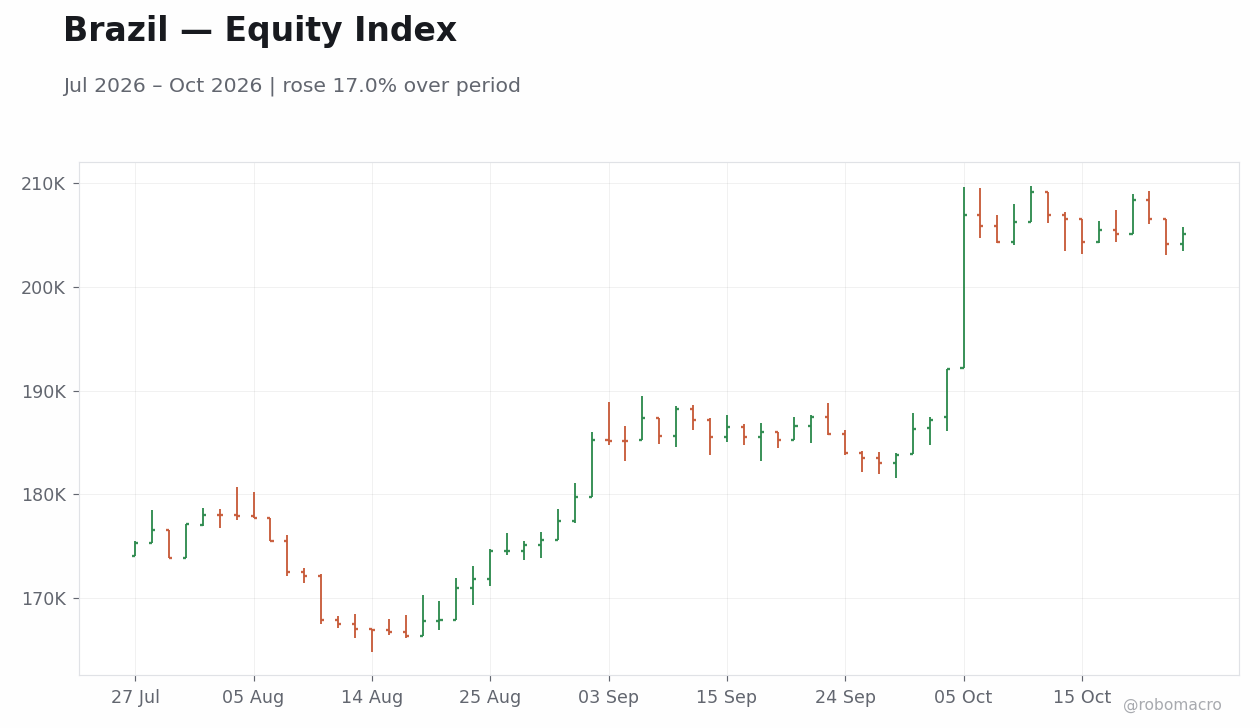
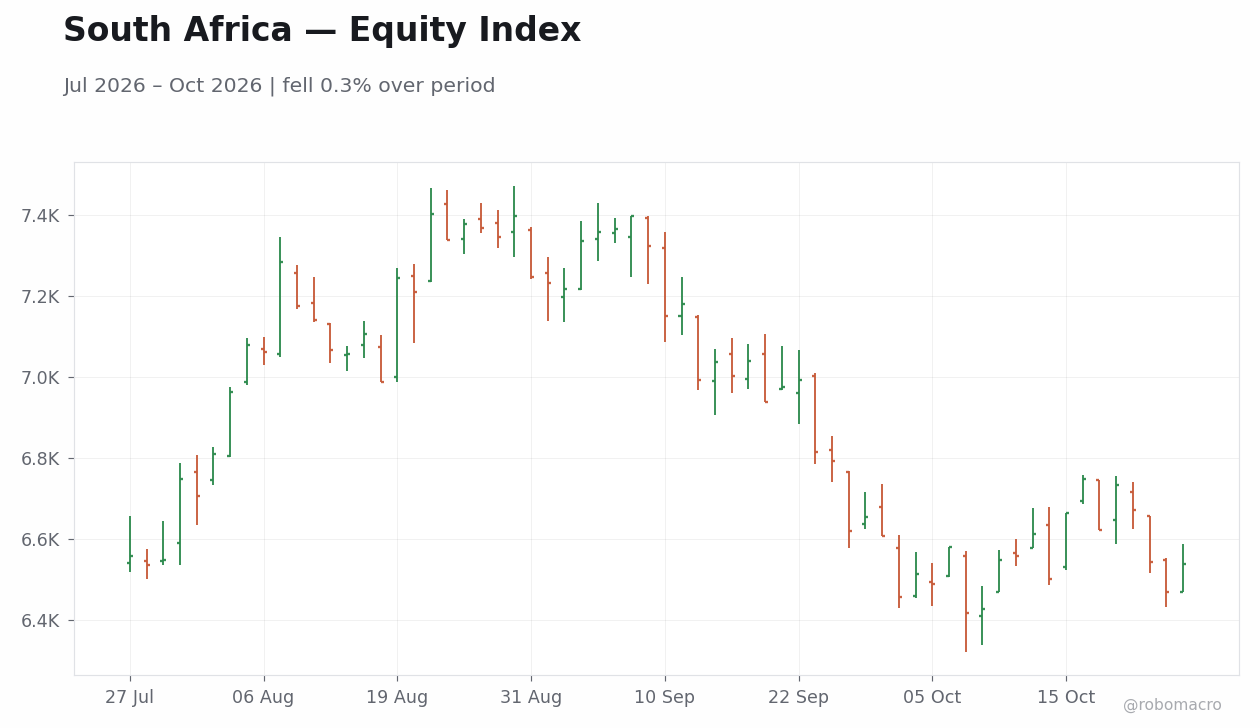
Emerging-market equity and currency moves remained within recent ranges despite selective weakness. Indonesia’s JCI index rose 7.53% to 5,373.09 after an initial drop and subsequent rebound supported by Bank Indonesia liquidity measures. Mexico’s IPC Bolsa gained 1.26% to 69,879.62 while the peso weakened modestly. Brazil’s Bovespa closed at 205,083 after mixed daily moves following the narrow presidential runoff victory.
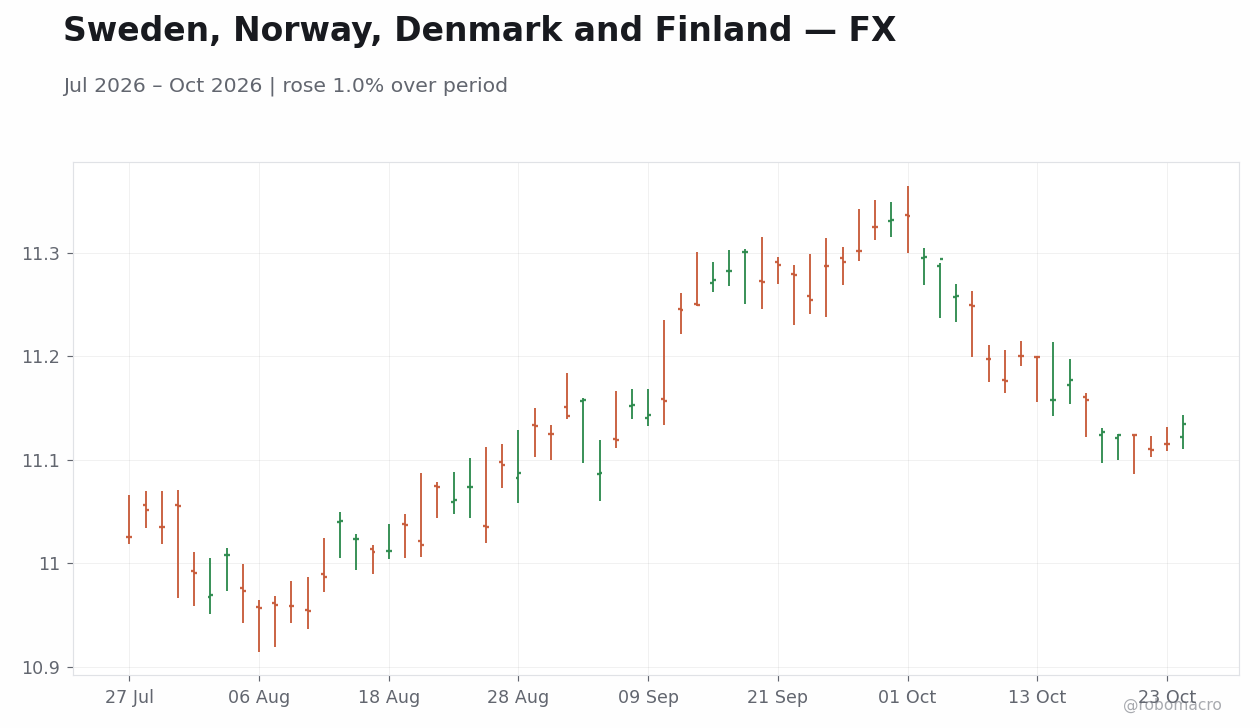
Peru’s sol posted the region’s largest move as USD/PEN rose 3.22% amid copper-price softness and equity outflows. Regional FX showed broad softening against the euro, with EUR/HUF, EUR/PLN and EUR/CZK all higher. We note that these adjustments occurred without triggering capital-control responses or sharp reserve drawdowns, consistent with contained risk-appetite erosion rather than outright flight.
Cross-Asset Positioning Remains Balanced
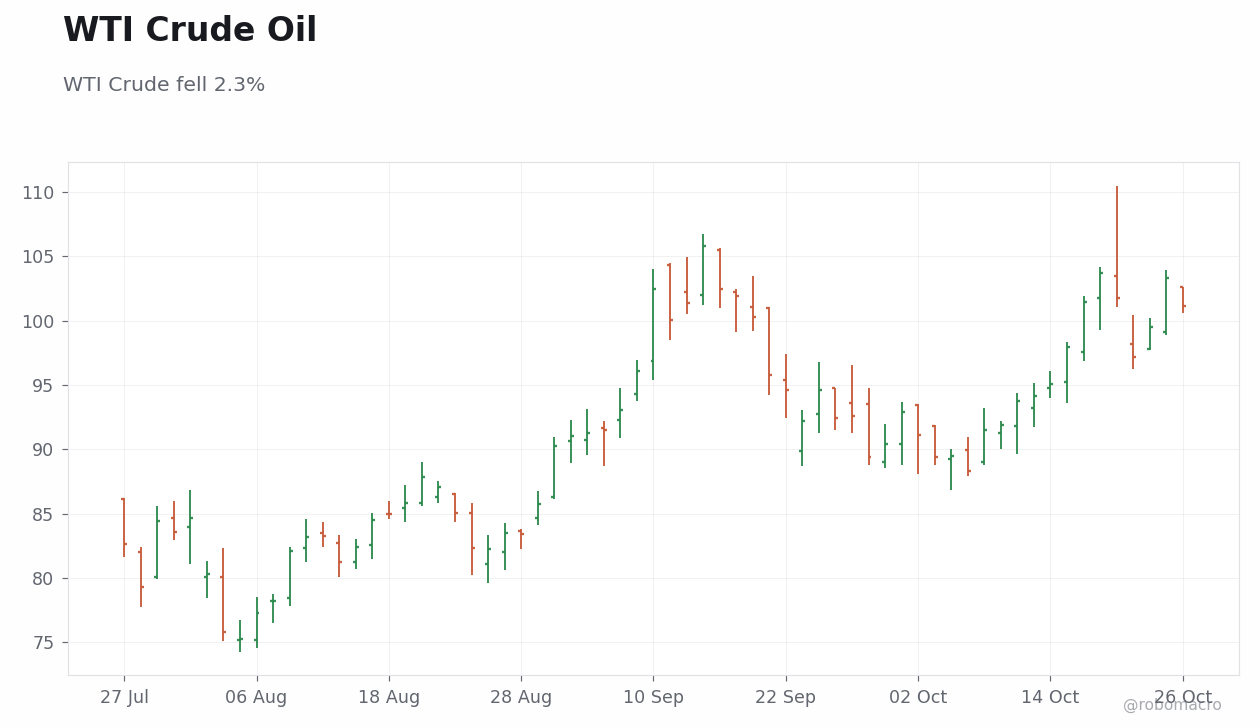
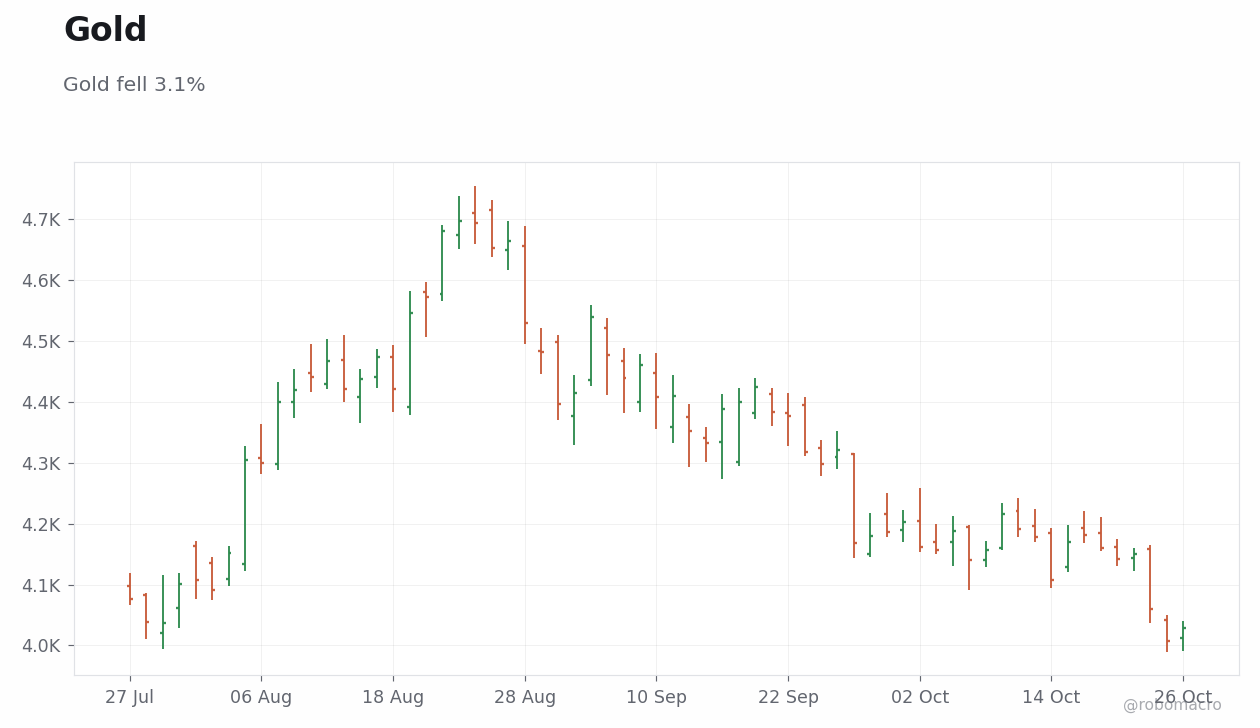
Rates, FX and commodities together painted a picture of measured positioning. France 10-year yields rose 25bp while Italy 10-year yields rose 11bp, widening the French-German spread to the highest level in over a decade. Indonesia 10-year yields rose 28bp, the largest move on the volatility-adjusted ranking. Brent crude ended at 110.3 after a 0.68% weekly gain while WTI closed at 101.3, down 2.28%. Gold declined 3.03% and silver fell 5.3%, reflecting lower safe-haven demand.
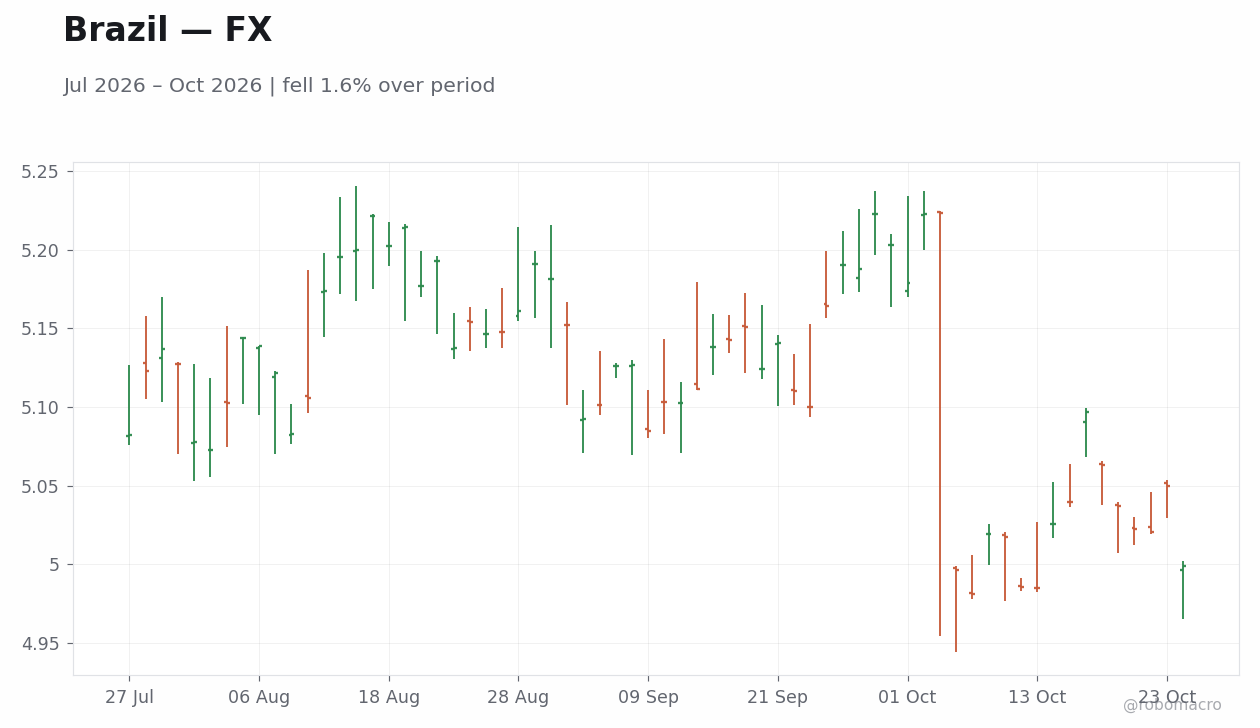
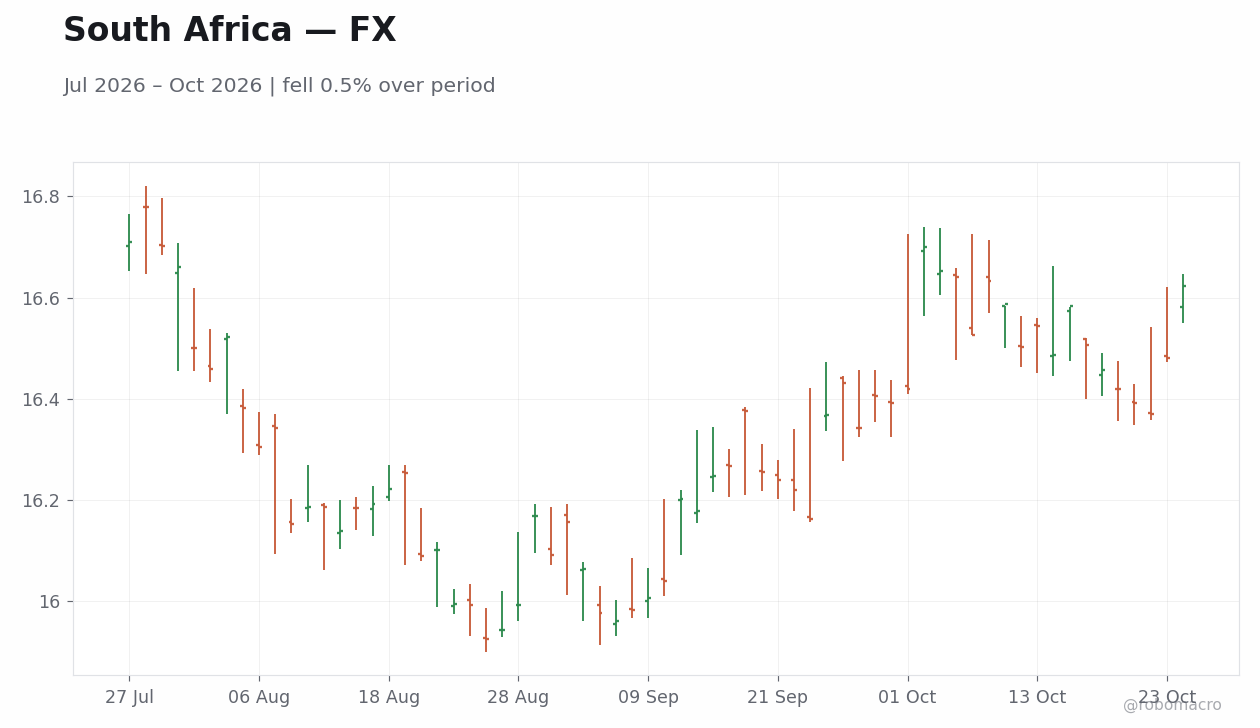
USD/BRL moved lower by 1.3% and USD/ZAR closed at 16.62 after modest net depreciation. The combination of higher Brent, softer precious metals and contained EM currency moves suggests investors are maintaining exposure to growth-sensitive assets while trimming tail-risk hedges. We observe that this cross-asset configuration aligns with the equity-led risk reading rather than a broad defensive shift.
Policy Outlook Stays Data-Dependent
Central-bank communications this week emphasized incoming data over forward guidance. Banco de Mexico held its policy rate steady against the latest CPI print, preserving a wide real-rate buffer. Bank of Korea signaled future hikes while keeping the current rate unchanged, citing growth that exceeded forecasts and strong AI-semiconductor exports. SARB Governor Kganyago reiterated that CPI is expected to decline through 2027, preserving the meeting-by-meeting stance.
In China, Q3 GDP beat expectations on export strength, keeping the full-year target within reach and supporting offshore yuan gains to a four-year high. Greater China equities closed lower amid regulatory scrutiny, yet the currency strength limited imported-cost pressure. The global policy landscape therefore remains one of incremental adjustments rather than synchronized easing or tightening.
Forward Look Centers on Political Milestones
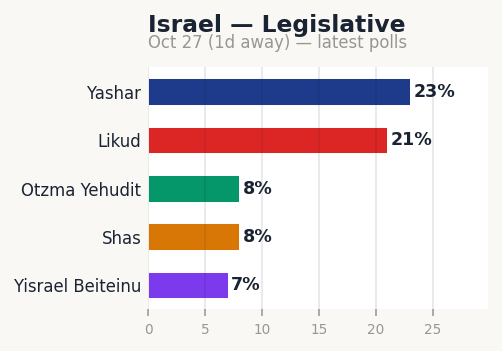
Markets now turn to the Israeli Knesset election on 27 October and the US midterm elections on 3 November. Continued Likud-led coalition policies in Israel emphasize security spending and selective welfare amid coalition budget pressures. The US contests will test administration support across the full House, 33 Senate seats and 36 governorships. We note that both events fall within the next ten days and will shape near-term fiscal and regulatory expectations. Next week’s data releases, including Finnish export and producer prices on 26 October, will provide additional color on Nordic pricing trends ahead of those political outcomes.
| Economy | Real GDP (% y/y) | Consumer Prices (% y/y) | ||||
|---|---|---|---|---|---|---|
| 2026E | 2027E | 2028E | 2026E | 2027E | 2028E | |
| Americas | ||||||
| United States | 2.3 | 2.3 | 2.1 | 3.6 | 2.8 | 2.1 |
| Canada | 1.1 | 1.7 | 1.7 | 2.8 | 2.4 | 2.0 |
| Mexico | 1.5 | 1.8 | 2.2 | 3.8 | 3.6 | 3.1 |
| Brazil | 2.2 | 1.9 | 2.4 | 4.4 | 4.1 | 3.1 |
| Argentina | 2.1 | 3.5 | 4.2 | 32.5 | 21.2 | 14.8 |
| Colombia | 2.2 | 2.3 | 2.4 | 6.0 | 5.7 | 3.9 |
| Chile | 0.6 | 2.6 | 2.4 | 3.7 | 3.5 | 3.0 |
| Peru | 3.0 | 2.9 | 3.2 | 3.8 | 2.6 | 2.1 |
| Asia / Pacific | ||||||
| Japan | 0.7 | 0.7 | 0.6 | 2.0 | 2.6 | 2.0 |
| China | 4.5 | 4.0 | 4.0 | 1.0 | 1.4 | 1.6 |
| India | 7.0 | 7.0 | 6.9 | 5.0 | 4.4 | 3.9 |
| Australia | 1.9 | 1.6 | 1.8 | 3.9 | 3.1 | 2.5 |
| New Zealand | 2.0 | 2.6 | 2.7 | 4.1 | 2.8 | 2.0 |
| South Korea | 3.3 | 2.8 | 2.3 | 2.7 | 2.3 | 2.0 |
| Indonesia | 5.1 | 5.1 | 5.2 | 3.3 | 2.8 | 2.5 |
| Malaysia | 5.2 | 4.6 | 4.3 | 2.2 | 1.9 | 2.0 |
| Philippines | 3.4 | 5.1 | 5.5 | 5.6 | 4.1 | 3.2 |
| Singapore | 5.0 | 3.0 | 2.5 | 2.3 | 2.2 | 2.0 |
| Thailand | 2.1 | 2.1 | 2.3 | 2.1 | 1.7 | 1.5 |
| Taiwan | 10.7 | 4.3 | 3.2 | 2.0 | 1.8 | 1.6 |
| Vietnam | 8.4 | 7.5 | 5.9 | 4.7 | 4.9 | 4.7 |
| Western Europe | ||||||
| Euro area | 1.1 | 1.2 | 1.3 | 3.1 | 2.8 | 2.2 |
| Germany | 1.3 | 1.1 | 1.1 | 2.7 | 3.1 | 2.0 |
| France | 0.4 | 0.7 | 1.2 | 2.4 | 2.2 | 1.9 |
| Italy | 0.8 | 0.6 | 0.7 | 3.3 | 2.8 | 2.3 |
| Spain | 2.5 | 1.8 | 1.8 | 3.7 | 2.7 | 2.5 |
| United Kingdom | 1.3 | 1.2 | 1.6 | 3.3 | 2.8 | 2.0 |
| Sweden | 2.5 | 2.2 | 2.1 | 1.1 | 1.9 | 2.7 |
| Norway | 1.5 | 1.3 | 1.1 | 3.2 | 2.8 | 2.3 |
| Denmark | 3.7 | 2.0 | 1.8 | 1.8 | 2.5 | 2.0 |
| Switzerland | 1.9 | 1.2 | 1.9 | 0.7 | 0.8 | 0.8 |
| Netherlands | 1.5 | 1.3 | 1.4 | 2.9 | 2.8 | 2.6 |
| Poland | 3.4 | 2.5 | 2.5 | 3.2 | 2.8 | 3.9 |
| Czech Republic | 1.8 | 1.9 | 2.2 | 2.1 | 2.8 | 2.7 |
| Hungary | 1.9 | 2.1 | 2.3 | 1.9 | 2.8 | 3.0 |
| Romania | -0.5 | 2.2 | 2.5 | 8.2 | 4.1 | 4.3 |
| EMEA Emerging | ||||||
| Turkey | 2.7 | 3.6 | 4.0 | 31.2 | 26.5 | 20.6 |
| South Africa | 1.0 | 1.3 | 1.5 | 4.4 | 3.9 | 3.3 |
| Israel | 4.5 | 4.4 | 3.6 | 1.8 | 2.0 | 2.0 |
| Saudi Arabia | -3.3 | 7.9 | 4.8 | 1.9 | 2.2 | 2.0 |
| UAE | -3.9 | 7.7 | 7.0 | 4.5 | 2.5 | 2.0 |
| Egypt | 5.1 | 4.7 | 5.0 | 13.3 | 14.8 | 8.9 |
| Nigeria | 4.2 | 4.3 | 4.1 | 15.6 | 14.7 | 13.3 |
| Kenya | 4.5 | 4.7 | 4.9 | 6.0 | 5.0 | 5.3 |
| Global Aggregates | ||||||
| Global | 3.1 | 3.4 | 3.3 | 4.7 | 4.1 | 3.5 |
| Developed markets | 2.1 | 1.8 | 1.7 | 3.1 | 2.7 | 2.1 |
| Emerging markets | 3.7 | 4.4 | 4.3 | 5.7 | 5.1 | 4.4 |
| Central Bank | Instrument | Current Rate |
Last Change |
bp | Next Meeting |
Q1 2026 |
Q2 2026 |
Q3 2026 |
Q4 2026 |
|---|---|---|---|---|---|---|---|---|---|
| The Americas | |||||||||
| Federal Reserve | Fed funds upper | 4.00% | Sep 2026 | +25 | Oct 28 | 3.75 | 3.75 | 4.00 | — |
| Bank of Canada | O/N rate | 2.25% | Oct 2025 | -25 | Oct 28 | 2.25 | 2.25 | 2.25 | — |
| BCB (Brazil) | SELIC | 13.75% | Sep 2026 | -25 | Nov 4 | 14.75 | 14.25 | 13.75 | — |
| Banxico | O/N rate | 6.50% | May 2026 | -25 | Nov 5 | 6.75 | 6.50 | 6.50 | — |
| BCRA (Argentina) | Aggregates regime | — | Jul 2025 | — | — | — | — | — | — |
| BanRep (Colombia) | Repo | 12.25% | Sep 2026 | +25 | Oct 30 | 10.25 | 11.25 | 12.00 | — |
| BCCh (Chile) | MPR | 4.50% | Dec 2025 | -25 | — | 4.50 | 4.50 | 4.50 | — |
| Europe / Africa | |||||||||
| ECB | Depo rate | 2.50% | Sep 2026 | +25 | Oct 29 | 2.00 | 2.25 | 2.50 | — |
| Bank of England | Bank rate | 3.75% | Dec 2025 | -25 | Nov 5 | 3.75 | 3.75 | 3.75 | — |
| Riksbank | Repo rate | 1.75% | Oct 2025 | -25 | Nov 4 | 1.75 | 1.75 | 1.75 | — |
| Norges Bank | Dep rate | 4.50% | Sep 2026 | +25 | Nov 5 | 4.00 | 4.25 | 4.50 | — |
| SNB | Policy rate | 0.00% | Jun 2025 | -25 | Dec 10 | 0.00 | 0.00 | 0.00 | — |
| CNB (Czech) | 2-wk repo | 3.75% | Jun 2026 | +25 | Nov 5 | 3.50 | 3.75 | 3.75 | — |
| NBH (Hungary) | Base rate | 5.50% | Aug 2026 | -25 | Nov 17 | 6.25 | 6.25 | 5.50 | — |
| NBP (Poland) | Ref rate | 3.75% | Mar 2026 | -25 | — | 3.75 | 3.75 | 3.75 | — |
| SARB | Repo rate | 7.25% | Sep 2026 | +25 | Nov 19 | 6.75 | 7.00 | 7.25 | — |
| CBRT (Turkey) | 1-wk repo | 37.00% | Jan 2026 | -100 | Dec 10 | 37.00 | 37.00 | 37.00 | — |
| Asia / Pacific | |||||||||
| RBA | Cash rate | 4.60% | Sep 2026 | +25 | Nov 3 | 4.10 | 4.35 | 4.60 | — |
| RBNZ | OCR | 2.75% | Sep 2026 | +25 | Oct 28 | 2.25 | 2.25 | 2.75 | — |
| BoJ | Pol rate | 1.25% | Sep 2026 | +25 | Oct 30 | 0.75 | 1.00 | 1.25 | — |
| PBoC | 1-yr LPR | 3.00% | — | — | — | 3.00 | 3.00 | 3.00 | — |
| RBI (India) | Repo rate | 5.25% | Dec 2025 | -25 | — | 5.25 | 5.25 | 5.25 | — |
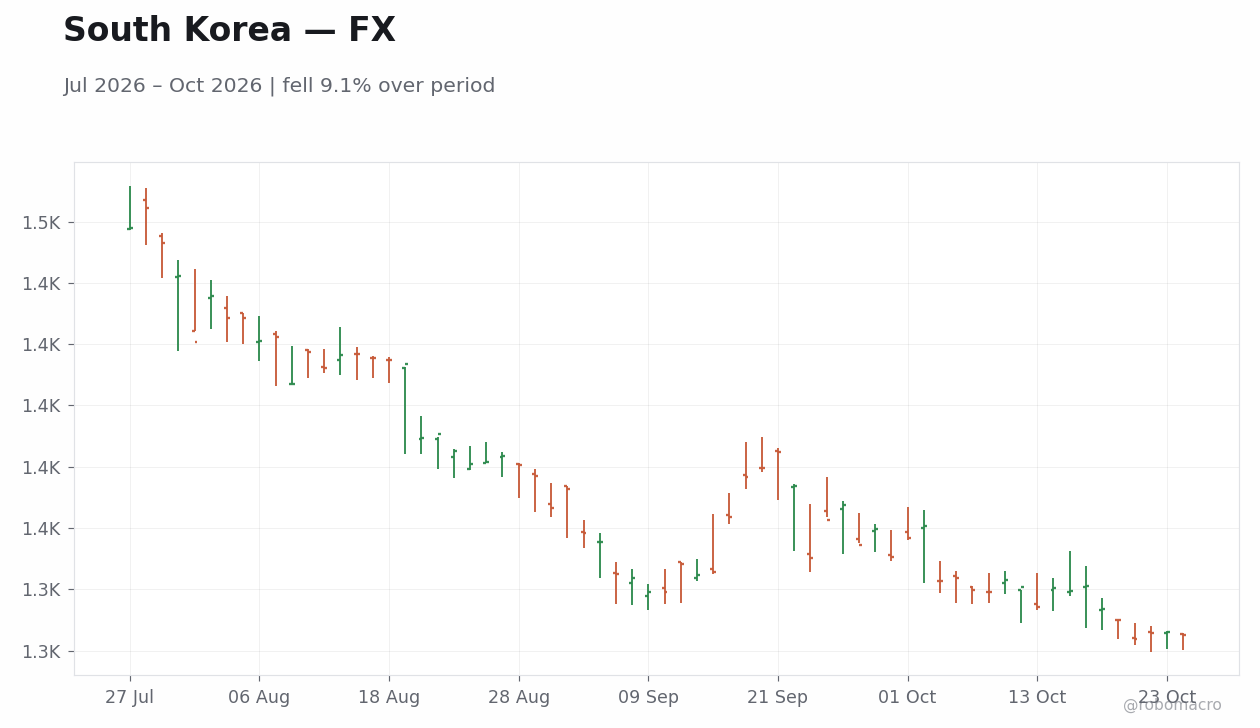
| BoK (Korea) | Base rate | 3.00% | Aug 2026 | +25 | — | 2.50 | 2.50 | 3.00 | — |
| BI (Indonesia) | BI-Rate | 5.75% | Jun 2026 | +25 | Nov 18 | 4.75 | 5.75 | 5.75 | — |
| BSP (Philippines) | Rev repo | 5.00% | Aug 2026 | +25 | — | 4.25 | 4.75 | 5.00 | — |
| BoT (Thailand) | 1-day repo | 1.00% | Feb 2026 | -25 | Oct 28 | 1.00 | 1.00 | 1.00 | — |
| CBC (Taiwan) | Disc rate | 2.00% | Mar 2024 | +12.5 | — | — | — | — | — |
| MAS (Singapore) | SGD NEER | Mild appr. | Apr 2026 | slope+ | — | — | — | — | — |
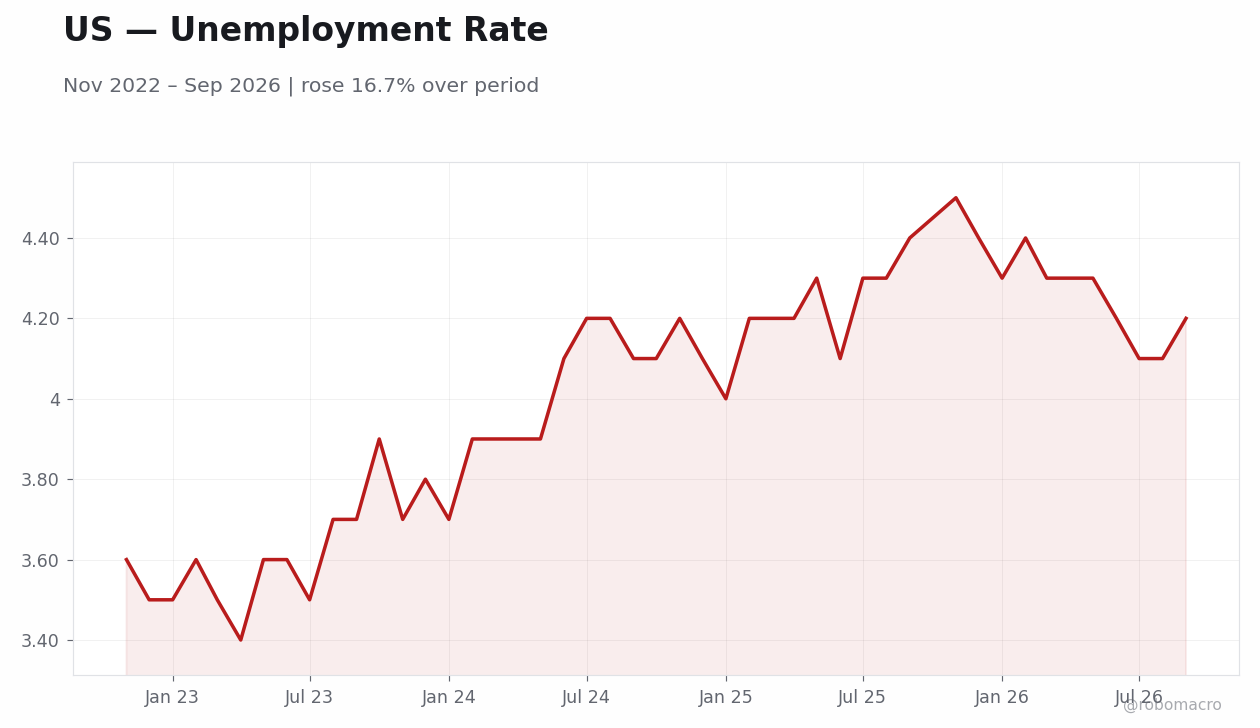
| Nonfarm Payrolls (m/m) | +72k | 80% CI +16k…+299k |
| Unemployment Rate | 4.2% | |
| Avg Hourly Earnings (y/y) | 3.2% |
| Economy | Activity Index | 4-wk Δ | 13-wk Δ | Week ending | Indicators | Signal |
|---|---|---|---|---|---|---|
| United States | 63.4 | +2.1 | +11.0 | 2026-10-16 | 7/7 | Expanding · Advancing |
| Brazil | 62.6 | -6.7 | +4.2 | 2026-10-23 | 3/4 | Expanding · Retreating |
| Germany | 62.5 | +15.3 | +18.8 | 2026-10-23 | 5/6 | Expanding · Advancing |
| Canada | 61.3 | +5.5 | -1.2 | 2026-10-16 | 5/8 | Expanding · Advancing |
| Australia | 52.1 | +4.3 | +5.0 | 2026-10-16 | 3/3 | Expanding · Advancing |
| Poland | 52.0 | -10.0 | +4.6 | 2026-10-23 | 3/4 | Expanding · Retreating |
| Japan | 47.0 | +2.9 | -14.2 | 2026-10-16 | 3/5 | Contracting · Advancing |
| Euro Area | 45.0 | -3.2 | -5.8 | 2026-10-16 | 5/5 | Contracting · Retreating |
| Spain | 43.3 | -4.8 | -19.4 | 2026-10-16 | 5/5 | Contracting · Retreating |
| Italy | 41.7 | -10.9 | -14.9 | 2026-10-16 | 5/5 | Contracting · Retreating |
| France | 37.5 | -4.0 | -11.4 | 2026-10-16 | 4/5 | Contracting · Retreating |
| New Zealand | 35.6 | +4.4 | -11.1 | 2026-10-16 | 4/5 | Contracting · Advancing |
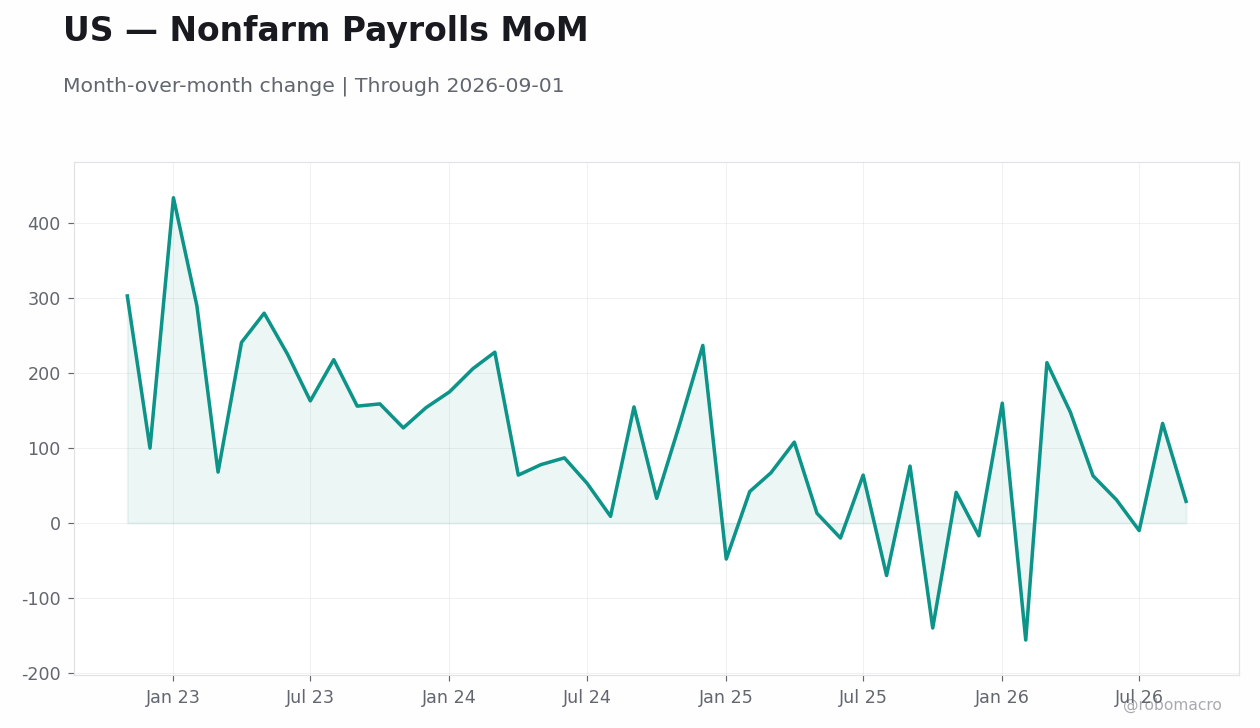
Activity remains in expansion in United States, Germany, Canada, Brazil, Australia, Poland; while high-frequency trackers point to sub-trend activity in Euro Area, France, Italy, Spain, Japan, New Zealand. On a 4-week basis, momentum is improving in United States, Germany, Japan, Canada, Australia, New Zealand and cooling in Euro Area, France, Italy, Spain, Brazil, Poland. RoboMacro's labor ensemble nowcasts the next US payrolls print at +72k.


Week in Review
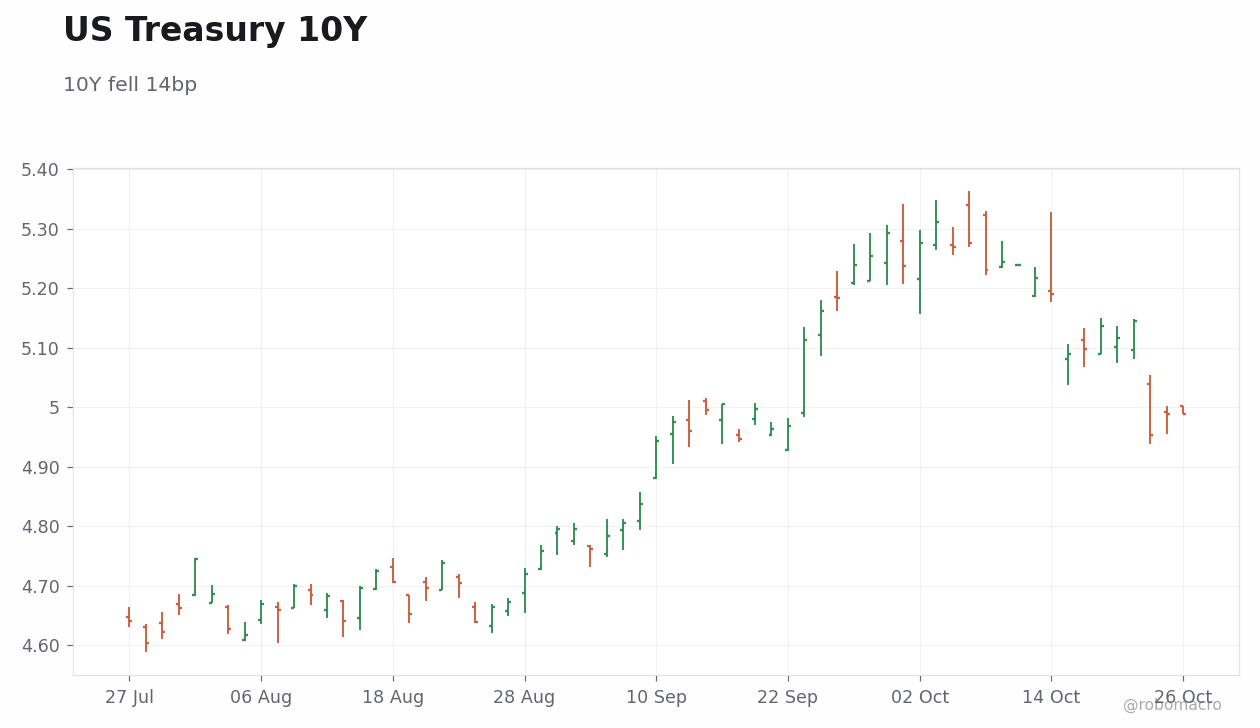
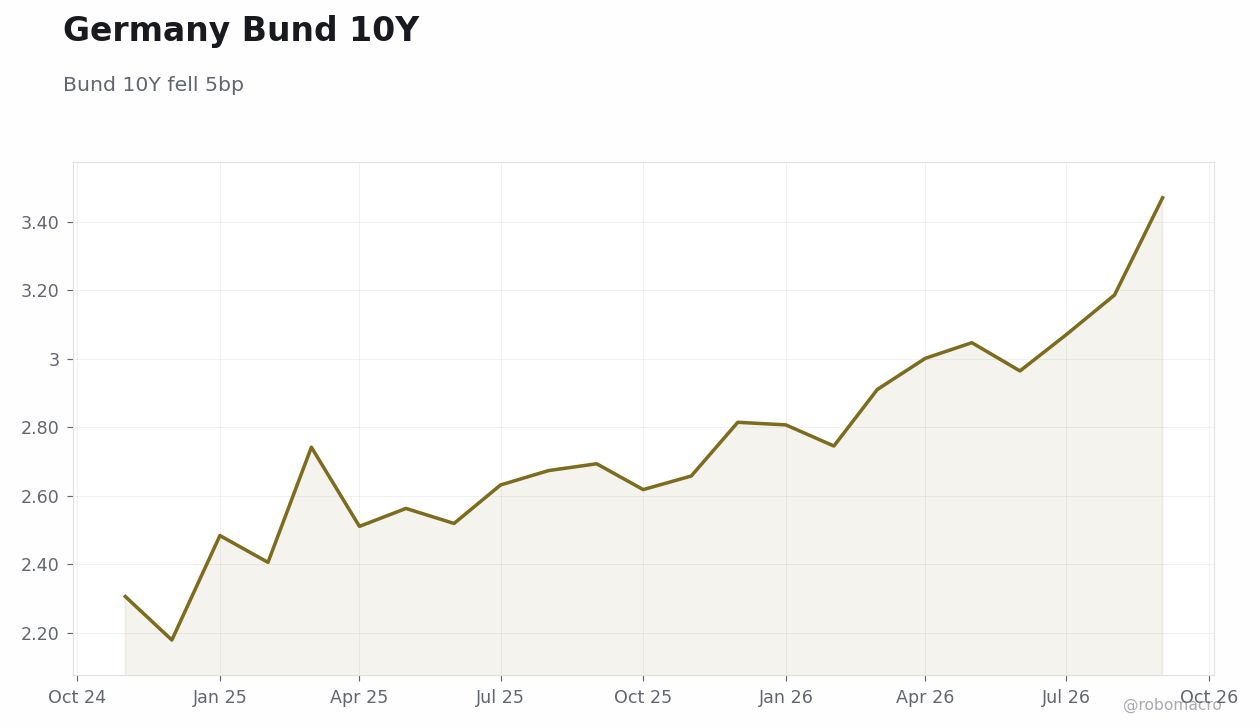
US 10-year yields fell 14bp to 4.96%. The US 10Y yield rose from 5.1170 on Tuesday to 5.1460 on Wednesday before declining sharply to 4.9530 on Thursday, closing at 4.9880 on Friday and 4.9860 on Monday. German 10-year yields declined 5bp to 3.36%. UK 10-year gilt yields fell 1bp to 5.37%. Japanese 10-year yields fell 14bp to 2.80%. US 30-year yields fell 14bp to 5.29%.
Curve & Spreads
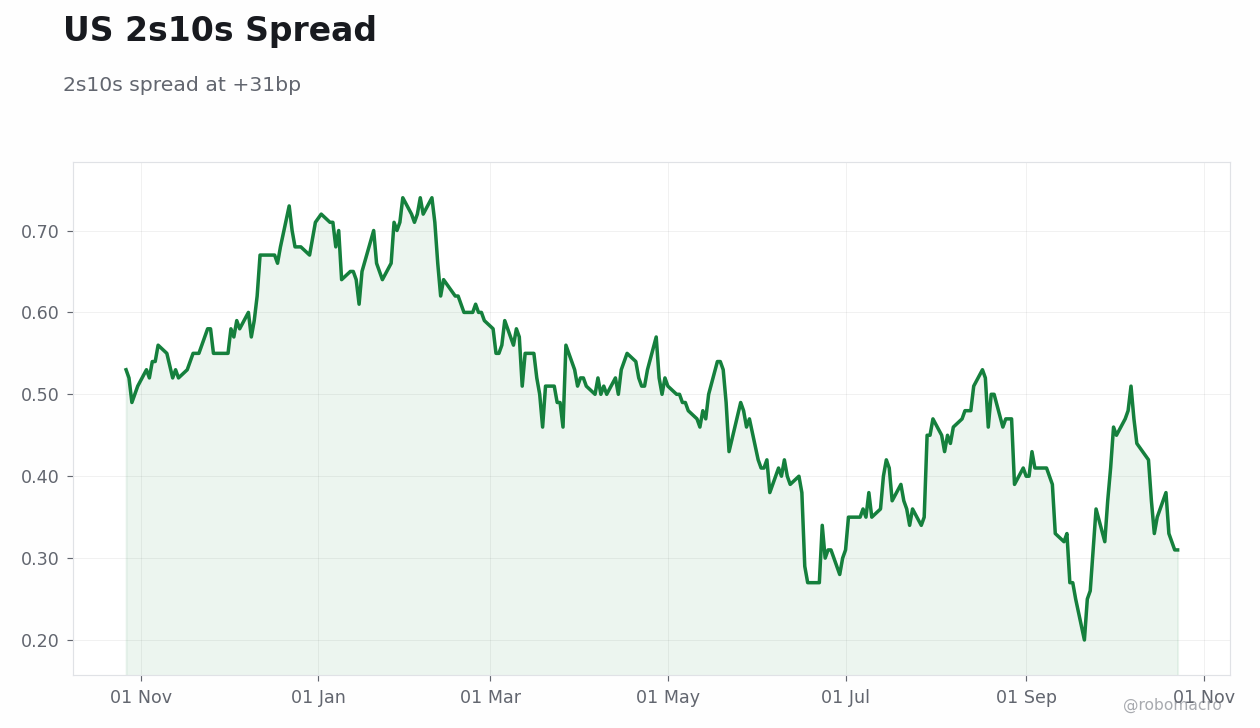
The US 2s10s stood at +31bp, equal to Germany’s +31bp while the UK 2s10s stood at +44bp. These steep curves across the US, Germany, and UK reflect a consistent positive shape. The curve shape implies firmer growth expectations directionally.
EM Bonds
Turkey’s 10-year yield stood at 35.84% while its 2-year yield moved significantly lower. Brazil 10-year yields stood at 12.99%, South Africa’s 10-year at 8.79%, and Indonesia’s 10-year at 7.45%. These EM yield levels remain multiples higher than DM counterparts such as the US 10Y at 4.96% and German 10Y at 3.36%. The spread differential between EM and DM therefore stayed materially wide.
Central Bank Read
The curve shape with US and German 2s10s both at +31bp implies an easing bias as back-end yields fell at least as much as front-end levels. In the UK the 2Y rose 20bp to 4.93% while the 10Y fell 1bp to 5.37%, pointing to a tightening bias at the front end. Japan’s back-end outperformance, with the 30Y falling 17bp to 3.83% versus the 2Y decline of 5bp to 1.86%, reinforces an easing bias. Front-end versus back-end moves across these markets signal differing policy tilts. Overall the curves imply varied central bank directionality consistent with incoming data.
Week Ahead
The week ahead brings CPI inflation prints, payrolls data, and central bank meetings that will be watched for their bearing on duration risk. These releases matter most because they will update growth and policy expectations. Treasury auctions will also absorb focus as investors calibrate positioning after the week’s yield moves.
| Country | 2Y | 2Y WoW | 10Y | 10Y WoW | 30Y | 30Y WoW | 2s10s |
|---|---|---|---|---|---|---|---|
| United States | 4.65% | -12bp | 4.96% | -14bp | 5.29% | -14bp | +31bp |
| United Kingdom | 4.93% | +20bp | 5.37% | -1bp | 5.73% | -13bp | +44bp |
| Germany | 3.04% | -2bp | 3.36% | -5bp | 3.68% | -10bp | +31bp |
| France | 3.79% | +23bp | 5.04% | +25bp | 5.50% | +14bp | +125bp |
| Italy | 3.53% | +8bp | 4.59% | +11bp | 5.13% | +2bp | +106bp |
| Spain | 3.25% | +4bp | 4.05% | +0bp | 4.54% | -2bp | +80bp |
| Japan | 1.86% | -5bp | 2.80% | -14bp | 3.83% | -17bp | +93bp |
| Canada | 3.36% | +16bp | 3.85% | +2bp | 4.14% | -4bp | +49bp |
| Australia | 4.94% | +5bp | 5.21% | -4bp | 5.60% | -9bp | +27bp |
| China | 1.24% | +2bp | 1.65% | -1bp | 2.08% | +1bp | +41bp |
| India | 6.85% | +13bp | 7.47% | +11bp | 7.89% | +10bp | +62bp |
| Brazil | 12.79% | -5bp | 12.99% | -10bp | — | — | +20bp |
| Mexico | — | — | 9.31% | +1bp | — | — | — |
| South Korea | 3.76% | -7bp | 4.09% | -10bp | 4.19% | -7bp | +34bp |
| Indonesia | — | — | 7.45% | +28bp | 7.45% | +9bp | — |
| Turkey | 36.53% | -314bp | 35.84% | +4bp | — | — | -69bp |
| South Africa | — | — | 8.79% | -7bp | 9.07% | -10bp | — |
| Poland | — | — | 6.43% | +10bp | — | — | — |
US Treasury yields declined across the curve, with the 2-year falling 12bp to 4.65%, the 10-year dropping 14bp to 4.96%, and the 30-year also down 14bp to 5.29%. France posted the largest gains among developed markets, as the 2-year rose 23bp to 3.79% and the 10-year jumped 25bp to 5.04%. Turkey’s 2-year yield plunged 314bp to 36.53%, while the UK 2-year climbed 20bp to 4.93%. Japan’s 30-year eased 17bp to 3.83%, and Canada’s 2-year rose 16bp to 3.36%. Steepening was most pronounced in France, where the 2s10s reached +125bp, and Italy, at +106bp. Germany’s 10-year fell 5bp to 3.36%, diverging from French moves. Brazil’s 10-year declined 10bp to 12.99%. Next week’s data releases and auctions will set the tone for further curve shifts.


Week in Review
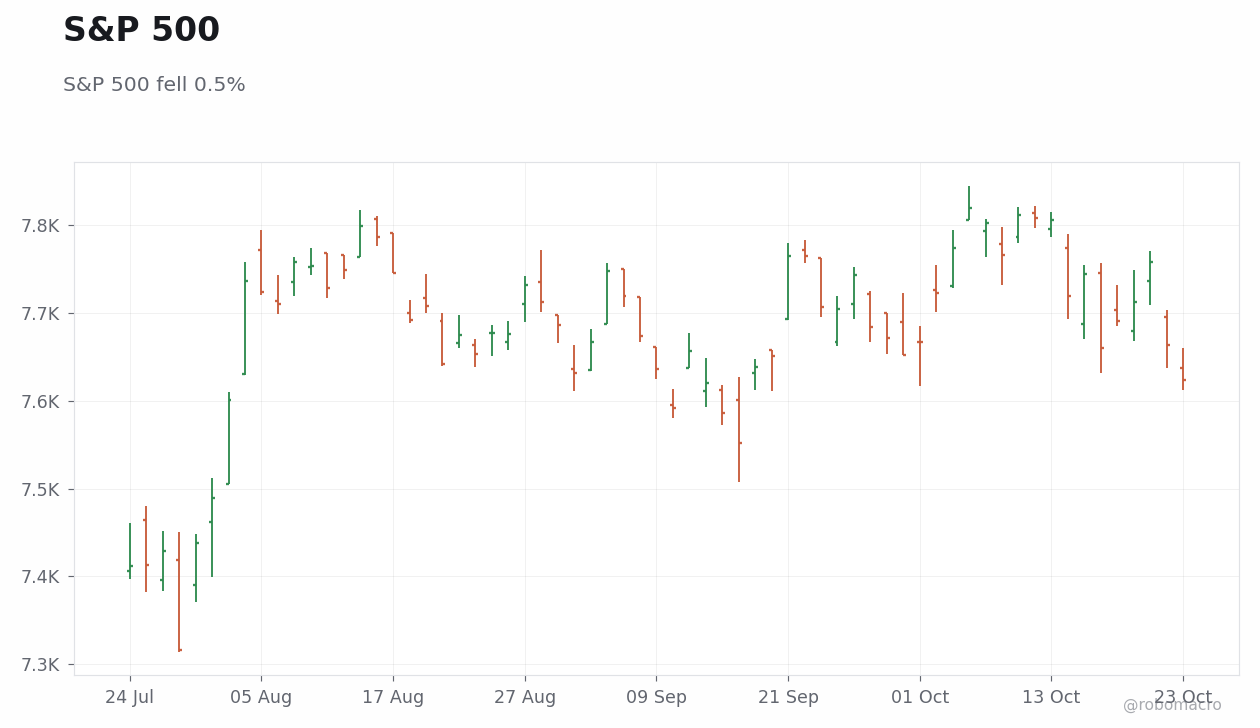
The S&P 500 declined 0.5% week-over-week to close at 7,624. The index rose from Monday's close of 7,691 to Tuesday's 7,713 and Wednesday's peak of 7,757 before selling off to Thursday's 7,663 and Friday's 7,624. In Europe the Euro Stoxx 50 fell 0.6% to end at 6,109 after advancing to 6,208 midweek and then declining to 6,068. The DAX gained 0.4% to 25,429 while the FTSE 100 slipped 0.2% to 10,738. Asian equities lagged with the Nikkei 225 dropping 4.2% to 62,190 after sliding from Wednesday's 64,621 through Friday's 62,693. Emerging markets were mixed as the IPC Mexico rose 1.4% to 69,880 while the Hang Seng fell 2.8% to 23,212 and KOSPI dropped 5.2% to 5,469.
Regional Divergences
Regional performance diverged sharply across global equity markets. The US saw the Dow Jones rise 0.4% while the S&P 500 fell 0.5% and Nasdaq 100 declined 0.8%. European indices split with the DAX up 0.4% against the Euro Stoxx 50's 0.6% decline and CAC 40's 0.2% drop. Asia Pacific underperformed markedly with the Nikkei 225 down 4.2% and Hang Seng down 2.8%. Emerging markets showed resilience in Latin America where the IPC Mexico gained 1.4% and Ibovespa fell only 0.2%, contrasting steeper losses elsewhere. These moves aligned with macro catalysts including hawkish policy signals in Japan, political and energy pressures in Europe, election focus in Brazil, and mixed commodity performance.
Volatility & Risk Appetite
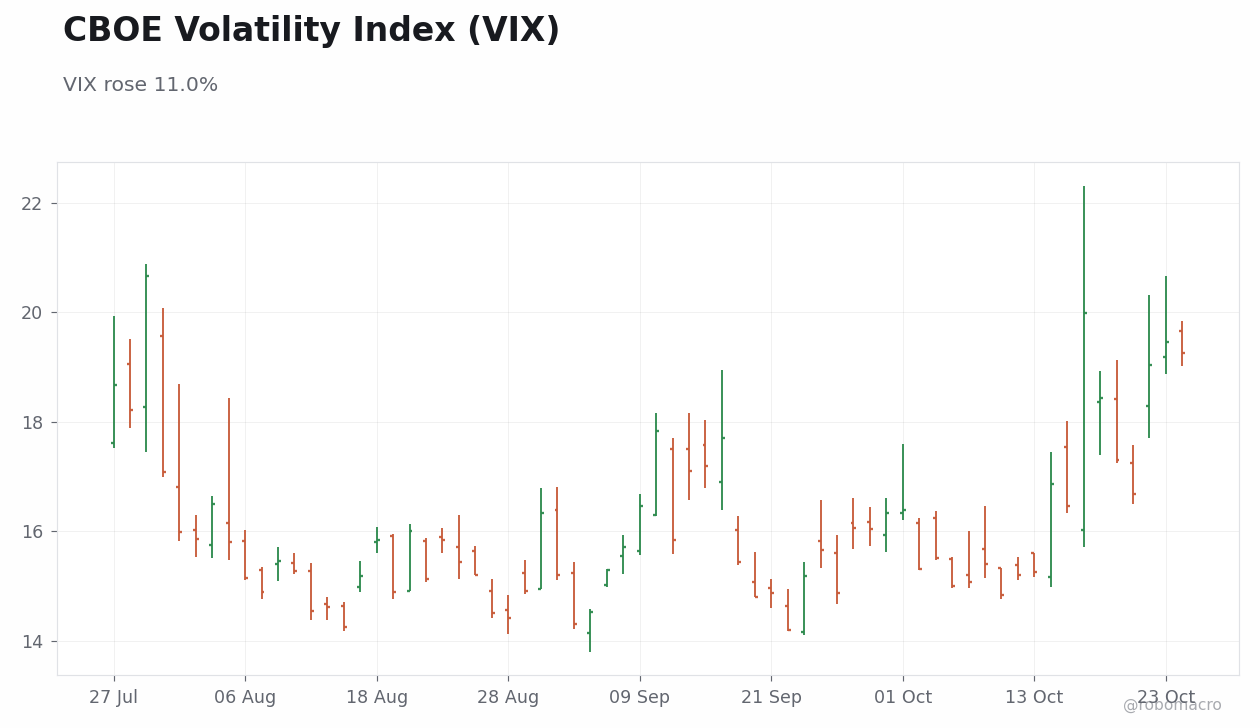
The VIX closed at 19.2 after rising from 16.7 to 19.5 late in the week. Growth underperformed value as the Nasdaq 100 fell 0.8% versus the Dow Jones gain of 0.4%. Small caps outperformed large caps with the Russell 2000 rising 2.0% against the S&P 500's 0.5% decline. Commodity signals were mixed with WTI Crude falling 2.3% to 101.25 while Brent Crude rose 0.6% to 110.25, and sharp declines in gold to 4029.70 and silver to 53.98 indicated reduced safe-haven demand. US yields fell with the 10Y reaching 4.96% and the 2s10s standing at +31bp, while similar easing occurred in Germany and Japan, supporting selective risk appetite in small caps and value.
Week Ahead
With the economic calendar next week providing no major scheduled releases, equity markets face limited fresh catalysts from CPI, payrolls, central bank meetings, PMI releases or GDP prints. This light schedule shifts focus to ongoing corporate earnings reports and any follow-through from recent policy communications. Markets will remain sensitive to developments that could alter growth or inflation expectations, with hotter-than-expected data favoring risk-off moves. Overall the period is likely to see range-bound trading unless external news disrupts sentiment.
| Index | Level | WoW | MTD | YTD |
|---|---|---|---|---|
| S&P 500 | 7,624 | -0.5% | -0.6% | +11.2% |
| Nasdaq 100 | 28,958 | -0.8% | -5.1% | +14.9% |
| Dow Jones | 52,215 | +0.4% | +2.5% | +7.9% |
| Russell 2000 | 2,776 | +2.0% | -1.1% | +10.7% |
| S&P/TSX | 35,788 | -1.1% | +1.8% | +12.2% |
| FTSE 100 | 10,738 | -0.2% | +3.0% | +7.9% |
| Euro Stoxx 50 | 6,109 | -0.6% | -1.1% | +3.1% |
| DAX | 25,429 | +0.4% | +2.0% | +3.6% |
| CAC 40 | 7,851 | -0.2% | +0.2% | -4.2% |
| FTSE MIB | 49,096 | +0.0% | -2.3% | +8.2% |
| IBEX 35 | 18,983 | -0.3% | -0.1% | +8.5% |
| Nikkei 225 | 62,190 | -4.2% | -9.8% | +20.0% |
| Hang Seng | 23,212 | -2.8% | -3.2% | -11.9% |
| S&P/ASX 200 | 8,810 | -0.4% | +2.3% | +0.9% |
| KOSPI | 5,469 | -5.2% | -21.5% | +26.9% |
| Nifty 50 | 22,753 | -0.6% | +1.5% | -13.0% |
| Ibovespa | 205,083 | -0.2% | +9.6% | +27.8% |
| IPC Mexico | 69,880 | +1.4% | +9.5% | +8.9% |
| JSE Top 40 | 101,175 | -0.1% | +1.0% | -6.5% |
US equities diverged, with the Russell 2000 gaining 2.0% as the Nasdaq 100 fell 0.8% and the S&P 500 slipped 0.5% to 7,624. The Dow Jones rose 0.4%. Asia led declines as the KOSPI dropped 5.2% and the Nikkei 225 fell 4.2% to 62,190, while the Hang Seng lost 2.8%. Europe was mixed, the DAX adding 0.4% against a 0.6% decline in the Euro Stoxx 50. Latin America outperformed, with the IPC Mexico up 1.4% and the Ibovespa rising 27.8% year-to-date. Next week, markets will focus on US and European inflation prints plus Q3 earnings from major tech names.
| Index | WoW | MTD | YTD |
|---|---|---|---|
| S&P 500 | -0.5% | -0.6% | +11.2% |
| Nasdaq 100 | -0.8% | -5.1% | +14.9% |
| Dow Jones | +0.4% | +2.5% | +7.9% |
| Russell 2000 | +2.0% | -1.1% | +10.7% |
| S&P/TSX | -1.1% | +1.8% | +12.2% |
| FTSE 100 | -0.2% | +3.0% | +7.9% |
| Euro Stoxx 50 | -0.6% | -1.1% | +3.1% |
| DAX | +0.4% | +2.0% | +3.6% |
| CAC 40 | -0.2% | +0.2% | -4.2% |
| FTSE MIB | +0.0% | -2.3% | +8.2% |
| IBEX 35 | -0.3% | -0.1% | +8.5% |
| Nikkei 225 | -4.2% | -9.8% | +20.0% |
| Hang Seng | -2.8% | -3.2% | -11.9% |
| S&P/ASX 200 | -0.4% | +2.3% | +0.9% |
| KOSPI | -5.2% | -21.5% | +26.9% |
| Nifty 50 | -0.6% | +1.5% | -13.0% |
| Ibovespa | -0.2% | +9.6% | +27.8% |
| IPC Mexico | +1.4% | +9.5% | +8.9% |
| JSE Top 40 | -0.1% | +1.0% | -6.5% |


Week in Review
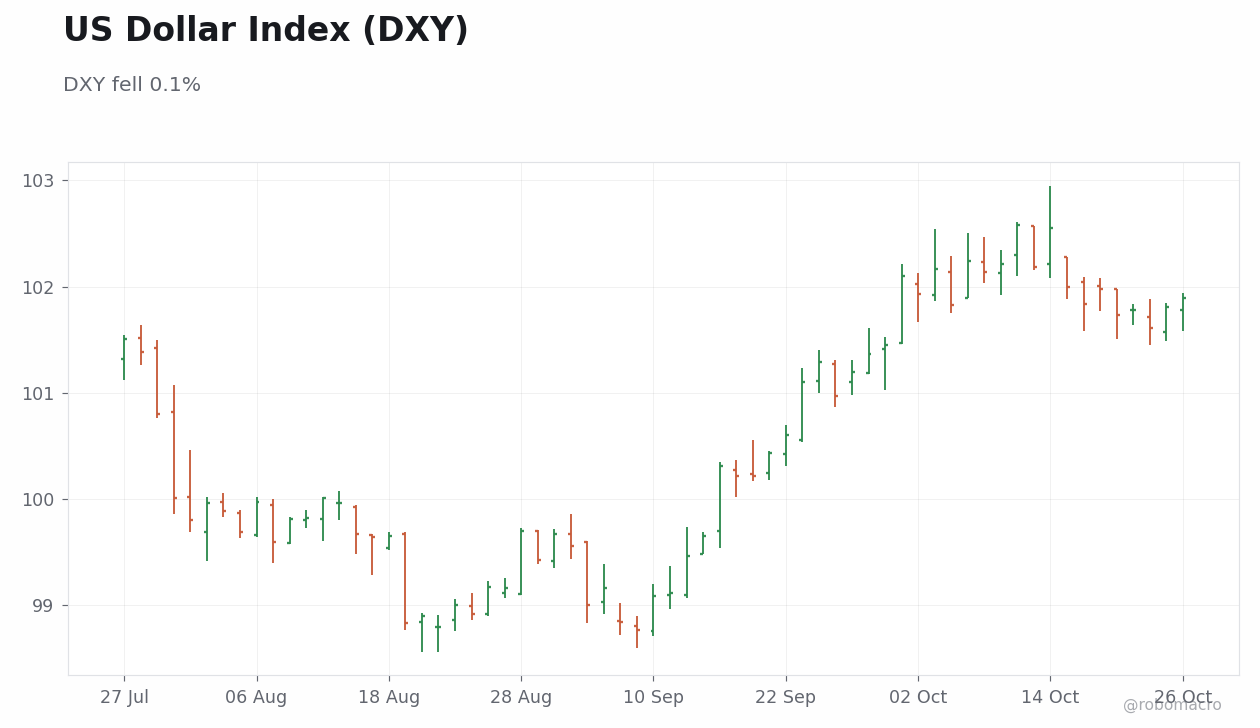
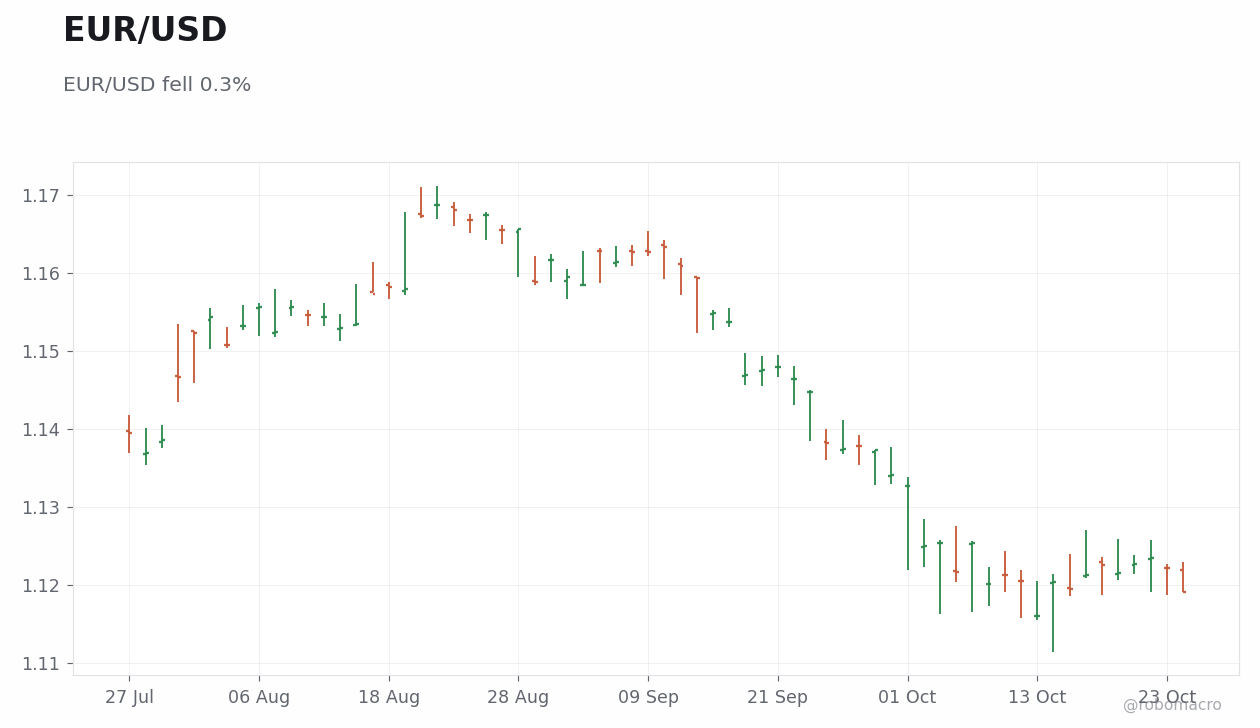
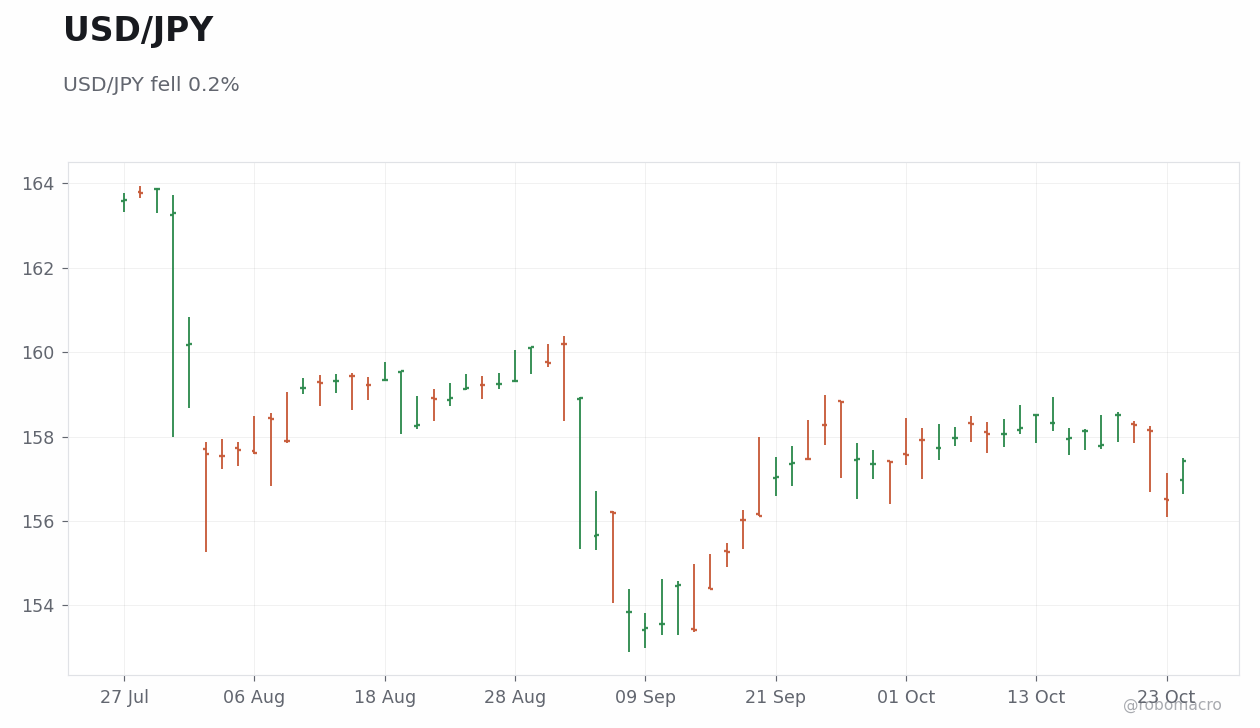
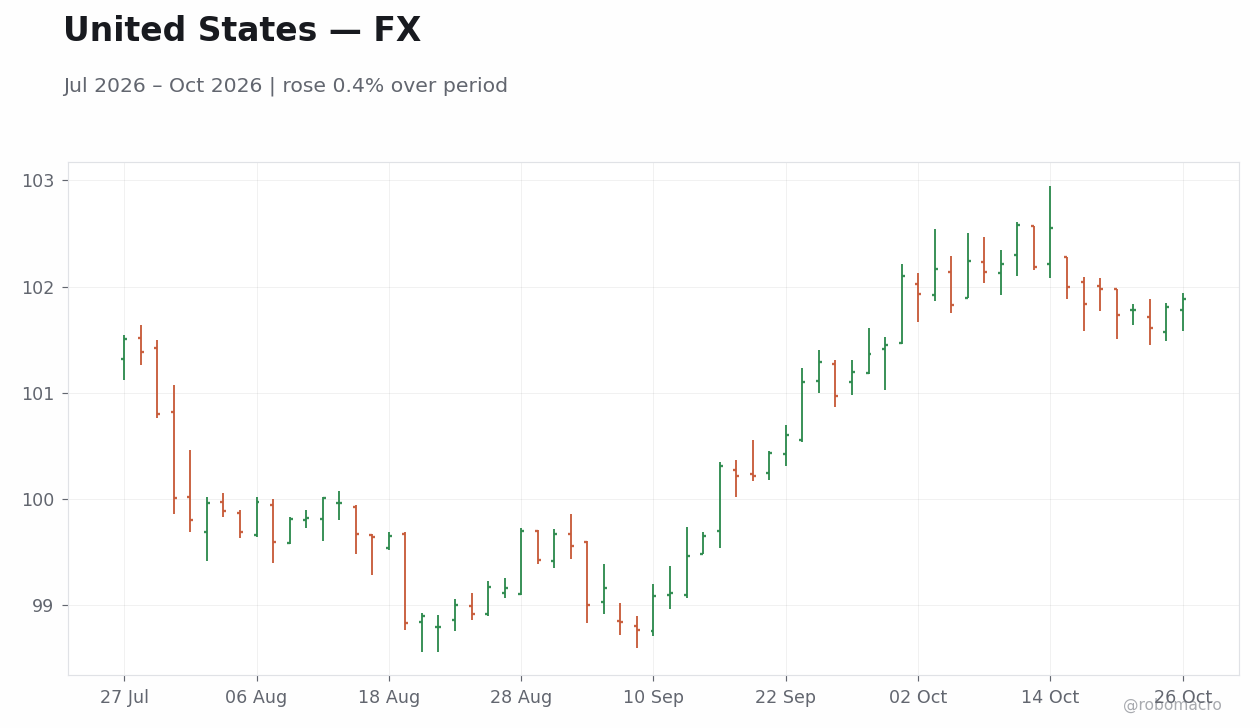
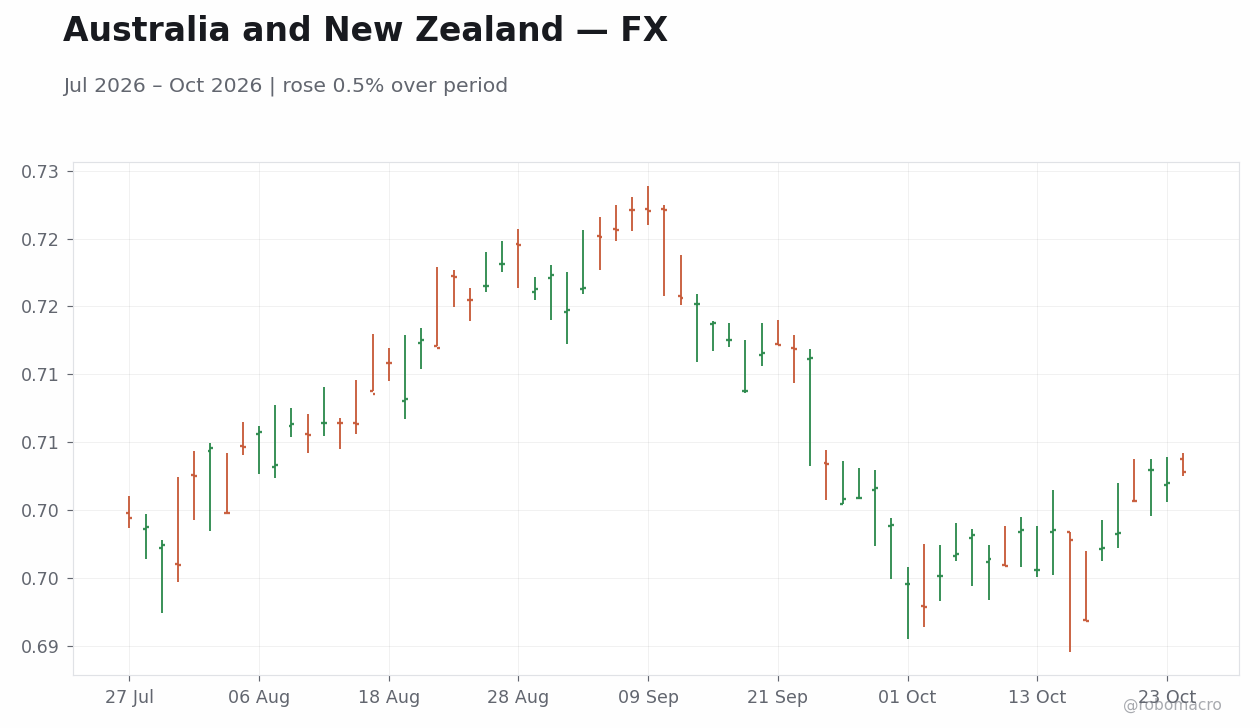
The DXY fell 0.1% week-over-week to 101.89. It held steady at 102 in daily closes from Wednesday through Monday. In G10 FX, EUR/USD fell 0.3% to 1.1192 after rising from 1.1216 on Tuesday to 1.1235 on Thursday before reversing to 1.1191 on Monday. GBP/USD rose 0.1% to 1.3350, climbing as high as 1.3404 on Friday prior to a modest pullback. USD/JPY eased 0.2% to 157.42, moving from 159 on Tuesday down to 156 on Friday before settling at 157 on Monday, while AUD/USD gained 0.8% to 0.7027 and NZD/USD rose 0.4% to 0.5683. EM pairs diverged with USD/BRL falling 1.3% to 4.9993, USD/MXN rising 0.9% to 18.61, USD/ZAR increasing 1.0% to 16.63, USD/TRY gaining 0.5% to 49.76, and USD/CNY declining 0.5% to 6.6565.
Dollar & G10
U.S. yields declined across the curve while front-end rates rose in parts of Europe and the UK, producing shifts in rate differentials that left the dollar little changed overall. These adjustments occurred against a backdrop of resilient growth signals and mixed inflation pressures that kept policy expectations firm in certain regions. EUR/USD closed at 1.1192 after a 0.3% weekly decline. GBP/USD ended at 1.3350, up 0.1% on the week. USD/JPY finished at 157.42, down 0.2%, as Japanese officials continued to signal readiness for further policy adjustment.
EM FX
EM FX moves were driven by commodity trends and evolving bond yield differentials across regions. USD/BRL fell 1.3% to 4.9993, reflecting real strength after the presidential outcome shifted focus to fiscal execution. USD/MXN rose 0.9% to 18.61 even as domestic duration demand persisted. USD/ZAR advanced 1.0% to 16.63 while USD/TRY gained 0.5% to 49.76, both showing weakness amid higher local rates and term premium repricing. USD/CNY declined 0.5% to 6.6565, highlighting relative outperformance tied to stable yield differentials in Asia.
Bitcoin & Crypto
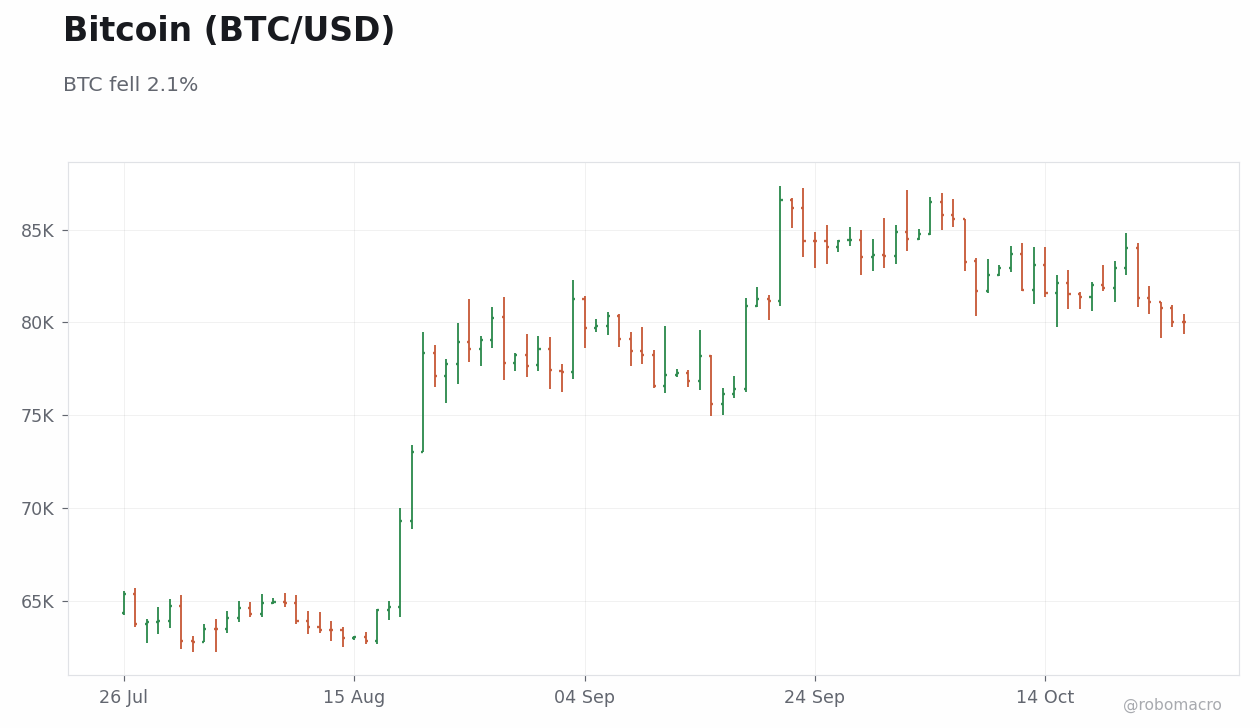
Bitcoin fell 2.1% week-over-week to $80,141. Daily closes traced a steady decline from 81,312 on Thursday to 81,074 on Friday, 80,791 on Saturday, and 80,026 on Monday. Ethereum dropped 3.6% to $2,317, Solana fell 3.5% to $101, and XRP declined 0.7% to $1. Broad risk sentiment weighed on digital assets even as prominent investors positioned for potential further upside in the sector’s standout performer.
Week Ahead
The economic calendar is light with no major central bank rate decisions scheduled. CPI releases from key economies could still influence rate differential expectations and FX positioning. Trade balance data may affect select EM currencies. Crypto markets will track ongoing narrative momentum without specific regulatory events or ETF deadlines noted.


Week in Review
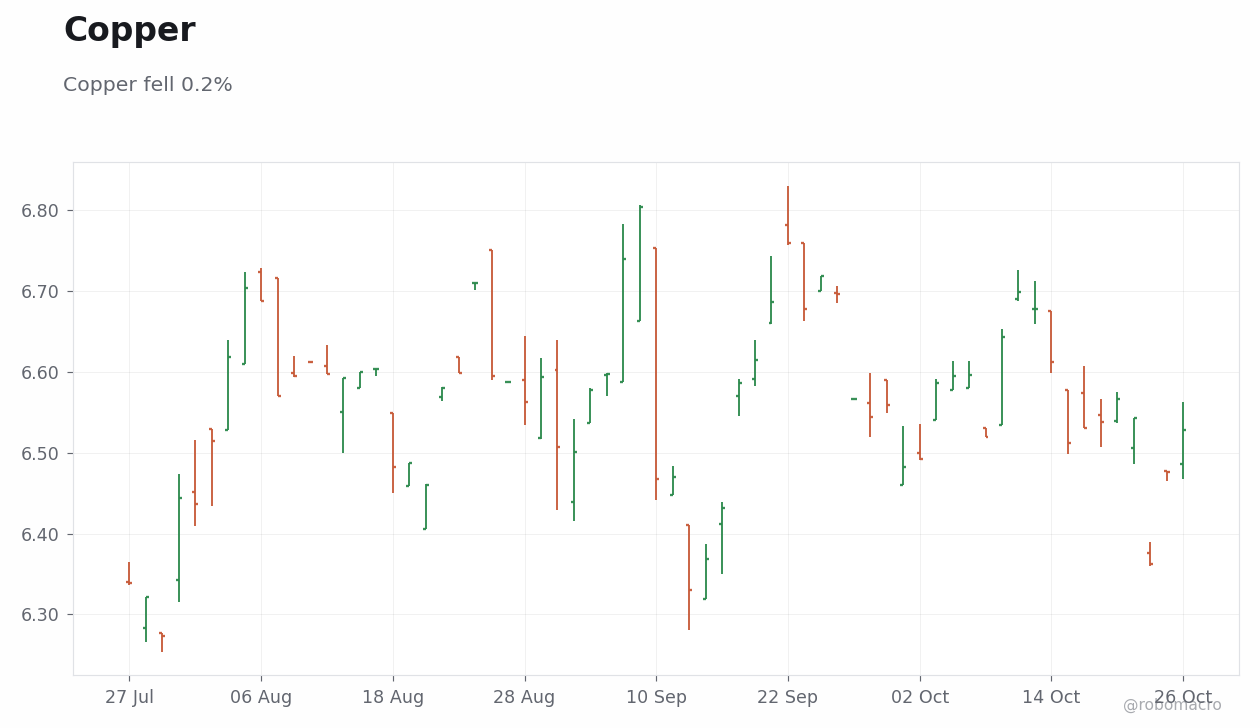
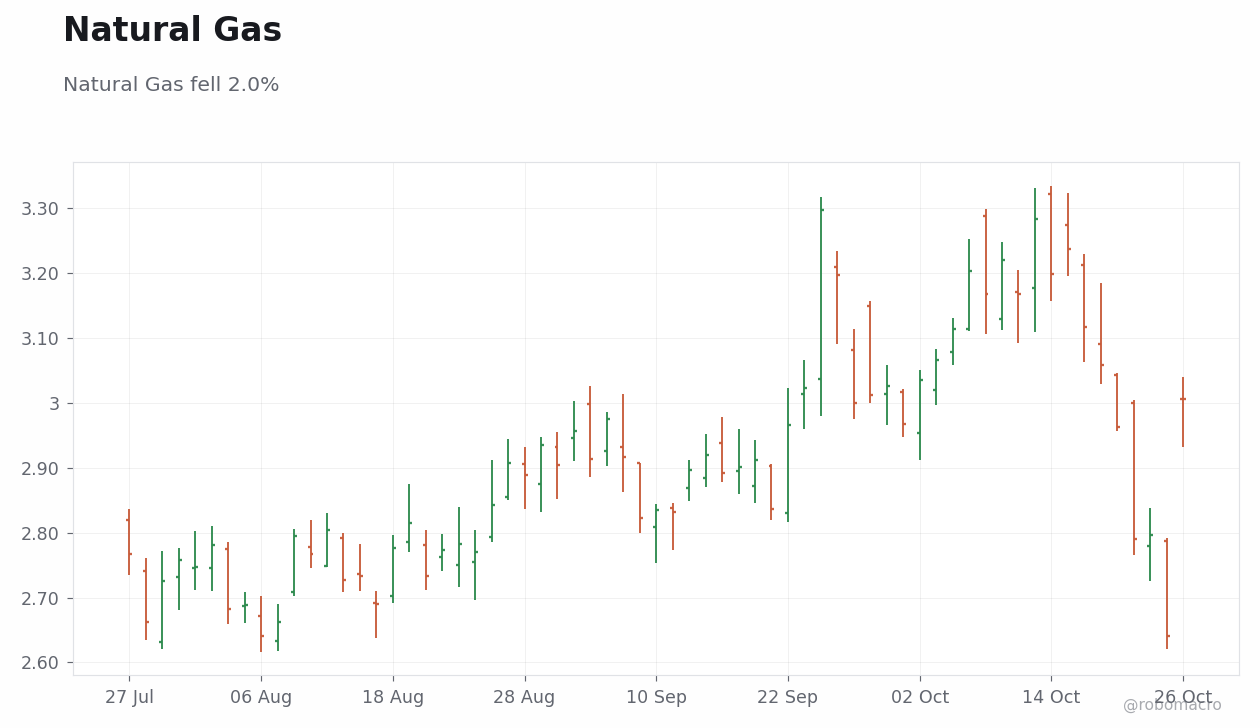
Silver was the biggest mover, declining 5.3% week-over-week to 53.98. Gold fell 3.1% to 4029.70 while copper declined 0.2% to 6.52 and wheat dropped 4.7% to 624.50. In the energy complex WTI crude fell 2.3% to 101.25 while Brent crude rose 0.6% to 110.25 and natural gas declined 2.0% to 3.00. Daily closes showed WTI crude rising from 97.2 on Wednesday to 99.5 on Thursday and 103 on Friday before settling at 101 on Monday. Gold prices moved from 4,150 on Wednesday to 4,060 on Thursday then 4,008 on Friday before closing at 4,029 on Monday while silver fell from 57.4 on Wednesday to 54.8 on Thursday and 53.7 on Friday before ending at 54.0 on Monday. Natural gas dropped to 2.6400 on Friday before rebounding to 3.0050 on Monday, illustrating continued volatility across the complex.
Energy Complex
WTI crude settled at 101.25 after falling 2.3% while Brent crude rose 0.6% to 110.25. Natural gas closed at 3.00 after a 2.0% weekly decline. Oil markets braced for renewed Iran fighting as risks of renewed fighting between the US, Israel and Iran rose, helping keep oil prices elevated. The geopolitical backdrop continued to provide a floor even as selective profit taking appeared after the mid-week rally in WTI crude. Divergence between the two crude benchmarks reflected differing regional supply considerations amid ongoing OPEC+ management of output levels.
Metals & Ags
Gold ended at 4029.70 after declining 3.1% while silver fell 5.3% to 53.98, pushing the gold-silver ratio higher. Copper traded at 6.52 after a modest 0.2% weekly decline but posted a 0.6% gain month-to-date, acting as a muted positive signal for global growth. Wheat fell 4.7% to 624.50 as agricultural markets saw broad retreat. The metals complex reflected reduced safe-haven demand even as longer-term narratives around political uncertainty and industrial output remained in focus. Copper’s relative resilience stood out against sharper losses in precious metals and grains, consistent with selective demand for industrial exposure.
Week Ahead
The economic calendar for next week is light on commodity-relevant events, with no EIA crude or gas inventories, OPEC meetings, China PMI or industrial data, US CPI releases, or central bank meetings affecting commodity currencies such as the Canadian dollar, Australian dollar or Brazilian real scheduled. In the absence of scheduled releases, focus shifts to non-calendar risks including geopolitical developments, weather patterns for agriculture, and OPEC diplomacy. Participants will monitor any fresh signals on industrial activity and supply responses that could influence copper and crude positioning in the near term.
| Pair | Level | WoW | MTD | YTD |
|---|---|---|---|---|
| DXY | 101.89 | -0.1% | -0.2% | +3.5% |
| EUR/USD | 1.1192 | -0.3% | -1.2% | -4.8% |
| GBP/USD | 1.3350 | +0.1% | +0.6% | -0.9% |
| USD/JPY | 157.42 | -0.2% | -0.1% | +0.4% |
| AUD/USD | 0.7027 | +0.8% | +1.2% | +5.2% |
| NZD/USD | 0.5683 | +0.4% | +0.9% | -1.3% |
| USD/CAD | 1.4028 | -0.7% | -1.5% | +2.3% |
| USD/CHF | 0.8262 | +0.3% | -1.1% | +4.3% |
| USD/CNY | 6.6565 | -0.5% | -0.7% | -4.8% |
| USD/BRL | 4.9993 | -1.3% | -3.5% | -9.4% |
| USD/MXN | 18.61 | +0.9% | +2.9% | +3.5% |
| USD/INR | 95.21 | +0.2% | -0.8% | +5.8% |
| USD/ZAR | 16.63 | +1.0% | +1.3% | +0.5% |
| USD/TRY | 49.76 | +0.5% | +1.5% | +15.7% |
| Commodity | Level | WoW | MTD | YTD |
|---|---|---|---|---|
| WTI Crude | 101.25 | -2.3% | +9.0% | +76.6% |
| Brent Crude | 110.25 | +0.6% | +7.8% | +81.5% |
| Gold | 4029.70 | -3.1% | -4.1% | -6.9% |
| Silver | 53.98 | -5.3% | -11.1% | -23.5% |
| Copper | 6.52 | -0.2% | +0.6% | +15.7% |
| Natural Gas | 3.00 | -2.0% | +1.0% | -17.2% |
| Wheat | 624.50 | -4.7% | -8.5% | +23.3% |
| Iron Ore | 90.83 | -0.1% | -1.4% | -15.2% |
| Asset | Level | WoW | MTD | YTD |
|---|---|---|---|---|
| Bitcoin | $80,141 | -2.1% | -5.5% | -9.7% |
| Ethereum | $2,317 | -3.6% | -14.3% | -22.8% |
| Solana | $101 | -3.5% | -14.4% | -20.1% |
| XRP | $1 | -0.7% | -13.4% | -31.1% |
The DXY index slipped 0.1% to 101.89 as the USD posted modest net losses. AUD/USD rose 0.8% to 0.7027 while USD/CAD fell 0.7% to 1.4028, highlighting commodity-currency outperformance. USD/BRL posted the largest decline, down 1.3% to 4.9993, whereas USD/ZAR climbed 1.0% to 16.63 and USD/MXN gained 0.9% to 18.61. EUR/USD declined 0.3% to 1.1192 against a 0.1% gain in GBP/USD to 1.3350. USD/JPY eased 0.2% to 157.42 while USD/TRY added 0.5% to 49.76. USD/CNY fell 0.5% to 6.6565 and USD/INR rose 0.2% to 95.21, underscoring mixed EM flows. Next week’s focus turns to USD/CHF at 0.8262 and NZD/USD at 0.5683 for signs of further divergence.
| Asset | Level | WoW |
|---|---|---|
| S&P 500 | 7623.68 | -0.9% |
| Nasdaq 100 | 28957.53 | -1.9% |
| Dow Jones | 52215.16 | +0.5% |
| Russell 2000 | 2775.9 | +1.7% |
| USD/JPY | 157.32 | -0.3% |
| EUR/USD | 1.12 | -0.3% |
| GBP/USD | 1.34 | +0.1% |
| Gold | 4034.2 | -3.0% |
| WTI Crude | 101.15 | -2.4% |
| Bitcoin | 80173.97 | -2.0% |


Markets navigated a data-light week dominated by positioning around Federal Reserve communications and term-premium dynamics. Equity rotation favored cyclicals. The S&P 500 posted a net decline while the Nasdaq 100 underperformed and the Dow Jones advanced modestly. Small-cap outperformance was evident. Yields rose on hawkish repricing, with the 10-year Treasury yield climbing and the 2-year yield moving higher. The curve steepened. Commodities diverged on supply signals, with WTI crude ending at 101.15 and gold declining. Bitcoin fell. The absence of Tier-1 data prints left Fed communications on growth and inflation as the dominant catalysts. Markets consolidated prior risk-off tone before staging a midweek rebound in cyclicals. Overall positioning reflected caution, with cross-asset flows showing rotation rather than broad de-risking.
Fed communications emphasized stronger US growth alongside observations on rising inflation. The policy rate remained unchanged with no meeting held during the week. Speakers reinforced resilience in activity while acknowledging price pressures near the most recent CPI level. Forward guidance stayed data-dependent, with no fresh signals on the medium-term path. Markets interpreted the combination of growth optimism and inflation warnings as supporting a pause in easing. The 10-year yield reflected these expectations without implying specific probabilities. Official communications provided the sole basis for assessing the reaction function.
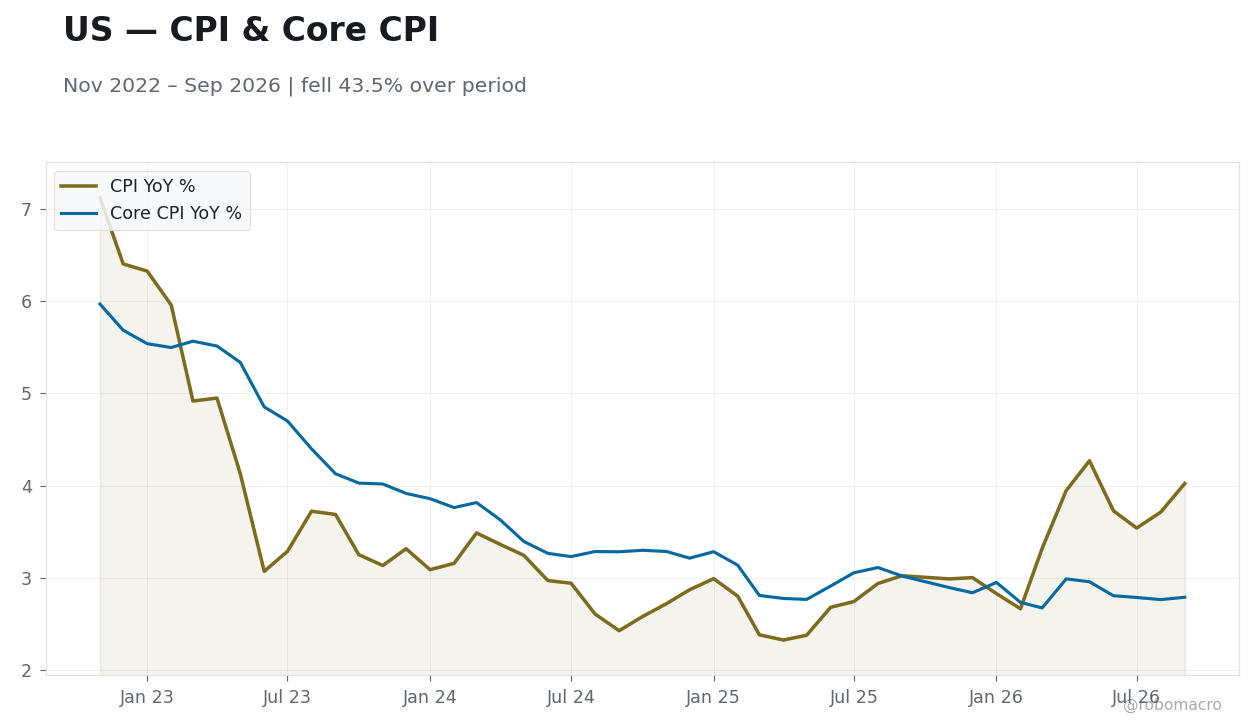
No high-impact US economic releases occurred during the period, leaving the data calendar empty of Tier-1 prints. The most recent inflation benchmark continued to inform views on price pressures. The Beige Book flagged rising inflation across districts. With no new employment or spending figures, assessments of cycle position rested on prior labor-market resilience and housing data. Real borrowing costs remained elevated. Absent fresh consensus comparisons, markets focused on revisions to growth expectations. The light schedule reinforced that the disinflation narrative depends on future prints rather than current momentum. Overall, the data void supported a holding pattern for rate-path projections.
Calendar data unavailable
| Date | Release | Prior | Cons. |
|---|---|---|---|
| 2026-11-02 | ISM Manufacturing PMI | 54.5 | - |
| 2026-11-02 | ISM Manufacturing Employment | 52.7 | - |
| 2026-11-02 | Fed Goolsbee Speech | - | - |
| 2026-11-03 | JOLTs Job Openings | 7.1mn | - |
| 2026-11-03 | Factory Orders Month-over-Month | 0.10 | - |
| 2026-11-03 | API Weekly Crude Oil Stocks | - | - |
| 2026-11-04 | MBA 30-Year Mortgage Rate | - | - |
| 2026-11-04 | ADP Employment Change | 90K | - |
| 2026-11-04 | Exports Level | 315.2bn | - |
| 2026-11-04 | Imports Level | 420.8bn | - |


The calendar opens with limited US Tier-1 releases, maintaining focus on Fed speakers and positioning. Weekly jobless claims and mortgage applications will offer incremental labor and housing signals. No major inflation or employment prints are scheduled before month-end. Attention will center on any additional Fed remarks clarifying the growth-inflation balance. Treasury auctions could influence term-premium dynamics. Equity earnings from technology names will test valuations against elevated real yields. Cross-border data from Europe and Asia may provide indirect context for US growth views. Overall, the week sets up for consolidation ahead of a heavier schedule.
The light data week leaves markets sensitive to any shift in Fed communication or supply-driven commodity moves. Upside growth surprises could reinforce the policy rate for longer, pressuring duration. Downside inflation surprises remain possible given WTI crude volatility. Positioning appears balanced after small-cap gains and gold’s decline. Volatility measures stayed contained despite the Nasdaq 100’s drop. Flow considerations favor cyclical rotation over broad risk reduction. Mispricing risks center on whether yields fully embed the latest inflation warnings.
Equities closed mixed, with the S&P 500 down 0.87% week-over-week after intraday gains. The Nasdaq 100 fell 1.94% while the Russell 2000 advanced 1.74%. Bonds saw the 10-year yield rise, with the 2-year yield moving higher. FX showed USD/JPY at 157.32 and EUR/USD at 1.12. Commodities posted WTI crude at 101.15 and gold down 3.03%. Bitcoin ended at 80173.97. The moves aligned with rotation into cyclicals amid higher yields and reduced hedge demand.
Oil price swings affected global inflation expectations that feed into US readings. Dollar moves against GBP/USD supported modest cross-border capital flows. Geopolitical supply concerns in energy markets added to WTI volatility without direct US data impact. Trade-related commentary remained secondary to domestic Fed signals over the seven-day window.
| Asset | Level | WoW |
|---|---|---|
| Euro Stoxx 50 | 6107.98 | -0.6% |
| DAX | 25422.41 | +0.4% |
| CAC 40 | 7849.05 | -0.2% |
| EUR/USD | 1.12 | -0.3% |
| EUR/GBP | 0.84 | -0.5% |
| EUR/JPY | 176.06 | -0.6% |
| Gold | 4034.2 | -3.0% |
| Brent Crude | 110.15 | +0.6% |
| Bitcoin | 80173.97 | -2.0% |


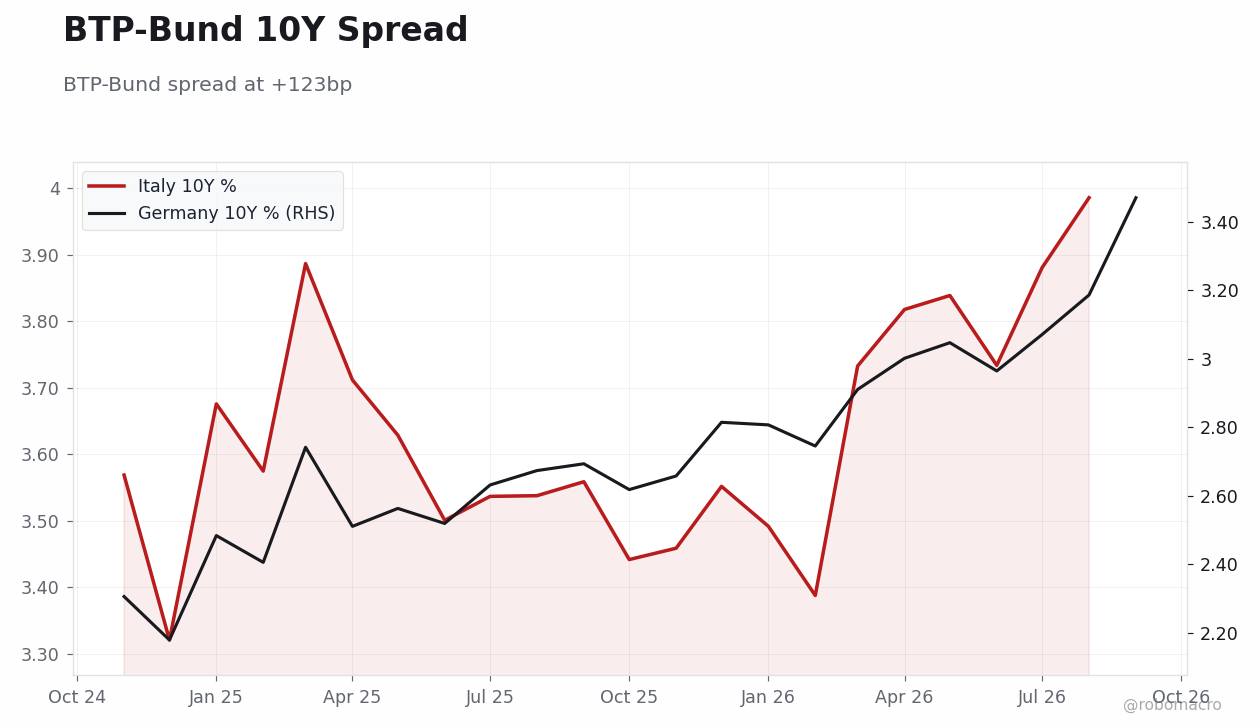
French political risk dominates periphery pricing. The OAT-Bund 10Y spread reached its widest level since the euro-area crisis after demonstrations escalated in Paris. This move occurred with no tier-one data releases, leaving price action driven by fiscal credibility concerns and energy price spikes. Brent crude rose during the period before settling at 110.15, adding upside pressure to headline CPI.
German core holds steady while activity data mixed. The Bundesbank assessed that the economy likely stagnated in Q3, yet the Ifo Business Climate beat consensus and extended its improvement streak. German 10Y Bund yields eased while the 2Y held steady, producing a modest steepening that reflected hedging demand.
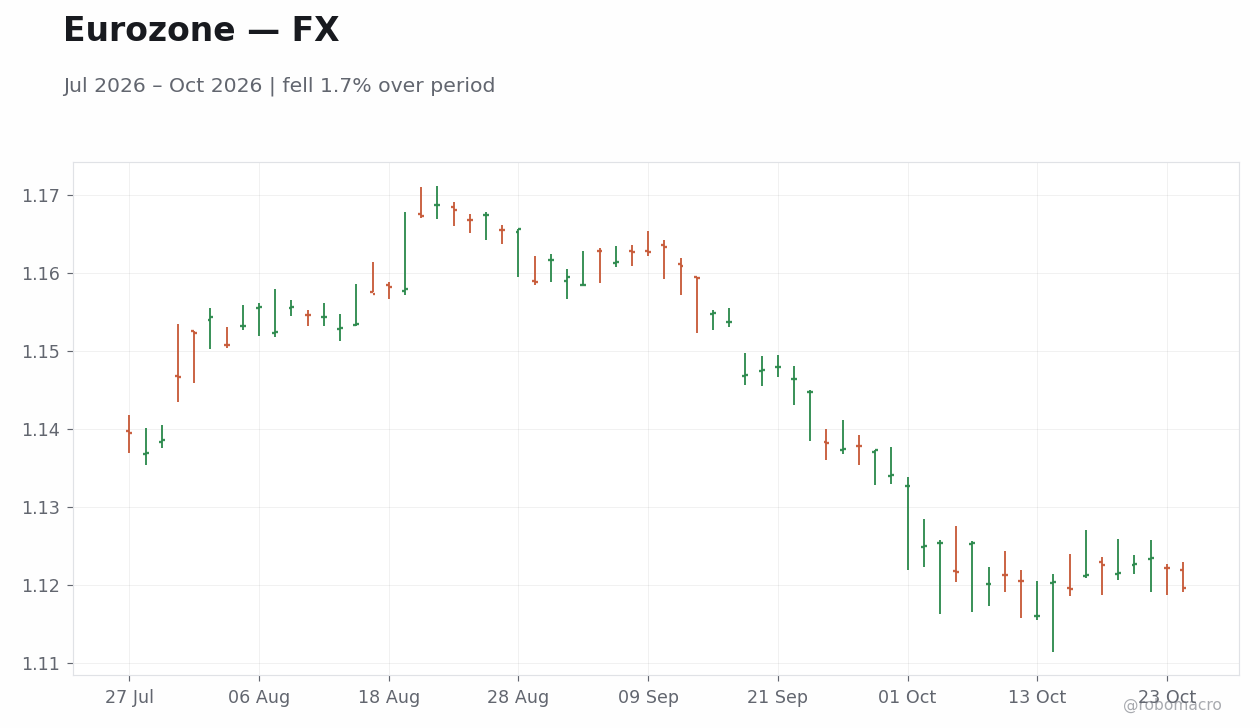
Equities diverge along national lines. The DAX advanced after investment pledges were announced, while the CAC 40 declined. Euro Stoxx 50 ended at 6107.98, down 0.6% for the week. EUR/USD remained near 1.12 across the period, showing limited reaction to the spread widening.
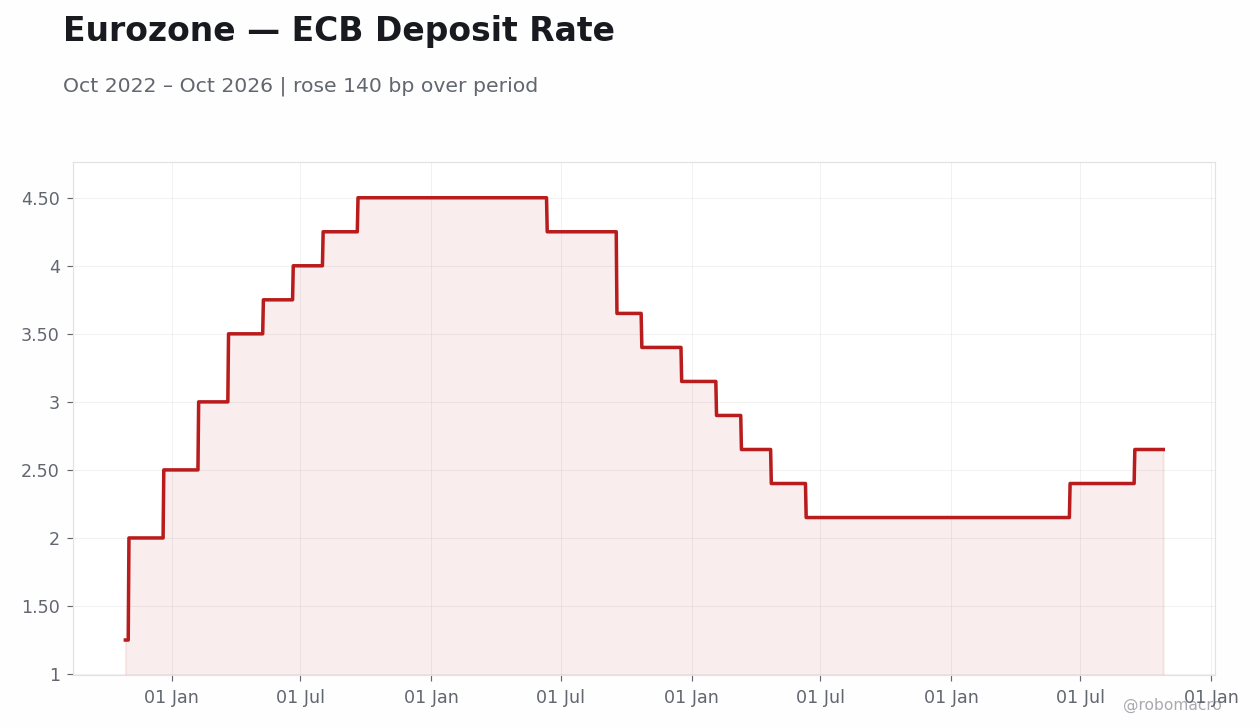
No Governing Council decisions or minutes were released this week. Bundesbank officials reiterated that Germany retains good growth opportunities and will remain Europe’s stability anchor, while noting Q3 stagnation risks. ECB President Lagarde highlighted that the bond selloff itself could help slow inflation, reducing the immediate need for Transmission Protection Instrument activation despite the French-German spread.
Speakers avoided fresh forward guidance on the policy rate, leaving the medium-term path dependent on incoming inflation and growth prints. The Ifo beat provides modest support for a steady policy rate stance into year-end. Markets continue to watch for any verbal intervention on periphery spreads, though none materialized in the last seven days.
The sole high-impact release this week was the German Ifo Business Climate, which rose against consensus and a prior reading. This outcome extended the improvement streak and pointed to a gradual rebound in business sentiment despite the Bundesbank’s assessment of Q3 stagnation. No other tier-one prints occurred, leaving markets without fresh inflation or growth benchmarks.
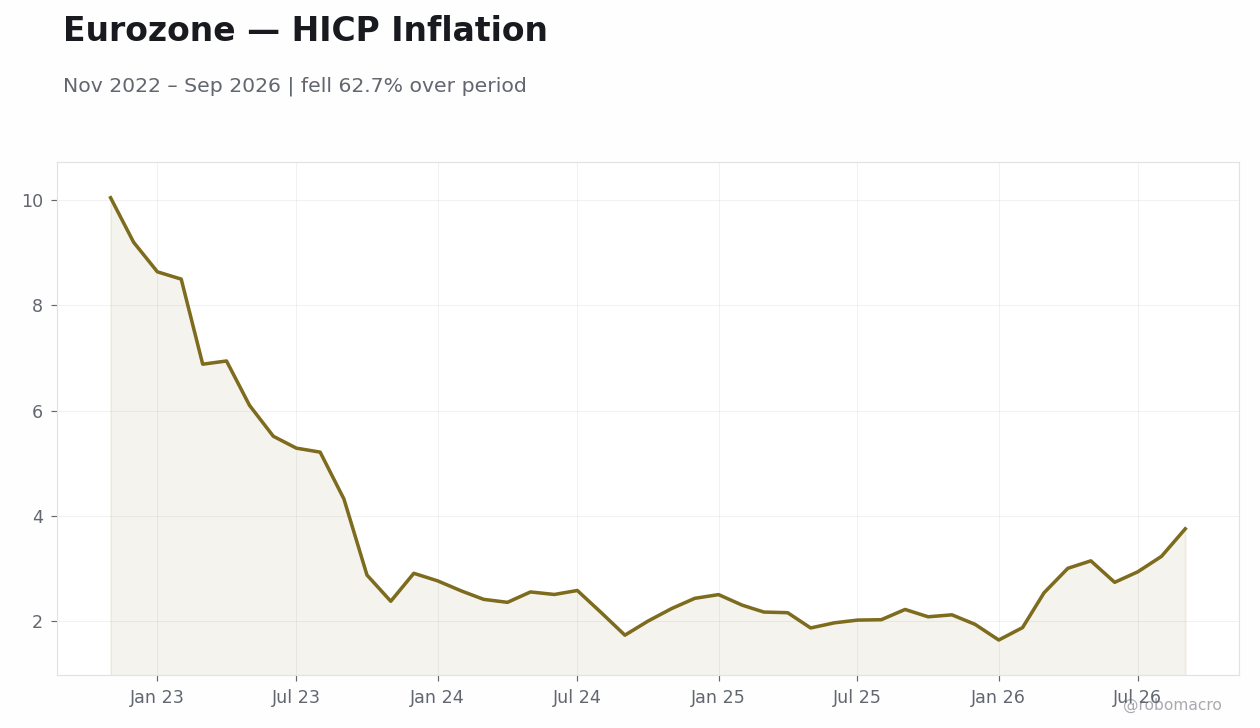
September German inflation and Eurozone HICP continued to anchor expectations for the ECB policy rate. The absence of new CPI or PMI data meant the inflation outlook remained tied to energy costs, with Brent at 110.15 reinforcing upside risks into the next round of flash readings. German 2Y and 10Y yields moved in a narrow range, consistent with markets viewing the policy rate path as data-dependent.
The Ifo beat suggests the German cycle may be bottoming earlier than feared, supporting a baseline of modest Q4 growth. Periphery weakness, however, risks feeding into broader confidence measures if the French spread remains elevated. Overall, the data flow reinforced a two-speed Eurozone narrative: resilient core activity versus fiscal-driven periphery volatility.
| Date | Ctry | Event | Prior | Cons. | Actual |
|---|---|---|---|---|---|
| Mon 26 | FI | Export Prices Year-over-Ye | 8.7 | - | - |
| Mon 26 | FI | Import Prices Year-over-Ye | 7.6 | - | - |
| Mon 26 | FI | Producer Price Index Year- | 7.3 | - | - |
| Mon 26 | ES | Producer Price Index Year- | 13.2 | - | 18.3 |
| Mon 26 | DE | Ifo Business Climate | 89.9 | 90.0 | 90.2 |
| Mon 26 | DE | Ifo Current Conditions | 89.5 | 89.9 | 88.8 |
| Mon 26 | DE | Ifo Expectations | 90.4 | 90.0 | 91.6 |
| Mon 26 | BE | Olo Auction | - | - | - |
| Mon 26 | FR | 12-Month BTF Auction | 3.3 | - | - |
| Mon 26 | FR | 3-Month BTF Auction | 2.8 | - | - |
| Mon 26 | FR | 6-Month BTF Auction | 3.0 | - | - |
| Tue 27 | FI | Business Confidence Index | 3.0 | - | - |
| Tue 27 | FI | Consumer Confidence Index | -4.9 | - | - |
| Tue 27 | FR | Consumer Confidence Index | 86.0 | - | - |
| Date | Release | Prior | Cons. |
|---|---|---|---|
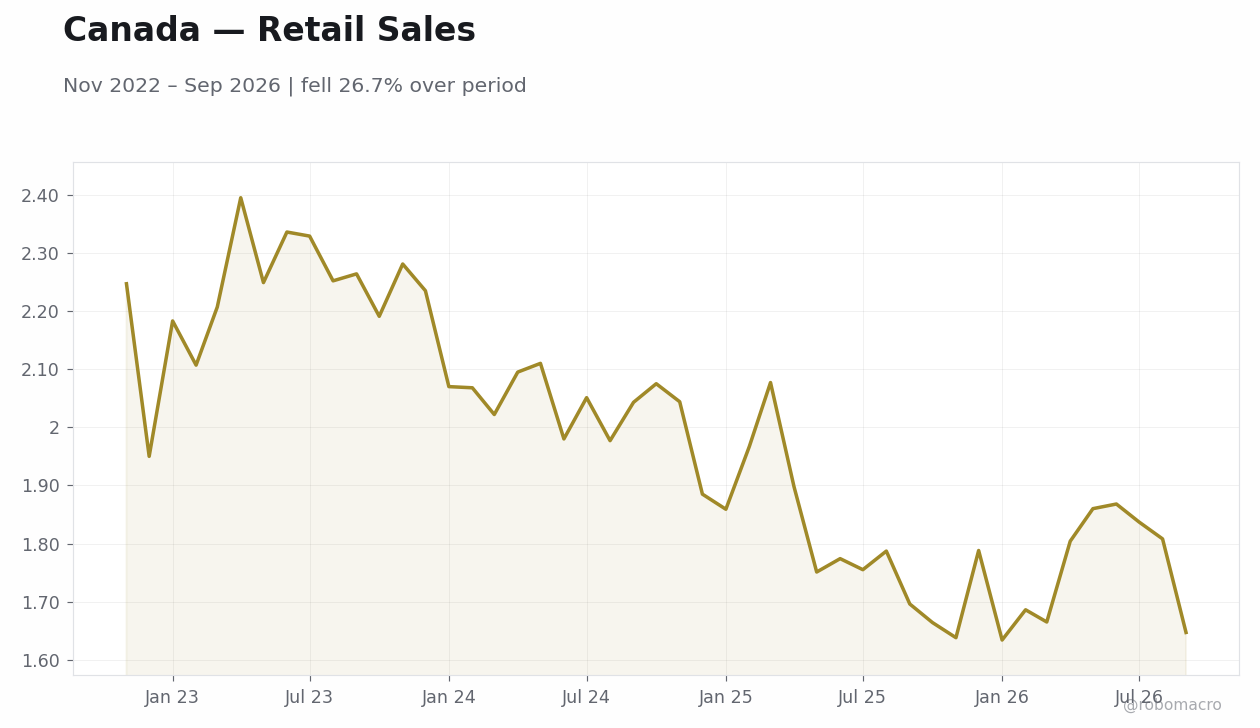
| 2026-11-02 | Retail Sales Month-over-Month | 1.3 | - |
| 2026-11-02 | Retail Sales Year-over-Year | -0.40 | - |
| 2026-11-02 | S&P Global Manufacturing PMI Index | 51.0 | - |
| 2026-11-02 | S&P Global Manufacturing PMI Index | 50.4 | - |
| 2026-11-04 | Inflation Rate Year-over-Year Preli | 3.4 | - |
| 2026-11-04 | Unemployment Level Change | 24K | - |
| 2026-11-04 | S&P Global Services PMI | 58.3 | - |
| 2026-11-04 | S&P Global Services PMI | 51.7 | - |
| 2026-11-05 | Factory Orders Month-over-Month | -10.6 | - |
| 2026-11-05 | Industrial Production Month-over-Mo | -0.30 | - |
Monday brings Finnish export and producer price data alongside Japanese coincident and leading indices. Tuesday features French consumer confidence and Spanish headline unemployment. Wednesday includes German GfK consumer confidence.
Thursday delivers French unemployment benefit claims and Italian business and consumer confidence readings. Friday carries the highest weight with French preliminary GDP growth, French inflation rate year-over-year, and Spanish GDP flash estimates. These releases will provide the first activity and price signals ahead of the ECB’s next policy meeting.
Central bank speakers from the core and periphery are scheduled throughout the week and will be monitored for any commentary on spread dynamics or the policy rate trajectory.
French fiscal credibility remains the dominant near-term risk, with any credit rating action capable of reopening spread widening. Energy prices near recent highs keep the inflation upside scenario alive, potentially delaying policy rate cuts. Positioning shows limited safe-haven flows into gold, which declined despite the volatility.
An upside scenario would see the Ifo momentum extending into stronger German capex, narrowing the two-speed gap. A downside scenario centers on sustained French unrest pushing the spread higher and forcing ECB verbal or tool-based response. Volatility in EUR crosses stayed contained near 1.12, suggesting markets are not yet pricing acute fragmentation.
Euro Stoxx 50 declined 0.6% week-over-week to 6107.98 while DAX advanced 0.41% to 25422.41 and CAC 40 slipped 0.24% to 7849.05. The divergence reflected German investment pledges versus French spread widening. German 10Y Bund yields fell while 2Y yields rose, producing a bear-flattening move followed by modest steepening.
EUR/USD closed near 1.12 for the week, with daily moves limited. EUR/GBP fell 0.45% to 0.84 and EUR/JPY declined 0.61% to 176.06. Gold dropped 3.03% to 4034.20 while Brent crude rose 0.55% to 110.15, the latter supporting inflation concerns. Bitcoin fell 2.05% to 80173.97 amid risk-off flows.
Brent crude at 110.15 added imported inflation pressure across the Eurozone energy import bill. EUR/USD stability near 1.12 occurred against a backdrop of firmer UK labour data that lifted sterling. Broader risk sentiment remained mixed, with Bitcoin declining while equities showed national divergence rather than uniform moves.
Geopolitical developments in the Middle East and energy markets reinforced the commodity channel as the primary cross-border spillover into Eurozone inflation. No major trade policy shifts emerged in the period.
| Asset | Level | WoW |
|---|---|---|
| Nikkei 225 | 62189.65 | -4.2% |
| USD/JPY | 157.32 | -0.3% |
| EUR/JPY | 176.07 | -0.6% |
| GBP/JPY | 210.1 | -0.2% |
| Gold | 4034.1 | -3.0% |
| Brent Crude | 110.15 | +0.6% |
| Bitcoin | 80178.73 | -2.0% |


Hawkish BoJ Communication Dominates Bank of Japan Governor Ueda stated he "can't tolerate" underlying inflation persisting above 2%, while Deputy Governor Himino explicitly signaled readiness to raise borrowing costs. These comments aligned with data showing inflation remaining above the 2% target. Markets interpreted the rhetoric as preparing the ground for normalization ahead of the next meeting.
Equity and Currency Price Action The Nikkei 225 fell 4.2% week-over-week to close at 62,189.65, driven by valuation concerns and elevated oil prices. USD/JPY eased to 157.32, holding near the 158 handle before a modest pullback on risk-off flows. EUR/JPY and GBP/JPY posted similar modest declines to 176.07 and 210.10 respectively.
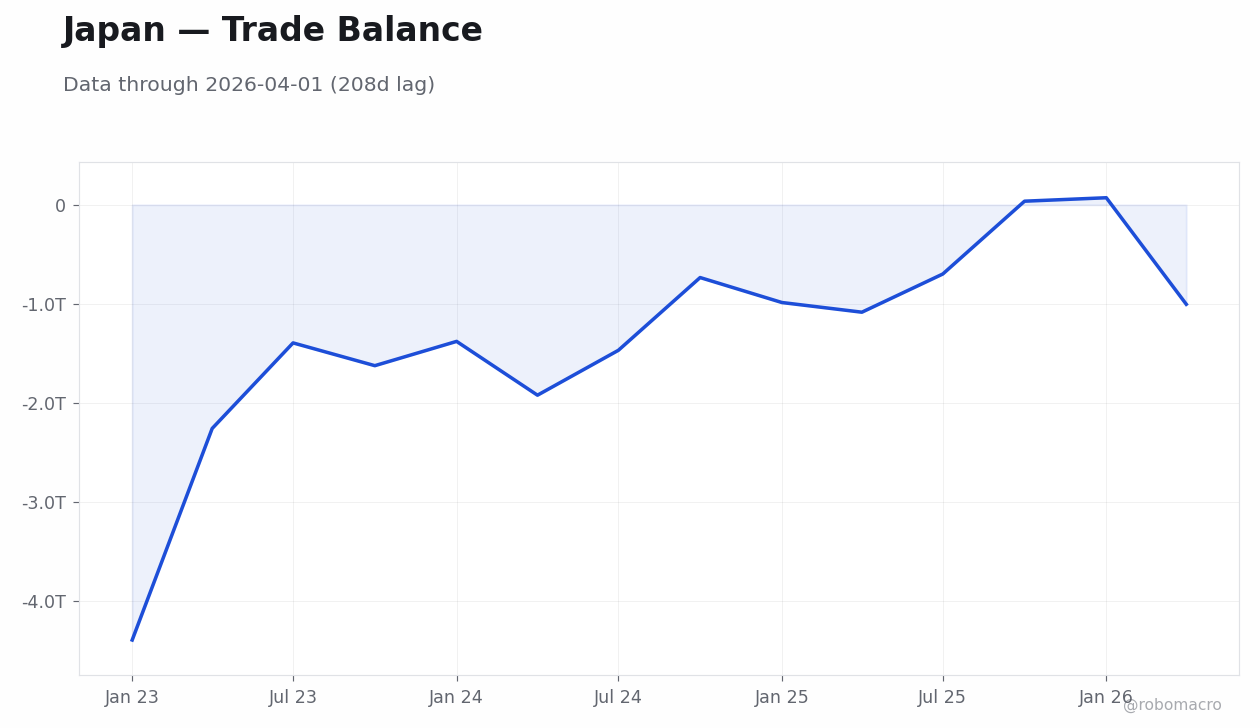
JGB Yield Compression The 10-year JGB yield eased while the 2-year yield moved lower, producing a modest bear-flattening that reflected contained term-premium shifts. No tier-one domestic data releases occurred during the week, leaving price action anchored to BoJ rhetoric and external cues. The widening trade deficit added downside pressure on the yen even as safe-haven bids appeared during equity selloffs.
Inflation Data Breaks Through Target News flow confirmed inflation had crossed 2% for the first time this year, providing concrete support for the officials' forward-leaning statements. Corporate loan demand continued to rise despite the prior tightening cycle, and Oxford Economics noted Japan's low corporate leverage should limit damage from higher rates. Overall, the week's narrative centered on a resilient inflation backdrop meeting a committee increasingly willing to adjust policy.
Governor Ueda reinforced that underlying inflation near or above 2% cannot be tolerated, directly linking the latest CPI print to the need for further adjustments. Deputy Governor Himino added that the committee stands ready to lift borrowing costs. The BoJ Quarterly Outlook Report scheduled for release alongside the next decision will provide updated staff projections on price and growth paths. Data showing inflation breaking 2% for the first time this year supplies the concrete evidence officials have cited as justification for measured normalization. No minutes or additional speeches altered the signal during the week, leaving the focus on whether the upcoming Outlook will confirm durable achievement of the target.
| Date | Ctry | Event | Prior | Cons. | Actual |
|---|---|---|---|---|---|
| Mon 26 | JP | Coincident Index Final | 121 | - | 119 |
| Mon 26 | JP | Leading Economic Index Fin | 118 | 118 | 118 |
| Tue 27 | JP | Boj Jgb Purchase | - | - | - |
| Wed 28 | JP | Foreign Bond Investment Le | -161.6bn | - | - |
| Wed 28 | JP | Foreign Stock Investment L | -66.5bn | - | - |
| Wed 28 | JP | 2-Year JGB Auction | 2.0 | - | - |
| Wed 28 | JP | 3-Month Treasury Bill Auct | 1.3 | - | - |
| Thu 29 | JP | Consumer Confidence Index | 35.4 | 35.1 | - |
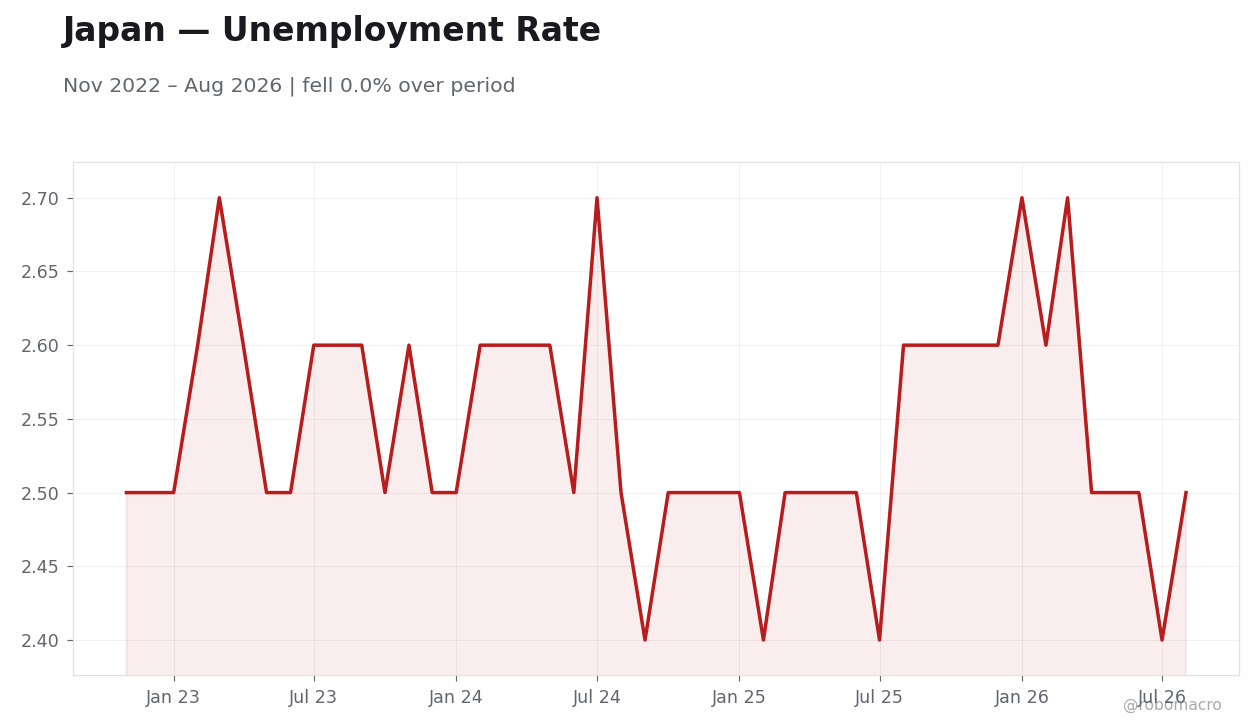
| Thu 29 | JP | Headline Unemployment Rate | 2.5 | 2.5 | - |
| Thu 29 | JP | Jobs/applications ratio | 1.2 | 1.2 | - |
| Thu 29 | JP | Tokyo CPI Ex Food and Ener | 3.0 | 2.7 | - |
| Thu 29 | JP | Tokyo CPI Year-over-Year | 2.7 | - | - |
| Thu 29 | JP | Tokyo Core CPI Year-over-Y | 2.7 | 2.6 | - |
| Thu 29 | JP | Industrial Production Mont | -2.4 | 1.3 | - |
| Date | Release | Prior | Cons. |
|---|---|---|---|
| 2026-11-04 | BoJ Monetary Policy Meeting Minutes | - | - |

Thursday brings the Bank of Japan Interest Rate Decision and Quarterly Outlook Report, with the policy rate expected to remain unchanged while the report updates inflation and growth forecasts. Consumer Confidence Index will test household sentiment ahead of that decision. Headline Unemployment Rate and Industrial Production Month-over-Month Preliminary will clarify labor-market slack and manufacturing momentum. Retail Sales Year-over-Year will show whether consumer spending is keeping pace. Housing Starts Year-over-Year on Friday will round out the data set on construction activity. These releases together will inform whether price pressures remain sufficiently broad-based to support additional rate adjustments at coming meetings.
Persistent yen weakness near 157–158 continues to widen the trade deficit and import-cost pressures, potentially complicating the inflation outlook if the currency fails to stabilize. Equity declines of more than 4% week-over-week highlight valuation sensitivity in the tech sector that could feed back into domestic demand. A hawkish pause at the next meeting would leave scope for a subsequent adjustment only if the Quarterly Outlook Report shows inflation durably above target. Conversely, softer-than-expected Industrial Production or Retail Sales prints could challenge the narrative that price pressures have reached sustainable levels. The market appears to underweight the risk that low corporate leverage allows faster normalization without balance-sheet strain, as noted by Oxford Economics.
| Asset | Level | WoW |
|---|---|---|
| S&P/TSX | 35788.2 | -0.4% |
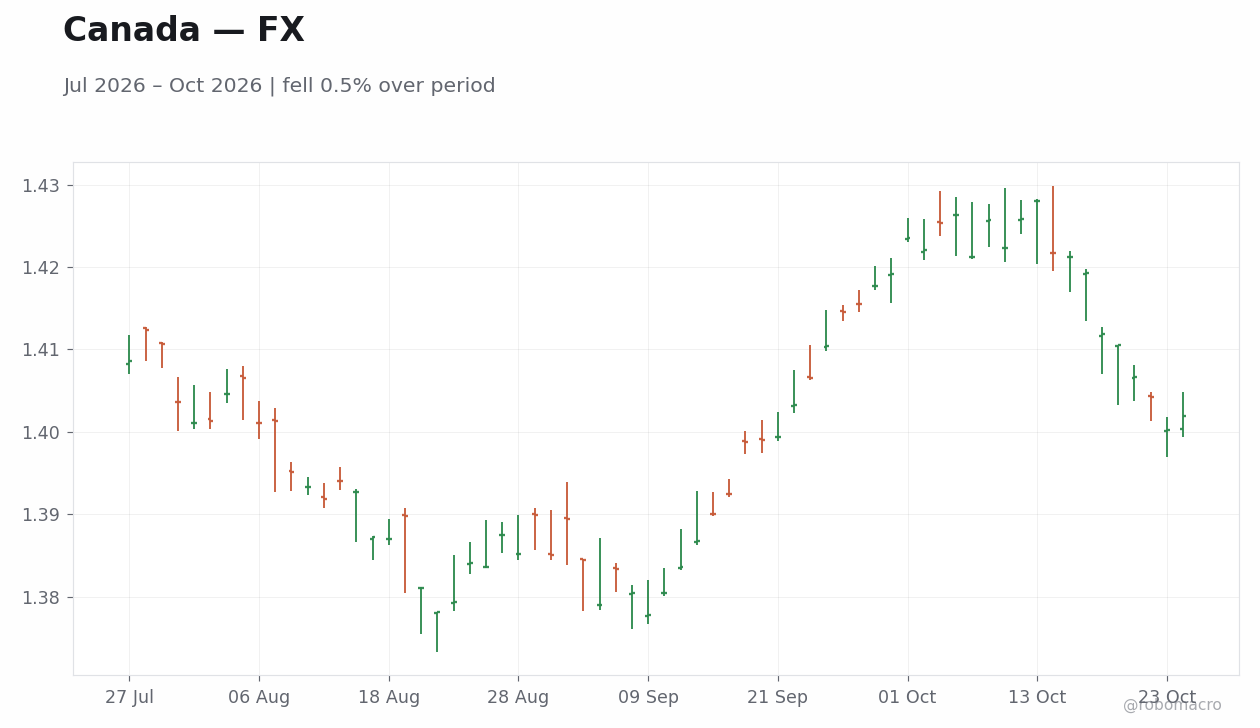
| USD/CAD | 1.4 | -0.7% |
| EUR/CAD | 1.57 | -1.0% |
| WTI Crude | 101.15 | -2.4% |
| Natural Gas | 3.0 | -1.9% |
| Gold | 4034.2 | -3.0% |
| Brent Crude | 110.15 | +0.6% |
| Bitcoin | 80173.97 | -2.0% |


Equity and currency moves diverge. The S&P/TSX Composite closed the week at 35788.2, posting a net decline of 0.39%. USD/CAD finished at 1.4, down 0.73% over the five-day period.
Commodity price dispersion widens. WTI Crude ended at 101.15, Brent Crude closed at 110.15, natural gas ended at 3.0, and gold declined to 4034.2.
Bank of Canada Governor Macklem flagged that global resilience is under strain and that surging crude would lift the inflation outlook, directly preceding the September CPI release. The 3.1% y/y print confirmed the breach of the 1-3% band and coincided with higher inflation expectations in the Business Outlook Survey and Canadian Survey of Consumer Expectations. The Parliamentary Budget Officer’s downward revision of 2026 GDP growth to 0.9% highlighted the growth-inflation tension facing officials. No rate decision occurred this week, yet the combination of the CPI breach and survey results supplied the key inputs officials had identified as determining the direction of the upcoming decision. Data showed headline inflation above target while core measures cooled and growth forecasts deteriorated, leaving the policy signal focused on balancing these opposing forces at the next meeting.
| Date | Ctry | Event | Prior | Cons. | Actual |
|---|---|---|---|---|---|
| Tue 27 | CA | Wholesale Sales Month-over | -1.6 | - | - |
| Wed 28 | CA | BoC Interest Rate Decision | 2.2 | 2.5 | - |
| Wed 28 | CA | BoC Monetary Policy Report | - | - | - |
| Wed 28 | CA | BoC Press Conference | - | - | - |
| Thu 29 | CA | Average Weekly Earnings Ye | 3.2 | - | - |
| Thu 29 | CA | 10-Year Bond Auction | 4.0 | - | - |
| Fri 30 | CA | GDP Month-over-Month | 0 | 0.20 | - |
| Fri 30 | CA | GDP Month-over-Month Prel | - | - | - |
| Fri 30 | CA | Government Budget Balance | -4.8bn | - | - |
| Date | Release | Prior | Cons. |
|---|---|---|---|
| 2026-11-02 | S&P Global Manufacturing PMI Index | 51.5 | - |
| 2026-11-04 | Trade Balance | 4.2bn | - |
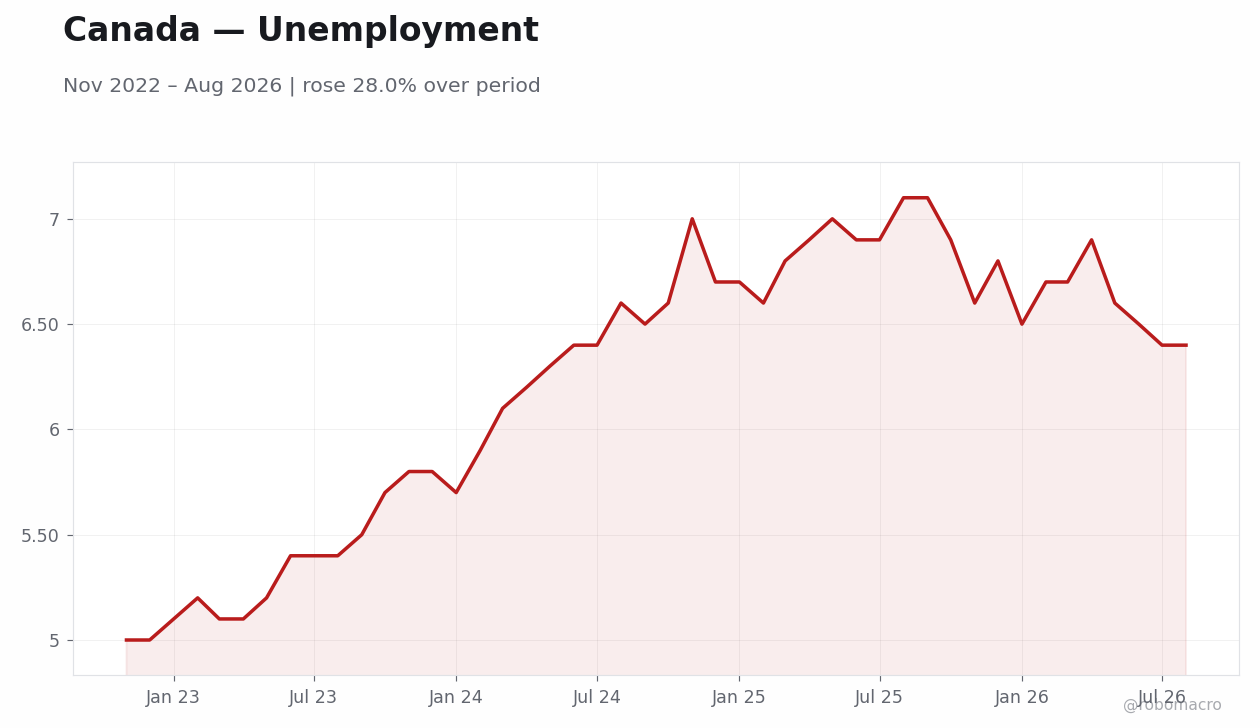
| 2026-11-06 | Headline Unemployment Rate | 6.5 | - |
| 2026-11-06 | Employment Change | -68K | - |
| 2026-11-06 | Full-Time Employment Change | -35K | - |
| 2026-11-06 | Labor Force Participation | 64.8 | - |
| 2026-11-06 | Part-Time Employment Change | -33K | - |
| 2026-11-06 | Ivey PMI Seasonally Adjusted | 58.2 | - |


The Bank of Canada Interest Rate Decision, Monetary Policy Report, and Press Conference on October 28 headline the calendar and will incorporate the September CPI breach along with the Business Outlook Survey findings. Markets will assess whether the 3.1% y/y inflation outcome and elevated inflation expectations alter the forward guidance on the policy rate path. GDP Month-over-Month and GDP Month-over-Month Prel on October 30 are expected to show a 0.2% increase and will provide the first post-CPI read on activity momentum. These releases matter because they directly inform the Bank of Canada’s assessment of whether recent inflation pressures are broad-based or concentrated in energy components. The Monetary Policy Report will update the Bank of Canada’s own inflation and growth projections, offering the clearest signal on how officials view the balance of risks for coming quarters. No other tier-one Canadian data are scheduled, so attention will remain on the central bank communications and any revisions to the rate outlook contained in the report.
Commodity price dispersion introduces uncertainty around inflation and growth channels.
| Asset | Level | WoW |
|---|---|---|
| IPC Bolsa | 69879.62 | +1.3% |
| USD/MXN | 18.64 | +1.1% |
| EUR/MXN | 20.86 | +0.8% |
| WTI Crude | 101.22 | -2.4% |
| Silver | 54.12 | -5.0% |
| Gold | 4033.8 | -3.0% |
| Brent Crude | 110.17 | +0.6% |
| Bitcoin | 80037.94 | -2.2% |


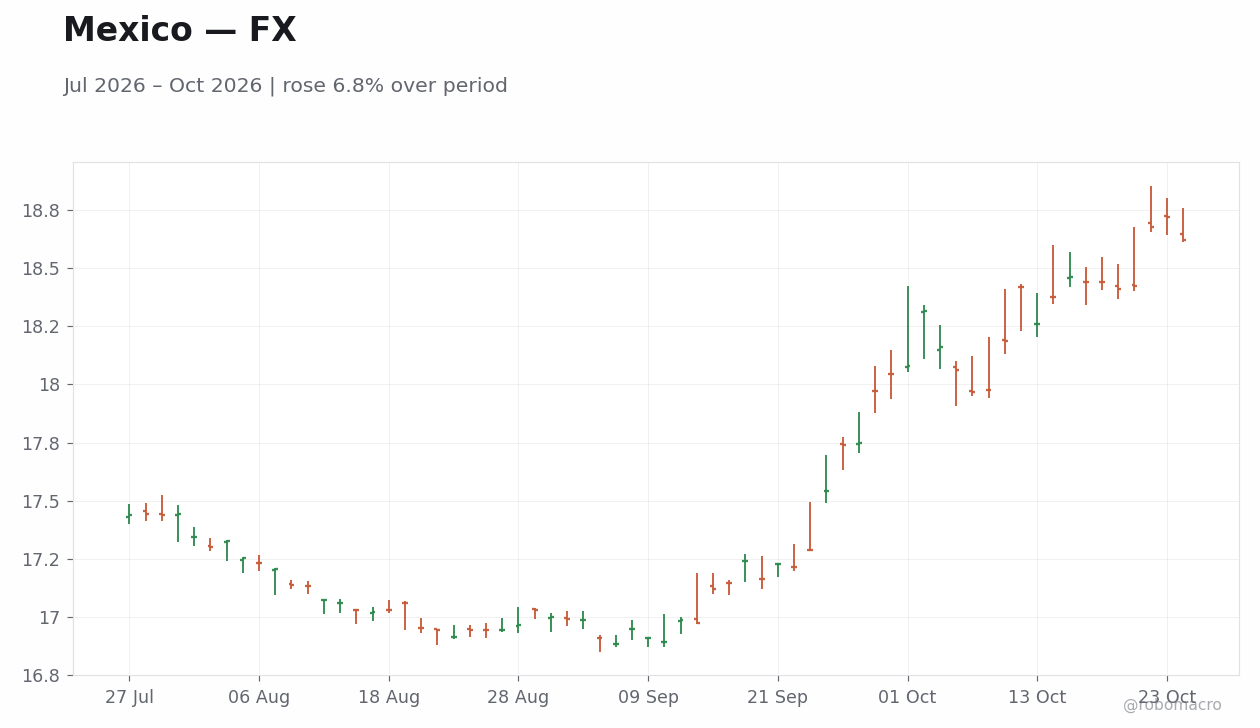
Equity resilience amid external pressure Mexican equities delivered a net advance, with the IPC Bolsa rising 1.26% to 69,879.62. The gain occurred alongside a 1.08% increase in USD/MXN to 18.64, illustrating equity inflows that offset currency pressure.
Currency and trade-headline sensitivity The peso posted a 1.08% weekly loss to 18.64. EUR/MXN ended at 20.86.
Commodity volatility and fiscal linkages WTI Crude posted a 2.35% weekly decline to 101.22. Brent Crude closed at 110.17. Gold declined 3.04% to 4,033.80 while silver fell 5.01% to 54.12.
Fixed-income divergence The Mexico 10Y yield eased even as the peso sold off, a move that contrasted with typical risk-off patterns and suggested continued local investor appetite for duration. No tier-one data prints occurred during the week, leaving price action dominated by external flows and headline risk.
Absence of domestic catalysts With the economic calendar empty, markets relied on global cues and trade developments to set direction. The resulting split performance—equities higher, currency softer—highlighted Mexico’s differentiated asset-class response to the same external shock.
Banco de Mexico maintained the policy rate through the week. The latest CPI reading continues to generate a sizable real-rate cushion that supports the committee’s measured approach. No speeches or minutes were released during the period, leaving the existing forward guidance unchanged. The data flow offered no new inflation or activity surprises that would prompt officials to alter their signal on the pace of future adjustments. Officials have consistently tied decisions to incoming prints rather than external market moves, and the quiet week reinforced that data-dependent stance.
| Date | Ctry | Event | Prior | Cons. | Actual |
|---|---|---|---|---|---|
| Tue 27 | MX | Trade Balance | 605.0mn | - | - |
| Fri 30 | MX | GDP Growth Quarter-over-Qu | 1.4 | - | - |
| Fri 30 | MX | GDP Growth Year-over-Year | 2.1 | - | - |
| Fri 30 | MX | Fiscal Balance | -737.3bn | - | - |
| Date | Release | Prior | Cons. |
|---|---|---|---|
| 2026-11-03 | Business Confidence Index | 48.0 | - |
| 2026-11-04 | Consumer Confidence Index | 45.1 | - |
| 2026-11-05 | Central Bank Interest Rate Decision | 6.5 | - |


Attention turns to upcoming external-demand and activity data. These releases will update the growth trajectory for the current quarter and inform assessments of spare capacity. Both prints arrive before upcoming decisions and will help calibrate whether activity momentum supports the current policy stance or warrants further adjustment. Markets will also monitor any follow-through on US-Mexico trade discussions for potential second-round effects on inflation via imported costs. The combination of external and domestic data should clarify the balance of risks for coming quarters without requiring immediate policy reaction.
The week’s trade impasse introduced downside risk to the peso and fiscal outlook that could feed into imported inflation if unresolved. Oil-price swings around current WTI levels remain a live variable for Pemex-linked revenues and the terms-of-trade backdrop. Equity outperformance despite currency weakness suggests inflows may be masking underlying vulnerability should external sentiment deteriorate further. The 10Y yield’s decline amid peso pressure indicates duration demand is intact for now, but any reversal in that bid would signal a shift in domestic risk appetite. Data surprises could ease or heighten growth concerns and affect the case for policy adjustment. The market appears to be under-weighting the persistence of trade-related volatility relative to the data-dependent signals from Banco de Mexico.
| Asset | Level | WoW |
|---|---|---|
| Bovespa | 205083.0 | 0.0% |
| USD/BRL | 5.0 | -1.3% |
| EUR/BRL | 5.6 | -1.4% |
| Vale | 12.4 | -5.4% |
| Petrobras | 26.16 | +2.4% |
| WTI Crude | 101.22 | -2.4% |
| Gold | 4033.5 | -3.0% |
| Bitcoin | 80037.94 | -2.2% |


Election uncertainty dominates price action. Brazilian assets navigated a polarized runoff campaign between Lula and Flávio Bolsonaro, with the October 25 vote outcome producing a narrow Lula victory that markets processed through higher term premia rather than broad risk-off flows. The Bovespa ended the period at 205,083 with a net flat print, while Petrobras shares rose to 26.16 even as WTI Crude moved lower.
Rates price fiscal caution. The 5-year government yield climbed and the 10-year followed, reflecting investor demands for compensation on post-election spending cap and tax reform sequencing risks highlighted in campaign debates. USD/BRL eased to 5.00 over the week, with the real posting a gain as external commodity support and dollar softness offset domestic political noise.
Growth data confirms steady momentum. The central bank’s IBC-Br index rose, aligning with export momentum and supporting a non-overheating expansion narrative into the final quarter. No tier-one statistical releases occurred, leaving political headlines and commodity channels to drive daily equity and FX swings, including a decline in Vale shares.
Market divergence signals selective pricing. Equities and the real firmed on net while the curve steepened, indicating FX markets emphasized external relief and commodity terms of trade whereas fixed income focused on domestic debt trajectory concerns. The week’s arc therefore transitioned from pre-runoff positioning to post-election consolidation without material data surprises altering the underlying growth or inflation backdrop.
The Banco Central do Brasil maintained the Selic target rate through the period, with no speakers or minutes altering forward guidance amid the electoral calendar. August IBC-Br growth alongside September export strength reinforced a stable activity profile that leaves the policy rate path data-dependent on subsequent inflation and labor market prints. Unit labor costs at decade highs and services inflation stickiness were noted in market commentary as factors that could sustain the current restrictive stance into coming quarters. Officials’ silence during the runoff week avoided any direct signal on fiscal interactions, keeping the emphasis on incoming releases to shape the next meeting’s assessment of inflation convergence. The absence of policy communication meant markets absorbed the data flow without fresh official commentary on the balance of risks.
| Date | Ctry | Event | Prior | Cons. | Actual |
|---|---|---|---|---|---|
| Mon 26 | BR | FGV Consumer Confidence | 84.2 | - | 84.7 |
| Mon 26 | BR | BCB Focus Market Readout | - | - | - |
| Mon 26 | BR | Current Account Balance | -5.1bn | -5.0bn | -5.1bn |
| Mon 26 | BR | Foreign Direct Investment | 7.4bn | 6.5bn | 11.3bn |
| Tue 27 | BR | Producer Price Index Month | 0.36 | - | - |
| Tue 27 | BR | Producer Price Index Year- | 2.5 | - | - |
| Thu 29 | BR | IGP-M Inflation Month-over | 1.6 | - | - |
| Thu 29 | BR | Bank Lending Month-over-Mo | 0.50 | - | - |
| Thu 29 | BR | Net Payrolls | 166K | - | - |
| Fri 30 | BR | Gross Debt to GDP | 82.9 | - | - |
| Fri 30 | BR | Nominal Budget Balance | -116.0bn | - | - |
| Fri 30 | BR | Headline Unemployment Rate | 5.3 | - | - |
| Date | Release | Prior | Cons. |
|---|---|---|---|
| 2026-11-03 | BCB Focus Market Readout | - | - |
| 2026-11-04 | Central Bank Interest Rate Decision | - | - |
| 2026-11-05 | Industrial Production Month-over-Mo | -0.60 | - |
| 2026-11-05 | S&P Global Services PMI | 49.2 | - |
| 2026-11-06 | Trade Balance | 7.7bn | - |

The October 26 BCB Focus Market Readout will provide the first post-election gauge of analyst expectations for growth and inflation, setting the tone for how the new administration’s fiscal plans feed into the Banco Central do Brasil’s rate deliberations. Headline Unemployment Rate data due October 30 will offer fresh labor market evidence relevant to services inflation persistence and the timing of any upcoming decisions. Markets will monitor whether the print confirms or challenges the steady growth signal from August IBC-Br, directly informing assessments of the policy rate path over coming quarters. External factors such as commodity price stability will also matter given their transmission to exports and the real’s valuation. The light domestic calendar leaves room for any early fiscal signals from the re-elected administration to influence term premia ahead of the next meeting. Overall, the releases will help calibrate whether the current restrictive stance remains appropriate or requires adjustment based on evolving activity and price data.
Post-election fiscal platform details carry upside risk to term premia if spending commitments exceed market expectations, potentially extending the curve steepening observed this week. Downside growth surprises in the unemployment release could ease inflation concerns and support a more dovish Banco Central do Brasil tilt in coming quarters, while stronger prints would reinforce the current stance. The divergence between firmer equities/FX and weaker bonds highlights a potential mispricing if political risk fails to translate into sustained fiscal slippage. Commodity volatility, particularly in oil and iron ore, remains a transmission channel that could amplify or offset domestic data effects on the real and Petrobras-linked assets.
| Asset | Level | WoW |
|---|---|---|
| USD/ARS | 1536.0 | +1.2% |
| EUR/ARS | 1706.7 | +3.2% |
| Gold | 4033.2 | -3.0% |
| Brent Crude | 110.14 | +0.5% |
| Soybean | 1246.0 | -0.6% |
| Bitcoin | 80060.87 | -2.2% |


Growth Outlook and Caputo Comments Economy Minister Caputo explicitly ruled out recession probabilities on October 19 and tied the projected Q4 rebound to fiscal consolidation already delivered under the IMF programme. August data showed only a mild rebound after July’s steeper contraction, leaving the second-half growth path uneven. The 33.5% August CPI year-on-year print remained the clearest inflation anchor, down sharply from prior years yet still high enough to constrain real wage recovery.
Currency and Equity Market Moves USD/ARS advanced to 1536.0, a 1.21% weekly gain consistent with the managed crawling peg. EUR/ARS reached 1706.7 on the same Friday, up 3.23% over the week. Equity markets registered limited movement amid thin volume and limited domestic catalysts.
Commodity and External Drivers Brent crude ended at 110.14 after a weekly gain of 0.54%. Soybean futures finished at 1246.0, down 0.6% for the week, trimming expected export settlement flows. Bitcoin declined 2.19% over the period, offering little offset to local risk sentiment.
Policy and Structural Signals No domestic data releases occurred, so price action reflected positioning and external commodity moves rather than fresh prints. Fiscal consolidation remained the dominant narrative linking growth expectations to reserve accumulation goals.
Officials continued to calibrate the crawling-peg pace against residual inflation stickiness. No rate decision or minutes were released, leaving the policy signal embedded in the absence of intervention and the steady daily increments in USD/ARS. Data showing only a mild August rebound reinforced the case for measured easing while preserving reserve-building capacity. Communications focused on sterilisation operations and reserve accumulation targets rather than any shift in the policy rate path.
Calendar data unavailable

The domestic calendar remains empty through the end of October, directing attention to soybean export proceeds and Brent crude levels near 110.14. Any BCRA statements on reserve accumulation or the crawling-band trajectory will be parsed for signals ahead of the next policy meeting. Global commodity prints will influence the trade-balance outlook and imported-inflation channel. Traders will also monitor peso liquidity and parallel-market spreads for evidence of intervention pressure. The light schedule keeps the focus on fiscal-consolidation updates under the IMF programme and their implications for the coming quarters’ rate path.
A two-speed recovery is visible in the data, with energy and export sectors supported by Vaca Muerta output while manufacturing and retail lag. Commodity volatility around Brent at 110.14 and soybeans at 1246.0 could swing the trade surplus and inflation prints in either direction. Markets appear to price a smooth glide path for USD/ARS, yet any acceleration in parallel spreads would test the BCRA’s reserve-management capacity in the quarters ahead.
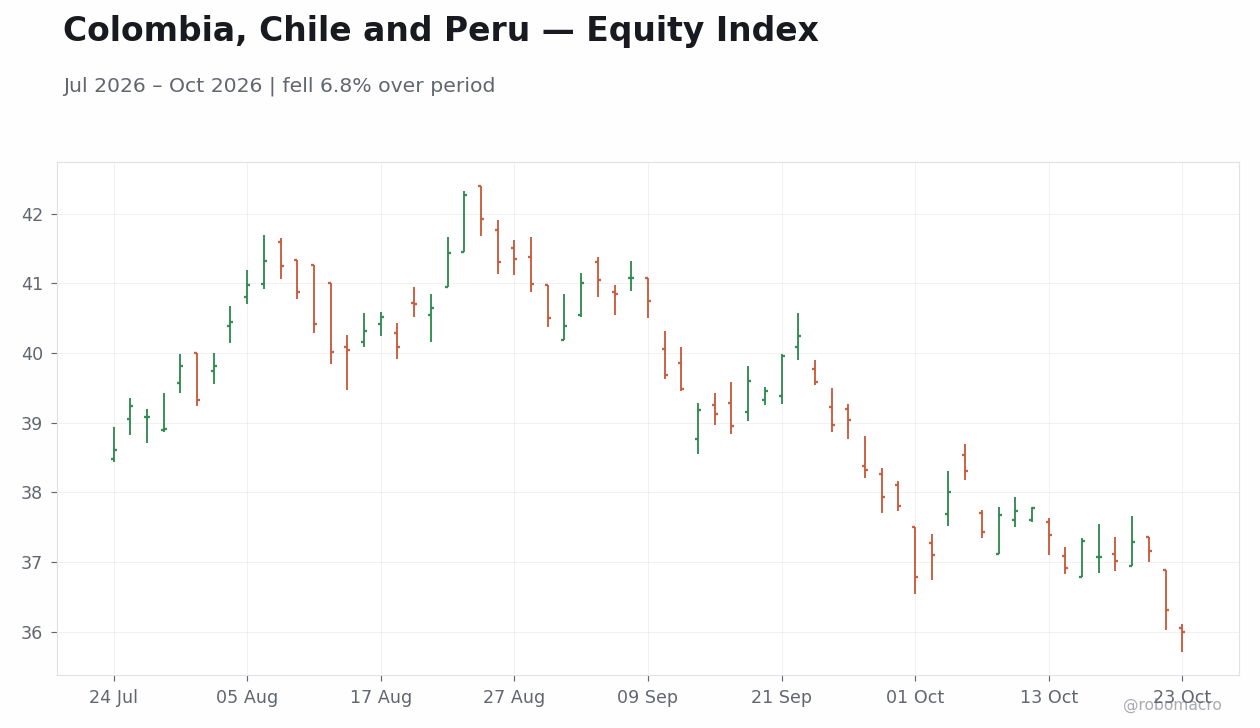
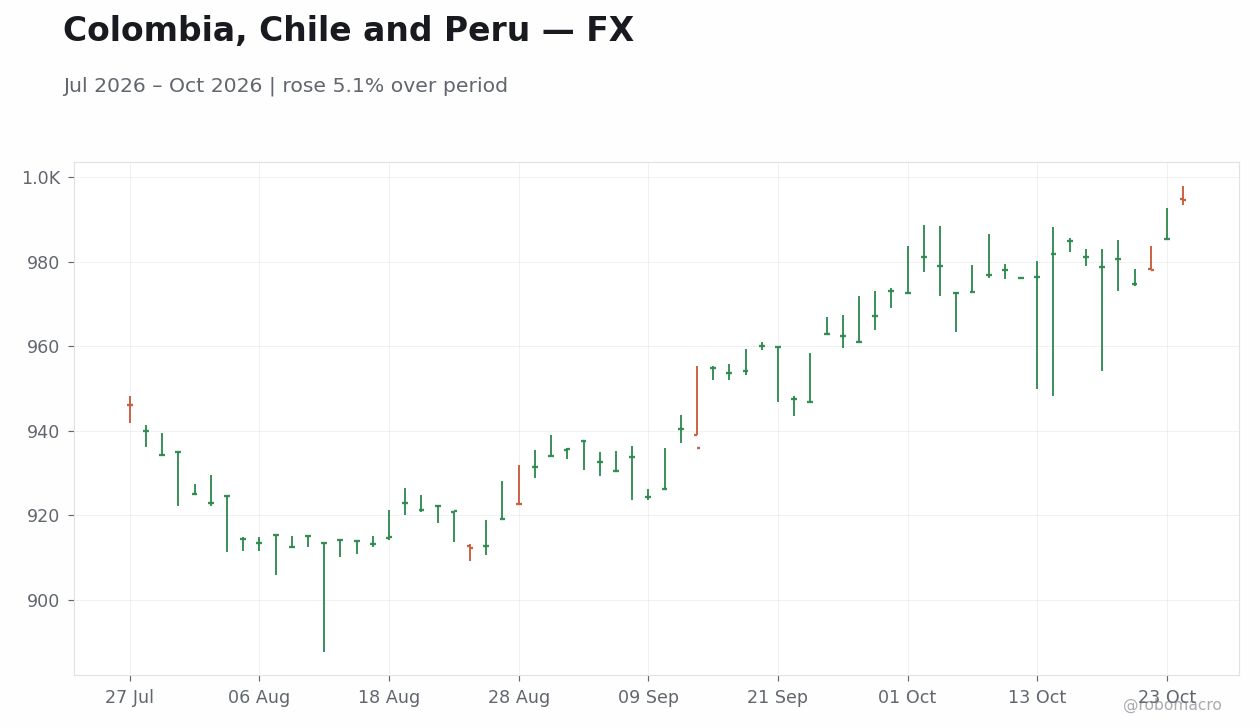
| Asset | Level | WoW |
|---|---|---|
| MSCI Chile | 36.0 | -2.8% |
| MSCI Peru | 84.2 | -5.9% |
| USD/COP | 3146.88 | -0.9% |
| USD/CLP | 994.9 | +1.6% |
| USD/PEN | 3.45 | +3.2% |
| Copper | 6.52 | -0.3% |
| Gold | 4033.6 | -3.0% |
| Brent Crude | 110.28 | +0.7% |
| Bitcoin | 80114.58 | -2.1% |


FX Divergence Dominates Andean Trading The week featured pronounced intra-regional FX divergence with no tier-one data releases across Colombia, Chile or Peru. USD/PEN climbed 3.22%, the largest move in the bloc, while USD/CLP rose and USD/COP eased. Copper’s decline weighed on Chile and Peru export revenues, yet Brent crude’s advance offered Colombia a modest terms-of-trade buffer.
Equity Weakness Concentrated in Mining Exposures MSCI Peru and MSCI Chile declined, reflecting mining-sector sensitivity to the copper pullback and broader EM risk aversion. MSCI Colombia remained resilient, supported by the oil price gain and contained peso movement.
Fiscal and Commodity Cross-Currents Shape Sentiment Colombia’s budget increase added to debt-burden concerns following the IMF warning, keeping local yields under watch despite the absence of fresh prints. Gold’s decline removed secondary support for Peruvian and Colombian mining indices. Bitcoin’s drop served as a proxy for softer EM risk appetite.
Policy Silence Leaves Markets to External Drivers With the economic calendar empty, price action reflected commodity flows and dollar strength rather than domestic catalysts. The BCCh held its short-term rate and the BCRP maintained its stance without new guidance. Overall, the week confirmed commodity dependence and fiscal overhangs rather than challenging prior growth or inflation expectations.
The BCCh kept its policy rate with no fresh speakers or minutes released during the week, leaving the easing path dependent on upcoming inflation prints and copper-driven growth signals. The BCRP similarly maintained its rate amid the sharp PEN depreciation, which could add imported inflation pressure ahead of the next decision. BanRep held steady and offered no new forward guidance, consistent with its hawkish stance through the period. The absence of domestic data meant officials’ prior communications on fiscal consolidation and external balances remained the dominant policy signal. Copper’s modest decline and Brent’s gain provided mixed input for the three central banks’ inflation and growth assessments into the coming quarters.
| Date | Ctry | Event | Prior | Cons. | Actual |
|---|---|---|---|---|---|
| Tue 27 | CL | Central Bank Interest Rate | 4.5 | - | - |
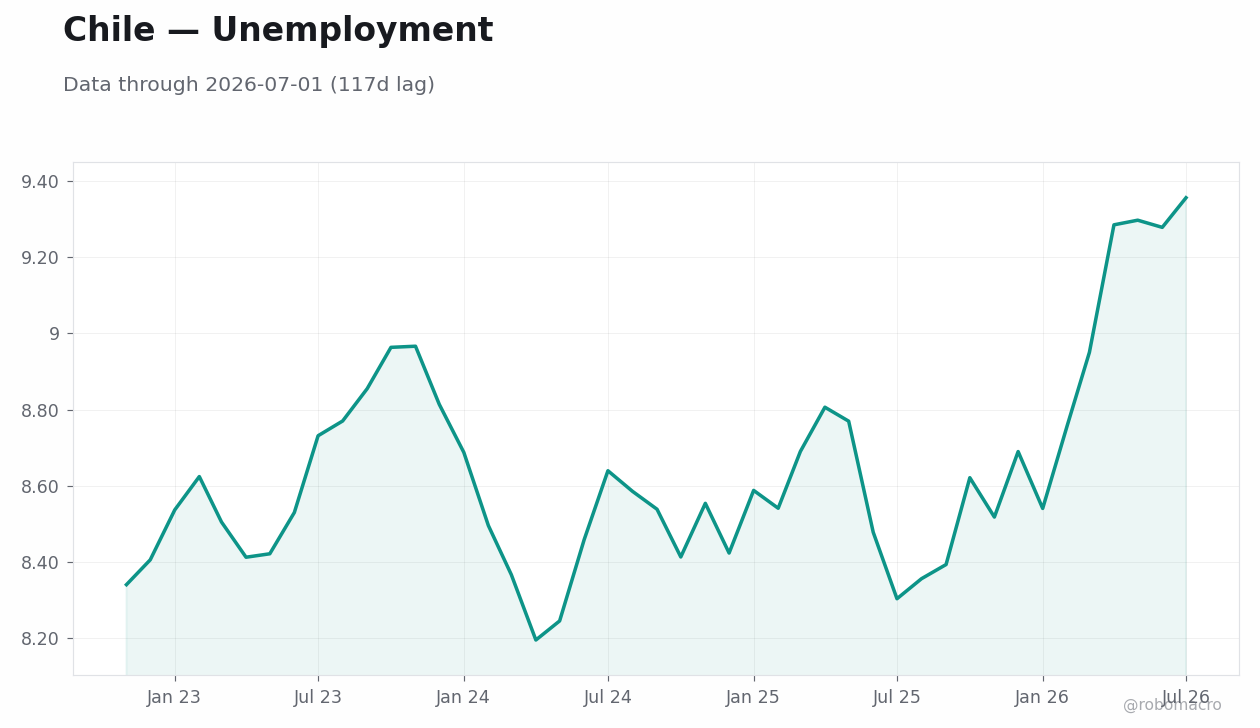
| Thu 29 | CL | Headline Unemployment Rate | 9.6 | - | - |
| Thu 29 | CO | Business Confidence Index | 5.8 | - | - |
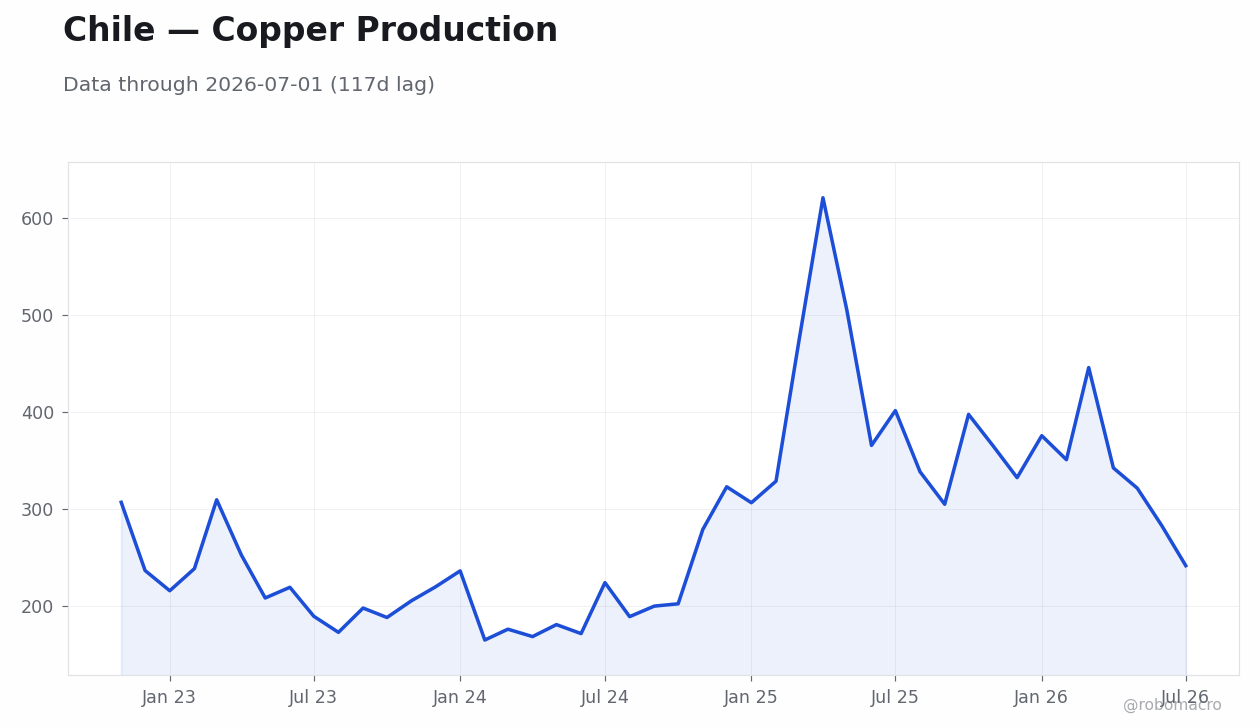
| Fri 30 | CL | Copper Production Year-ove | -12.8 | - | - |
| Fri 30 | CL | Industrial Production Year | -5.7 | - | - |
| Fri 30 | CL | Manufacturing Production Y | -2.6 | - | - |
| Fri 30 | CL | Retail Sales Month-over-Mo | 1.2 | - | - |
| Fri 30 | CL | Retail Sales Year-over-Yea | 3.4 | - | - |
| Fri 30 | CO | Headline Unemployment Rate | 9.4 | - | - |
| Fri 30 | CO | Central Bank Interest Rate | 12.2 | - | - |
| Fri 30 | CO | Cement Production Year-ove | 2.9 | - | - |


Chile’s Central Bank Interest Rate Decision will be the first policy event, with officials assessing copper price stability and imported inflation from recent CLP moves. Colombia’s Central Bank Interest Rate Decision follows, where the recent budget expansion carries implications for medium-term inflation. No other high-impact releases are scheduled for the three countries, so attention will center on any post-decision statements that update growth or external-balance views. The decisions matter for the rate path because they will clarify how each bank weighs commodity volatility against fiscal developments. Traders will also monitor follow-through in USD/PEN after last week’s rise, which could influence BCRP intervention signals. Overall, the sparse calendar keeps focus on whether officials adjust language around coming quarters’ inflation risks.
The week’s commodity-driven FX moves highlight downside risks to growth in Chile and Peru if copper remains near current levels, potentially delaying BCCh easing and adding pressure on BCRP reserves. Colombia faces upside fiscal risks from the budget increase, which could keep BanRep cautious even as Brent provides revenue support. Equity underperformance in mining-heavy indices suggests markets may be underpricing domestic demand weakness relative to external terms-of-trade gains. A reversal in Brent or further copper slippage would shift the inflation outlook for all three central banks and test the stability of recent peso and sol levels.
| Asset | Level | WoW |
|---|---|---|
| FTSE 100 | 10738.73 | -0.2% |
| FTSE 250 | 24499.06 | +0.5% |
| GBP/USD | 1.34 | +0.1% |
| GBP/EUR | 1.19 | +0.4% |
| GBP/JPY | 210.17 | -0.1% |
| Brent Crude | 110.28 | +0.7% |
| Gold | 4033.4 | -3.0% |
| UK Nat Gas | 3.0 | -2.0% |
| Bitcoin | 80114.58 | -2.1% |


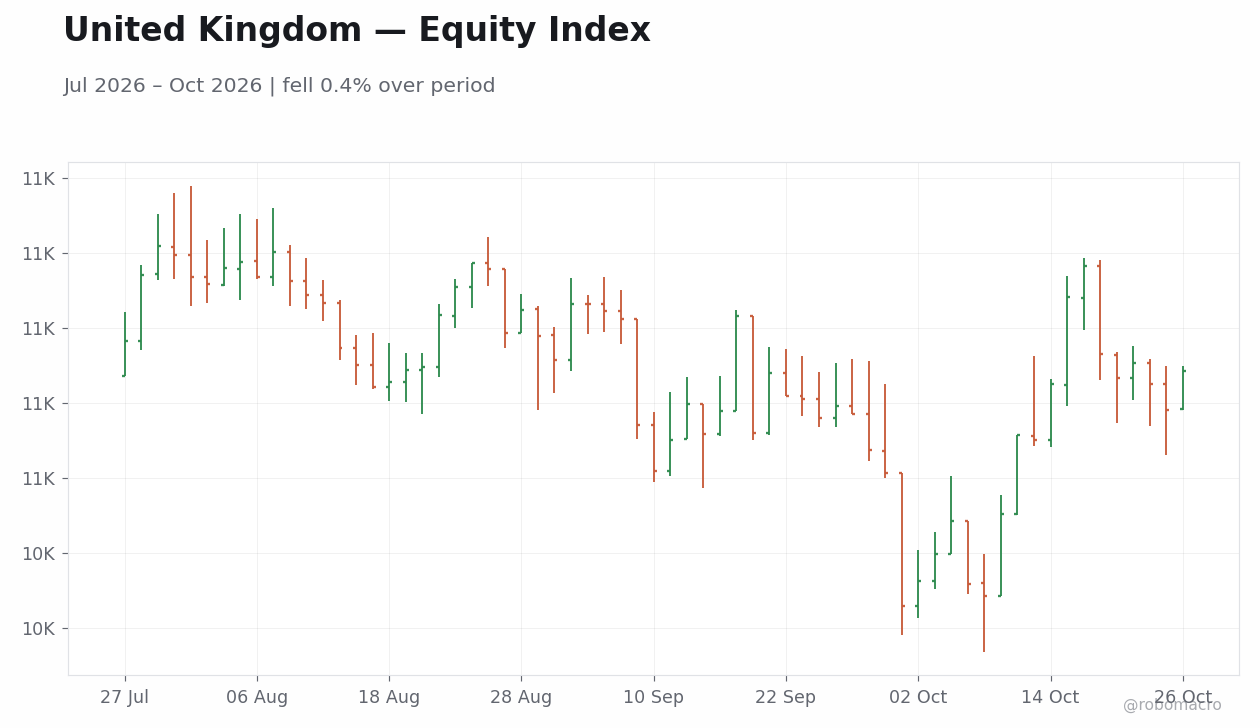
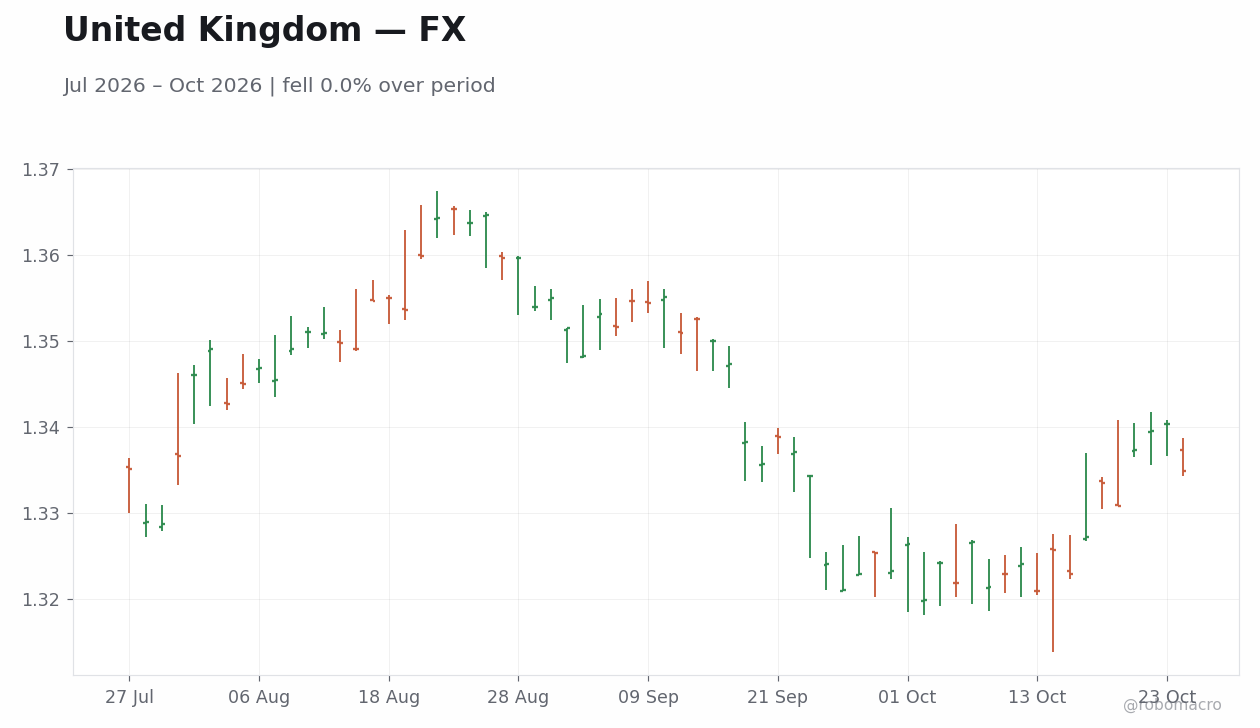
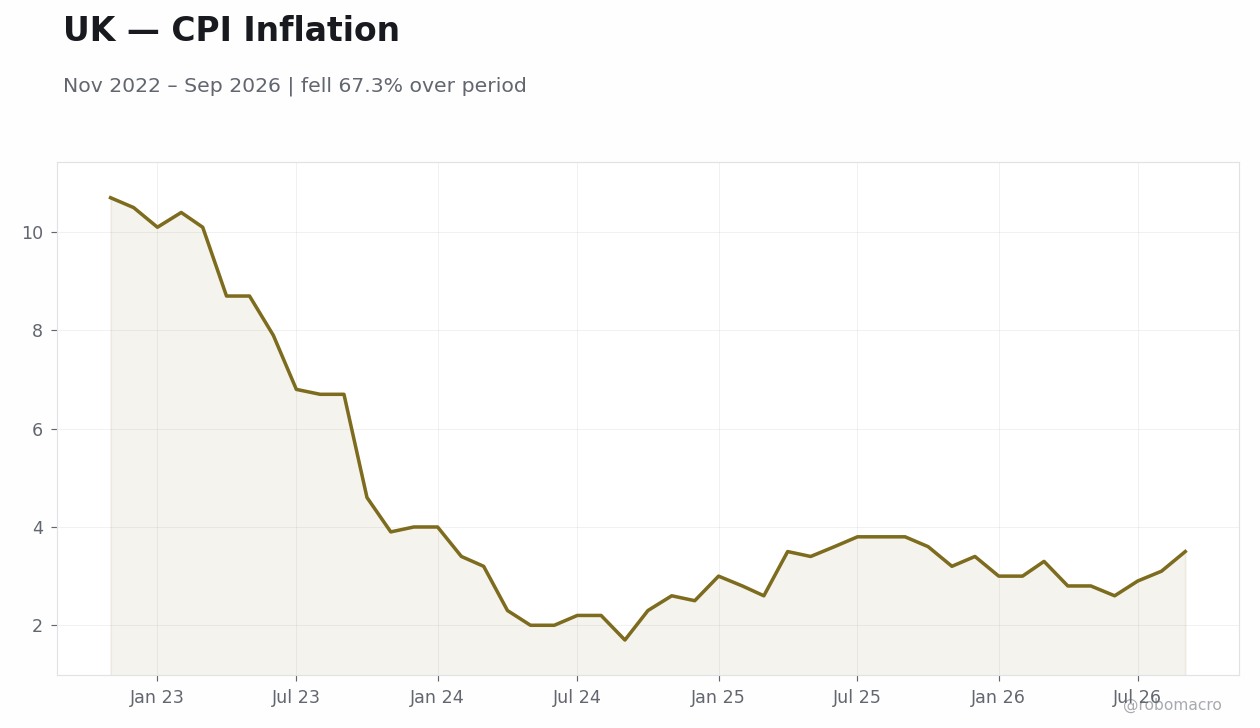
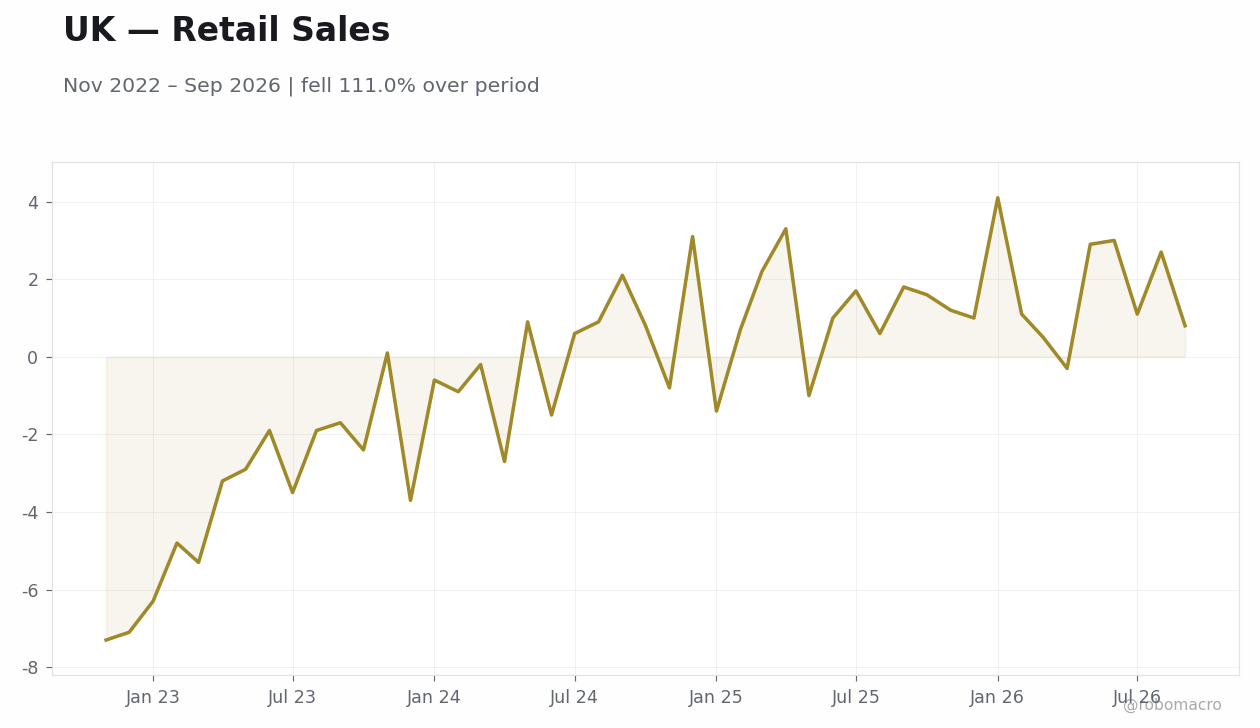
UK markets absorbed a sequence of labor and inflation surprises that shifted the domestic narrative from cooling pressures toward renewed policy vigilance. Labor market shows resilience. The unemployment rate fell in the three months through August, its lowest level since July last year, while wage growth picked up, prompting immediate repricing in sterling and short-dated gilts. Inflation reaccelerates on energy. September CPI printed well above consensus, with the acceleration traced directly to energy and fuel components amid Brent crude’s advance. Policy communication diverges. Governor Bailey’s IMF remarks on subdued second-round effects contrasted with MPC member Greene’s warning that inflation risks exceed prior estimates, leaving markets to parse a split signal. The week began with constructive risk appetite. Tuesday’s decline in the 10-year yield reflected duration buying before the labor data reversed the move. Wednesday’s jobs release drove GBP/USD higher and the 2-year yield higher. Thursday’s CPI print extended sterling gains and steepened the curve. FTSE 100 finished the week at 10738.73, down 0.24% on net, while the domestically oriented FTSE 250 gained 0.49%. Public borrowing also overshot forecasts, adding fiscal pressure ahead of the Budget. The combined data flow leaves the Bank of England on a collision course between resilient activity and imported price shocks.
Governor Andrew Bailey’s remarks at the IMF meetings explicitly flagged second-round inflation pressures as quite subdued, providing a dovish counterweight to the subsequent data. MPC member Greene countered with a warning that inflation risks are larger than previously thought, highlighting the split within the committee. The September CPI print and the unemployment rate together reinforce the case for maintaining the current policy rate setting into the November meeting. Markets responded with front-end gilt yield rises, consistent with a higher probability of no near-term cut. Bailey’s emphasis on subdued domestic price dynamics suggests the Bank will continue to monitor wage and services components closely rather than react mechanically to the headline energy spike. The combination of resilient labor data and above-consensus inflation leaves the medium-term rate path biased toward stability at current levels, with any easing discussion likely deferred. Forward guidance will remain data-dependent, with the next consumer credit and mortgage approvals releases providing fresh inputs on demand transmission.
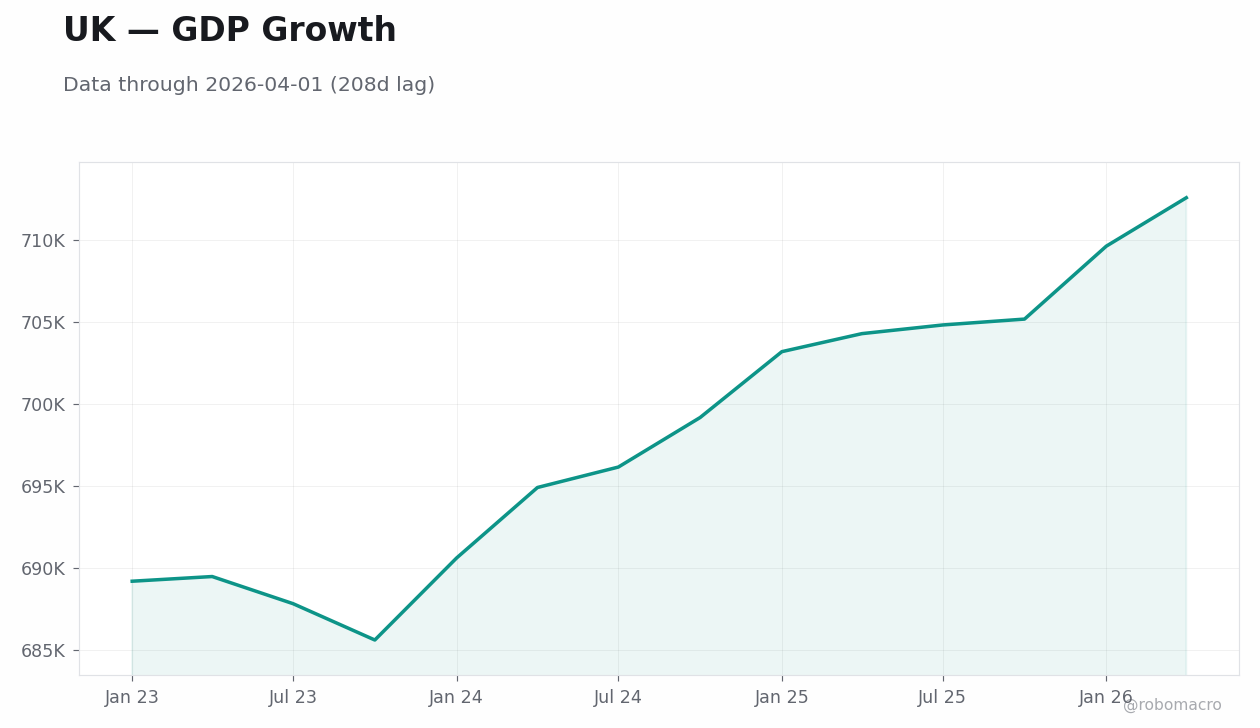
The September CPI release represented the clearest beat, driven by energy and fuel components that lifted the headline well above market expectations. Unemployment came in below consensus and coincided with faster wage growth in the three months through August, pointing to persistent labor tightness. Public-sector borrowing also exceeded forecasts, compounding the inflation signal with fiscal slippage. These prints arrive against a backdrop of August GDP that had surprised positively, suggesting the economy retains momentum into the fourth quarter. The combination implies the output gap is closing more slowly than the Bank of England had projected, keeping services inflation risks elevated. Energy-sensitive components in the CPI basket now feed directly into the medium-term rate path, with the September acceleration likely to delay any easing discussion. Mortgage approvals and consumer credit data scheduled for next week will test whether higher rate expectations are already damping demand. Overall, the data tilt the growth-inflation balance toward the latter, supporting a higher-for-longer policy stance relative to earlier market pricing.
| Date | Ctry | Event | Prior | Cons. | Actual |
|---|---|---|---|---|---|
| Mon 26 | GB | CBI Distributive Trades | -55.0 | -47.0 | -10.0 |
| Mon 26 | GB | BRC Shop Price Inflation | 1.4 | 1.6 | - |
| Tue 27 | GB | Treasury Gilt 2032 Auction | 4.8 | - | - |
| Wed 28 | GB | Autumn Budget 2026 | - | - | - |
| Wed 28 | GB | Car Production Year-over-Y | 6.1 | - | - |
| Thu 29 | GB | BoE Consumer Credit | 2.5bn | - | - |
| Thu 29 | GB | Mortgage Approvals | 55K | 56K | - |
| Thu 29 | GB | Mortgage Lending Level | 4.4bn | - | - |
| Thu 29 | GB | M4 Money Supply Month-over | 0.40 | 0.30 | - |
| Thu 29 | GB | Net Lending to Individuals | 6.9bn | 6.2bn | - |
| Thu 29 | GB | Conventional/Index-Linked | - | - | - |
| Fri 30 | GB | Nationwide Housing Prices | -0.20 | -0.20 | - |
| Fri 30 | GB | Nationwide Housing Prices | 0.80 | - | - |
| Fri 30 | GB | BoE Mills Speech | - | - | - |
| Date | Release | Prior | Cons. |
|---|---|---|---|
| 2026-11-05 | S&P Global Construction PMI | 46.1 | - |
| 2026-11-05 | BoE Interest Rate Decision | 3.8 | 4.0 |
| 2026-11-05 | BoE MPC Vote Cut | - | - |
| 2026-11-05 | BoE MPC Vote Hike | - | - |
| 2026-11-05 | BoE MPC Vote Unchanged | - | - |
| 2026-11-05 | BoE Monetary Policy Report | - | - |
| 2026-11-05 | MPC Meeting Minutes | - | - |
| 2026-11-06 | Lloyds House Price Index Month-over | 0 | - |
| 2026-11-06 | Lloyds House Price Index Year-over- | 0 | - |


Monday brings the CBI Distributive Trades survey. Thursday features BoE consumer credit, mortgage approvals, and mortgage lending figures; these will test whether higher rate expectations are already curbing housing demand. Friday includes the Nationwide house-price indices for October, alongside a speech by BoE’s Mills that could clarify the committee’s reaction function. The Budget scheduled for the following week will dominate positioning, with speculation around banking-sector tax measures adding fiscal uncertainty. Mortgage approvals data will be watched for signs that the 2-year yield level is already affecting credit extension. The Mills speech offers the next opportunity for official commentary on the inflation risks highlighted by Greene. Overall, the calendar tilts toward housing and credit indicators that will inform whether the labor-market strength is feeding through to broader demand.
The week’s inflation and labor surprises have narrowed the gap between market pricing and the Bank of England’s likely November stance, reducing the scope for dovish surprises. Upside risks center on further energy-driven CPI prints if Brent remains elevated, while downside risks hinge on a sharper housing-market slowdown visible in next week’s mortgage data. Positioning appears light in sterling after the weekly gain, leaving room for additional upside if wage growth continues to surprise. Volatility in UK natural gas could re-emerge as a domestic inflation driver. Fiscal slippage shown in the borrowing overshoot raises debt-service costs precisely as the Chancellor confronts limited headroom, potentially crowding out private-sector credit. Market mispricing signals are most evident in the 2-year sector, where the net yield rise understates the cumulative repricing that occurred intraday.
Equities closed mixed, with the FTSE 100 ending at 10738.73 for a net 0.24% decline while the FTSE 250 rose 0.49% to 24499.06, reflecting rotation toward domestic names after the labor beat. Bonds saw a volatile week: the 2-year gilt yield finished higher after rising on net, while the 10-year yield declined as duration buying on Tuesday offset later steepening. Sterling posted modest gains, with GBP/USD at 1.34 for a 0.13% weekly advance and GBP/EUR at 1.19 up 0.40%. GBP/JPY closed at 210.17, down 0.13% on the week. Brent crude rose 0.67% to 110.28, with intraday spikes on supply concerns feeding the UK inflation print. Gold fell 3.05% to 4033.40 as real yields rose, while UK natural gas declined 1.99% to 3.00. Bitcoin ended at 80114.58, down 2.12%. Daily moves included a sterling rally after the jobs data and a 10-year yield jump following the CPI release.
Brent crude’s weekly rise, driven by Middle East supply concerns, directly amplified UK energy inflation and contributed to the CPI print. Global risk sentiment remained mixed, with gold declining as real yields rose, pressuring sterling’s safe-haven status. Nigeria-UK cooperation announcements on digital trade standards offered minor positive spillovers for UK services exports but carried limited near-term market impact. Saudi Arabia’s postponement of statistical forums amid regional tensions added to broader geopolitical uncertainty without altering UK-specific flows. Overall, imported energy prices remain the dominant cross-border channel affecting the domestic inflation outlook.
| Asset | Level | WoW |
|---|---|---|
| OMX Stockholm 30 | 3206.55 | -1.9% |
| Oslo Bors | 2110.68 | +0.6% |
| OMX Copenhagen 25 | 1909.17 | +3.2% |
| OMX Helsinki 25 | 6249.88 | -1.3% |
| USD/SEK | 9.95 | +0.4% |
| USD/NOK | 9.34 | -0.9% |
| EUR/SEK | 11.13 | +0.1% |
| EUR/NOK | 10.45 | -1.2% |
| Brent Crude | 110.3 | +0.7% |
| Gold | 4034.2 | -3.0% |
| Bitcoin | 80140.74 | -2.1% |


Equity and currency tape reflected divergent domestic drivers. Nordic bourses closed the five-day period mixed. The OMX Stockholm 30 declined while the OMX Helsinki 25 also fell; the OMX Copenhagen 25 advanced and the Oslo Bors gained.
FX markets favoured the Norwegian krone over the Swedish krona. USD/NOK declined while USD/SEK rose; EUR/NOK fell and EUR/SEK edged higher. These moves occurred alongside a modest gain in Brent crude.
Fixed-income markets saw limited movement. No Nordic 10-year yield prints were released during the period.
Commodity and risk-asset moves provided secondary context. Gold declined and Bitcoin fell.
Overall data flow remained light. No high-impact Nordic releases occurred, leaving markets to trade primarily on global risk sentiment and commodity price moves.
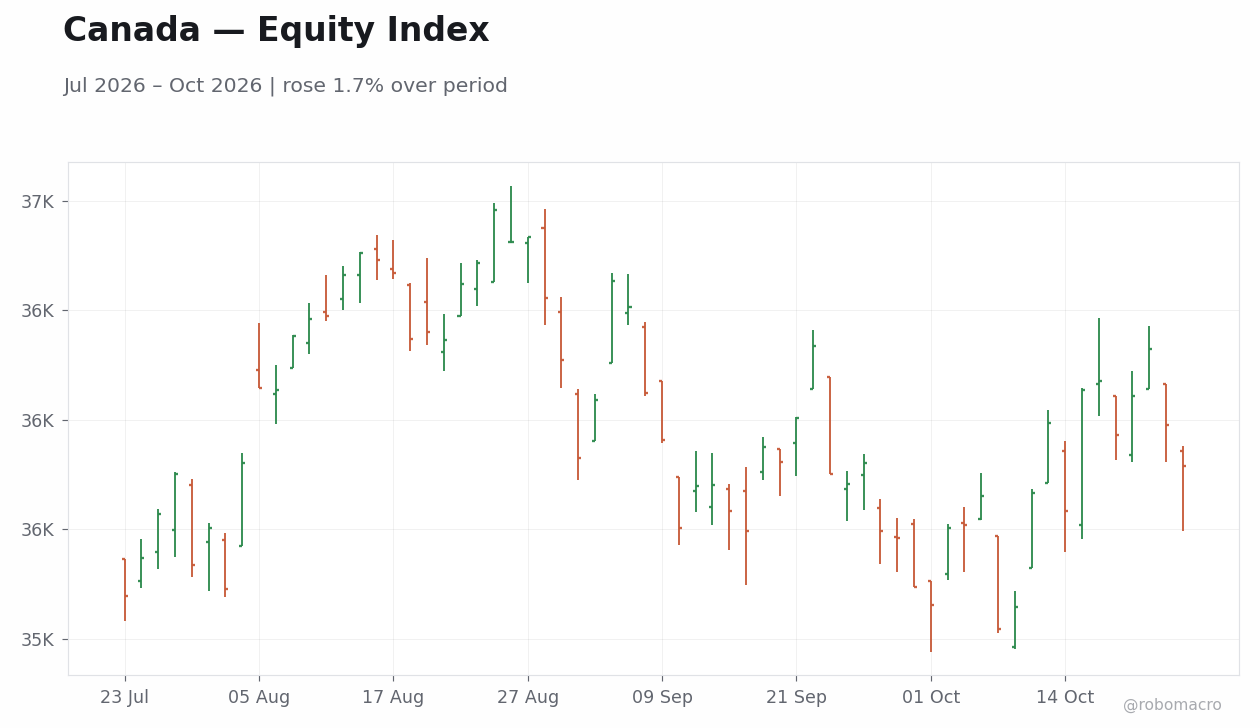
No new inflation or activity data were released for Sweden or Norway. Danmarks Nationalbank and Bank of Finland (ECB) saw no specific commentary or releases, with attention directed at broader euro-area developments. The week’s commodity-price moves offered no direct policy signal but reinforced the external backdrop for Norges Bank considerations at coming meetings.
| Date | Ctry | Event | Prior | Cons. | Actual |
|---|---|---|---|---|---|
| Mon 26 | FI | Export Prices Year-over-Ye | 8.7 | - | - |
| Mon 26 | FI | Import Prices Year-over-Ye | 7.6 | - | - |
| Mon 26 | FI | Producer Price Index Year- | 7.3 | - | - |
| Mon 26 | SE | Producer Price Index Month | 0.90 | - | - |
| Mon 26 | SE | Producer Price Index Year- | 6.8 | - | - |
| Tue 27 | FI | Business Confidence Index | 3.0 | - | - |
| Tue 27 | FI | Consumer Confidence Index | -4.9 | - | - |
| Tue 27 | SE | Household Lending Growth Y | 3.3 | - | - |
| Tue 27 | SE | Trade Balance | -11.9bn | - | - |
| Tue 27 | SE | T-Bill Auction | - | - | - |
| Wed 28 | NO | Loan Growth Year-over-Year | 4.5 | - | - |
| Wed 28 | NO | Retail Sales Month-over-Mo | 0.60 | - | - |
| Wed 28 | NO | Ngb Auction | - | - | - |
| Wed 28 | SE | Sgb Auction | - | - | - |
| Date | Release | Prior | Cons. |
|---|---|---|---|
| 2026-11-04 | Riksbank Rate Decision | 1.8 | - |
| 2026-11-04 | Riksbank Press Conference | - | - |
| 2026-11-05 | Norges Bank Interest Rate Decision | 4.5 | - |

Finland’s Export Prices Year-over-Year, Import Prices Year-over-Year and Producer Price Index Year-over-Year releases on 26 October will provide cost-side signals relevant to price-pressure assessments. No other high-impact Nordic data are scheduled through 1 November, leaving markets to monitor global risk and commodity moves for transmission into local currencies. Brent crude levels near current readings will remain a variable for fiscal-revenue and currency considerations. Officials from all four central banks are expected to maintain limited forward guidance until fresh inflation and activity prints arrive in subsequent weeks.
Divergent equity performance across the region raises the possibility that local market drivers remain differentiated in coming sessions. Upside risks centre on further Brent strength supporting the Norwegian krone, while downside risks include renewed equity weakness pressuring rate-sensitive names in Copenhagen and Stockholm. Limited data releases next week leave room for external shocks, particularly in oil or euro-area yields, to dominate Nordic price action until domestic prints resume.
| Asset | Level | WoW |
|---|---|---|
| BIST 100 | 11082.43 | -3.0% |
| iShares Poland | 43.5 | -1.3% |
| EUR/PLN | 4.4 | +0.9% |
| EUR/HUF | 367.19 | +1.2% |
| EUR/CZK | 24.35 | +0.1% |
| USD/TRY | 49.76 | +0.5% |
| Brent Crude | 110.29 | +0.7% |
| Gold | 4034.4 | -3.0% |
| Bitcoin | 80071.47 | -2.2% |


Hungarian Markets The forint weakened against the euro. Hungarian 10-year yields remained in focus amid fiscal developments.
Polish Data Supports Growth Narrative Polish industrial production data reinforced that the economy retains momentum. EUR/PLN ended the week higher.
Turkish Assets Lag on Oil and Risk Sentiment BIST 100 posted a weekly decline. Brent crude’s move above 110 dollars per barrel added imported-inflation pressure, while USD/TRY edged higher. Czech and Romanian markets stayed quiet with EUR/CZK closing higher.
NBP confirmed gold purchases as it progresses toward its reserve target, a move that supports reserve diversification and zloty credibility. A Polish MPC member noted that further zloty weakening could serve as a rate-hike trigger. CNB, BNR, and CBRT made no policy moves or high-profile speeches during the week. Turkish inflation risks stay elevated given Brent’s weekly close above 110 dollars, keeping CBRT orthodoxy under scrutiny.
The data picture points to stable growth in Poland. Energy-import dependence remains the dominant channel linking Brent moves above 110 dollars to inflation risks in Turkey and the CEE-4. Overall, the week’s releases reinforced a non-recessionary growth backdrop while highlighting fiscal risks in Hungary and external price pressures in Turkey.
| Date | Ctry | Event | Prior | Cons. | Actual |
|---|---|---|---|---|---|
| Mon 26 | CZ | Business Confidence Index | 98.4 | - | - |
| Mon 26 | CZ | Consumer Confidence Index | 105 | - | - |
| Tue 27 | HU | 3-Month Dtb Auction | - | - | - |
| Thu 29 | HU | Producer Price Index Year- | - | - | - |
| Thu 29 | HU | Trade Balance | - | - | - |
| Thu 29 | HU | 10-Year Bond Auction | - | - | - |
| Thu 29 | HU | 3-Year Bond Auction | - | - | - |
| Thu 29 | HU | 5-Year Bond Auction | - | - | - |
| Fri 30 | RO | Headline Unemployment Rate | - | - | - |
| Fri 30 | HU | GDP Growth Quarter-over-Qu | 0.50 | - | - |
| Fri 30 | HU | GDP Growth Year-over-Year | 1.7 | - | - |
| Fri 30 | CZ | GDP Growth Quarter-over-Qu | - | - | - |
| Fri 30 | CZ | GDP Growth Year-over-Year | - | - | - |
| Fri 30 | PL | Inflation Rate Year-over-Y | 4.1 | - | - |
| Date | Release | Prior | Cons. |
|---|---|---|---|
| 2026-11-04 | Central Bank Interest Rate Decision | 3.8 | - |


Turkey’s headline unemployment rate and final balance-of-trade figure are scheduled. Poland’s preliminary inflation rate year-over-year is due. No central-bank rate decisions or high-impact speakers are flagged for the five economies in the coming week. Markets will watch whether Turkish unemployment and trade data alter perceptions of domestic demand and external balances. The Polish inflation print will provide a fresh gauge of price pressures and directly inform NBP’s rate-hold outlook. Czech and Hungarian calendars remain light, leaving regional focus on external factors such as Brent crude and euro-area data spillovers.
Hungary’s fiscal commitments introduce upside risk to the deficit and could pressure the forint further if bond demand weakens. Turkish assets face downside risk from any sustained move in Brent above 110 dollars, given the direct pass-through to inflation. Polish growth momentum reduces near-term recession risk but leaves the zloty vulnerable to any renewed weakening. Volatility in BIST 100 signals ongoing sensitivity to global risk tone and oil prices.
Equities delivered mixed regional performance, with BIST 100 falling and iShares Poland declining. FX markets saw broad euro strength, with EUR/HUF, EUR/PLN and EUR/CZK all advancing. USD/TRY closed higher. Commodities featured Brent crude ending higher after a gain and multiple sessions above 110 dollars, while gold fell. Fixed-income markets showed no clean directional signal. Bitcoin closed lower on the week.
Brent crude’s weekly gain kept imported-inflation risks live for all five energy-dependent economies. Gold’s decline offered limited safe-haven support to regional central banks accumulating reserves. Poland’s push for closer economic ties with Germany and India adds a positive external demand channel. No major geopolitical escalations occurred in the last seven days that directly altered trade or capital-flow dynamics for the region. Euro-area data spillovers remained muted given the thin regional calendar.
| Asset | Level | WoW |
|---|---|---|
| JSE Top 40 | 101158.31 | -0.1% |
| USD/ZAR | 16.62 | +1.0% |
| EUR/ZAR | 18.6 | +0.7% |
| Platinum | 1538.2 | -6.1% |
| Gold | 4034.1 | -3.0% |
| Brent Crude | 110.29 | +0.7% |
| Naspers | 67709.0 | -3.4% |
| Bitcoin | 80112.25 | -2.1% |


Fiscal Anchor Takes Centre Stage The Medium-Term Budget Policy Statement supplied the week’s dominant domestic signal. Finance Minister Godongwana introduced a formal fiscal anchor and reduced weekly bond issuance, measures markets interpreted as credit-positive even as the gross borrowing requirement rose to fund a domestic buyback.
Bond Market Response The combination produced an initial relief rally in government securities, with the Treasury simultaneously announcing temporary fuel-levy relief. These steps directly addressed debt-sustainability concerns and provided a modest disinflationary offset through lower pump prices.
Equity and Currency Moves The JSE Top 40 closed the five-day period at 101158.31, down 0.11% week-on-week. USD/ZAR closed at 16.62, a net 1.01% depreciation that left the currency inside its recent range.
Commodity and External Drivers Platinum fell 6.14% to 1538.2 over the same window while Brent crude rose 0.68% to 110.29, illustrating divergent commodity impulses that partially offset each other in the inflation outlook. Naspers declined 3.4% to 67709, weighing on the equity index.
Data Vacuum and Positioning With no tier-one South African releases scheduled, price action reflected positioning ahead of the budget and global risk sentiment rather than fresh economic prints. Business-sentiment data released mid-week showed stabilisation in September, supported by high precious-metal prices and tourism inflows, yet inflation pressures remained evident.
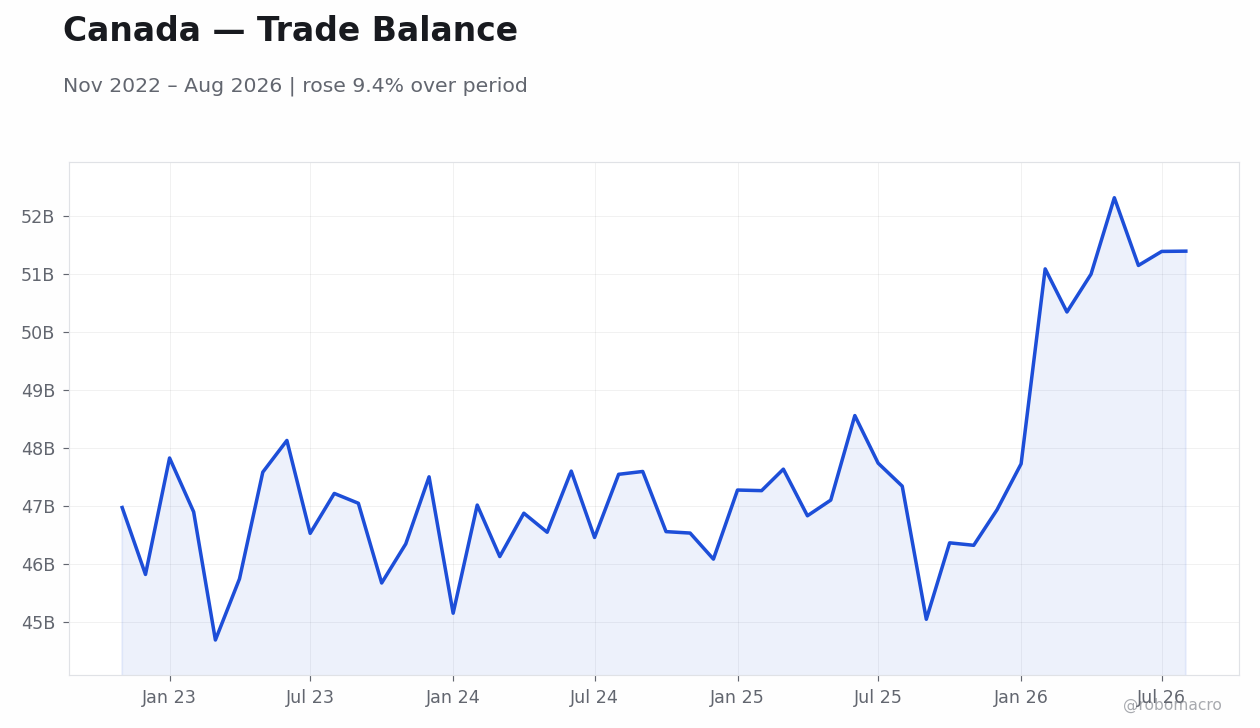
Policy Continuity Signal SARB Governor Kganyago’s public remarks reinforced the central bank’s data-dependent approach, citing an expected CPI decline through 2027. The absence of surprises in either fiscal or monetary communication kept volatility contained and allowed markets to focus on second-order effects of the MTBPS.
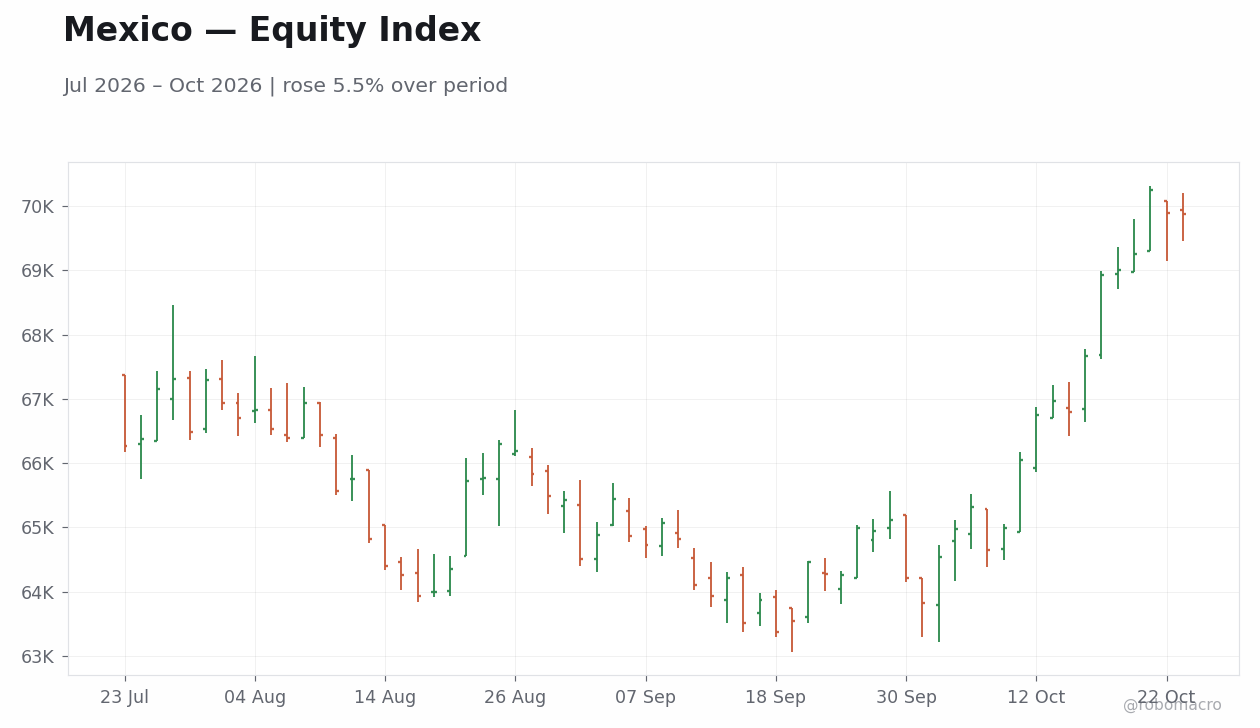
Overall Arc Taken together, the week demonstrated South Africa’s improving fiscal credibility narrative offsetting a still-elevated policy rate and soft growth backdrop, with the rand and bonds absorbing the news constructively while equities remained sensitive to global commodity swings.
Governor Kganyago stated that CPI is projected to decline through 2027, underscoring the SARB’s meeting-by-meeting framework. No Monetary Policy Committee minutes or additional speeches were released during the week, leaving the Governor’s comments as the clearest official signal. The MTBPS fuel-levy cut and lower issuance path supply modest downside pressure on near-term inflation prints, which aligns with the SARB’s communicated expectation of gradual disinflation. Officials have not altered forward guidance, maintaining emphasis on incoming data rather than pre-committing to any specific sequence of adjustments. The combination of fiscal repair and the Governor’s CPI outlook supports a steady policy-rate path absent material deviations in forthcoming inflation or growth releases.
| Date | Ctry | Event | Prior | Cons. | Actual |
|---|---|---|---|---|---|
| Mon 26 | ZA | 182-Day T-Bill Auction | 7.7 | - | - |
| Mon 26 | ZA | 273-Day T-Bill Auction | 8.0 | - | - |
| Mon 26 | ZA | 364-Day T-Bill Auction | 8.1 | - | - |
| Mon 26 | ZA | 91-Day T-Bill Auction | 7.2 | - | - |
| Tue 27 | ZA | Leading Business Cycle Ind | -0.90 | - | - |
| Tue 27 | ZA | 2039 Bond Auction | 9.2 | - | - |
| Tue 27 | ZA | 2040 Bond Auction | 9.2 | - | - |
| Tue 27 | ZA | 2042 Bond Auction | 9.4 | - | - |
| Thu 29 | ZA | M3 Money Supply Year-over- | 8.9 | - | - |
| Thu 29 | ZA | Private Sector Credit Year | 7.5 | - | - |
| Thu 29 | ZA | Producer Price Index Month | -0.40 | - | - |
| Thu 29 | ZA | Producer Price Index Year- | 5.0 | - | - |
| Fri 30 | ZA | Trade Balance | 20.5bn | - | - |
| Fri 30 | ZA | Government Budget Balance | 19.9bn | - | - |


Trade Balance data will provide the first post-budget gauge of external demand and will feed directly into assessments of the current-account trajectory. No other tier-one domestic releases are scheduled in the coming sessions, so attention will remain on global commodity prices and US policy signals. The Trade Balance outcome matters for the SARB because a narrower surplus could reinforce the need for continued vigilance on imported inflation. Market participants will also monitor any follow-up commentary from Treasury on the new fiscal anchor’s implementation details. These elements together shape the growth and inflation backdrop that the SARB will reference at upcoming decisions. The absence of local data leaves the rand and yields sensitive to offshore developments, particularly Brent crude and global risk appetite. Overall, the week is expected to serve as a bridge to the next round of inflation and growth prints that will inform the policy-rate outlook in coming quarters.
The MTBPS fiscal anchor reduces tail-risk around debt sustainability but leaves the higher borrowing requirement as a potential long-end pressure point once initial relief fades. A sharper-than-expected decline in platinum or gold prices could weigh on the JSE Top 40 and rand, given the index’s heavy resource weighting. Conversely, sustained Brent strength would raise imported inflation risks and could challenge the SARB’s disinflation narrative. The AGOA exposure flagged by President Ramaphosa adds a medium-term trade-policy uncertainty that markets have yet to price fully. Current positioning appears to embed modest optimism on fiscal repair; any slippage in primary-balance delivery would therefore represent a clear downside scenario for bonds and the currency.
| Asset | Level | WoW |
|---|---|---|
| ASX 200 | 8809.9 | -0.4% |
| NZX 50 | 13733.93 | +0.6% |
| AUD/USD | 0.7 | +0.8% |
| NZD/USD | 0.57 | +0.4% |
| AUD/NZD | 1.24 | +0.3% |
| BHP | 55.62 | -8.0% |
| Gold | 4034.1 | -3.0% |
| Brent Crude | 110.29 | +0.7% |
| Bitcoin | 80083.92 | -2.2% |


RBA communication turns hawkish. RBA communications reinforced a tighter policy stance. The ASX 200 closed the week lower while BHP declined amid softer iron-ore sentiment. Australian yields moved higher.
New Zealand inflation data delivers a clear disinflation signal. New Zealand inflation data showed a quarterly deceleration. The NZX 50 finished the week higher while NZD/USD gained ground. Core pressures remained above target.
Commodity and equity divergence shaped cross-Tasman flows. Brent crude rose over the week while gold fell, highlighting the split between energy and precious metals that continued to support the Australian dollar. AUD/NZD closed higher. No top-tier Australian data releases occurred during the period, leaving RBA communications and offshore factors as the main AUD drivers.
Equity markets showed limited follow-through to currency gains. The ASX 200 posted mixed daily moves before closing the period lower. NZX 50 recorded a gain mid-week but ended the week only modestly higher. Housing-market data and credit aggregates were flagged as the next domestic focal points.
Overall narrative arc points to divergent policy signals. Australian communications contrasted with New Zealand data, setting up a week in which local yields rose while the disinflation trend in New Zealand remained intact.
RBA communications provided the clearest policy signal of the week and directly preceded the lift in hike probabilities. The comments came ahead of the next RBA meeting and reinforced the view that the central bank sees upside risks to its inflation forecasts. New Zealand inflation data delivered the last major reading before the RBNZ decision. The annual rate remains above target, yet the quarterly deceleration supplies evidence that price pressures are moderating. Officials have not altered forward guidance, so the data alone will shape the rate path assessment at the upcoming meeting. No RBNZ or RBA minutes were released during the period.
| Date | Ctry | Event | Prior | Cons. | Actual |
|---|---|---|---|---|---|
| Mon 26 | NZ | 1-Year Bill Auction | 3.7 | - | - |
| Mon 26 | NZ | 3-Month Treasury Bill Auct | 3.1 | - | - |
| Mon 26 | NZ | 6-Month Treasury Bill Auct | 3.3 | - | - |
| Tue 27 | AU | RBA Senate Appearance | - | - | - |
| Tue 27 | AU | Inflation Rate Month-over- | 0.40 | 0.70 | - |
| Tue 27 | AU | Inflation Rate Year-over-Y | 4.0 | 4.2 | - |
| Tue 27 | AU | RBA Trimmed Mean CPI Month | 0.20 | 0.30 | - |
| Tue 27 | AU | RBA Trimmed Mean CPI Year- | 3.6 | - | - |
| Tue 27 | AU | Consumer Price Index | 104 | - | - |
| Tue 27 | AU | Quarterly Inflation Rate Q | 0.60 | 1.3 | - |
| Tue 27 | AU | Quarterly Inflation Rate Y | 3.9 | 3.9 | - |
| Tue 27 | AU | Quarterly RBA Trimmed Mean | 0.80 | - | - |
| Tue 27 | AU | Quarterly RBA Trimmed Mean | 3.6 | - | - |
| Tue 27 | AU | RBA Weighted Median CPI Mo | 0.30 | - | - |
| Date | Release | Prior | Cons. |
|---|---|---|---|
| 2026-11-02 | RBA Interest Rate Decision | 4.6 | - |
| 2026-11-02 | RBA Press Conference | - | - |
| 2026-11-03 | Employment Change Quarter-over-Quar | 0.50 | - |
| 2026-11-03 | Headline Unemployment Rate | 5.6 | - |
| 2026-11-03 | Ai Group Industry Index | -24.2 | - |
| 2026-11-04 | Trade Balance | 495.0mn | - |


Monday brings Australia Commodity Prices Year-over-Year, offering an early read on export revenue trends that feed directly into RBA growth and inflation projections. Tuesday features the RBA Senate Appearance alongside the September quarter inflation prints. These releases will update the inflation trajectory ahead of the next RBA meeting. Wednesday hosts the RBNZ Interest Rate Decision, with the outcome clarifying how recent inflation data influences the rate path. Thursday’s ANZ Business Confidence survey will gauge business sentiment after the RBNZ decision. Friday’s Australia PPI Quarter-over-Quarter completes the week and supplies an upstream inflation signal relevant to both central banks’ outlooks. The sequence will determine whether the RBA maintains its hawkish tone and whether the RBNZ delivers the expected adjustment at its next meeting.
New Zealand inflation data lowers the probability of an outsized RBNZ move but leaves core inflation above target, creating scope for either a modest hike or a hold. Australian inflation data carries upside risk to the RBA’s narrative and could extend the recent rise in yields. Commodity price volatility remains a key transmission channel: Brent crude supports AUD while any reversal in iron-ore prices could weigh on BHP and the broader ASX 200. A softer-than-expected RBNZ decision would challenge the current pricing embedded in NZD, while an unchanged RBA stance after the inflation prints would test the durability of AUD levels. The data shift this week tilts the balance toward continued RBA caution and a more data-dependent RBNZ path over coming quarters.
| Asset | Level | WoW |
|---|---|---|
| Shanghai Composite | 3697.52 | -0.9% |
| Hang Seng | 23211.81 | -2.8% |
| TAIEX | 46041.43 | -1.7% |
| USD/CNY | 6.66 | -0.5% |
| USD/HKD | 7.84 | -0.0% |
| Copper | 6.52 | -0.3% |
| Brent Crude | 110.33 | +0.7% |
| Gold | 4033.5 | -3.0% |
| Bitcoin | 80083.92 | -2.2% |


Export-led growth masks domestic drag. China’s Q3 GDP accelerated, powered by a surge in exports. Domestic demand remained weak, with property-sector risks drawing fresh comparisons to Japan’s prolonged slump and consumer confidence continuing to weigh on the expansion.
Yuan strength complicates the external engine. The offshore yuan hit a four-year high, reducing the urgency for near-term stimulus as markets priced in the GDP beat. This appreciation occurred even as the PBoC pointed to industrial strength rather than currency weakness as the driver of export gains.
Policy signals turn cautious on stimulus. Beijing scaled back fiscal austerity only slightly last month before delivering a modest additional package, while the IMF’s senior resident representative called for more urgent and forceful measures. HKMA rolled out its “ART” framework for responsible AI governance and named additional offshore yuan primary liquidity providers.
Equities price in the mixed narrative. Onshore and Hong Kong benchmarks gave back early-week gains as regulatory summons on e-commerce pricing practices hit Alibaba shares and broader tech names. Taiwan’s TAIEX declined, with the market closed one day due to Typhoon Champi. Copper’s weekly close corroborated industrial resilience even as equities slipped.
The PBoC highlighted industrial strength rather than currency weakness as the key export driver following the GDP beat, providing no explicit forward guidance on the policy rate. HKMA announced an executive reshuffle placing Darryl Chan in new roles as part of succession planning and designated primary liquidity providers while expanding the yuan repo facility.
CBC maintained its Taiwan 2026 growth forecast amid AI-driven export strength, with no rate signals issued. The stronger Q3 print and yuan appreciation reduce the near-term case for PBoC easing, pointing to a steady policy-rate path over the medium term unless domestic demand data deteriorate further. HKMA’s liquidity operations and AI governance framework reflect a focus on financial stability rather than rate adjustment. No minutes or speeches altered the baseline expectation of unchanged policy rates across the three central banks this week.
China’s Q3 GDP release represented a clear beat versus prior-quarter trends and analyst expectations, driven almost entirely by the export surge. Cumulative GDP reached a five-year high increment, yet the print highlighted the narrow base of growth as imports failed to signal broad domestic demand recovery.
No other high-impact releases occurred during the week, leaving the GDP figure as the dominant data point shaping the cycle view. The acceleration places Beijing on track for its annual target but underscores that the economy remains in a late-cycle phase where external demand compensates for persistent property and consumption weakness.
This data profile supports a steady rather than aggressive policy-rate path from the PBoC, with the stronger print reducing the probability of immediate broad-based easing. Inflation and growth outlooks remain bifurcated, with industrial production holding up while deflationary pressures from the property sector linger. The absence of surprises in other indicators reinforced the view that momentum is externally driven and potentially fragile into Q4.
| Date | Ctry | Event | Prior | Cons. | Actual |
|---|---|---|---|---|---|
| Mon 26 | CN | Communist Party Fifth Plen | - | - | - |
| Mon 26 | CN | Industrial Profits (YTD) Y | 15.7 | - | - |
| Tue 27 | CN | Communist Party Fifth Plen | - | - | - |
| Tue 27 | TW | Consumer Confidence Index | - | - | - |
| Wed 28 | HK | Exports Year-over-Year | 53.0 | - | - |
| Wed 28 | HK | Imports Year-over-Year | 60.0 | - | - |
| Wed 28 | HK | Trade Balance | -71.2bn | - | - |
| Wed 28 | CN | Communist Party Fifth Plen | - | - | - |
| Thu 29 | CN | Communist Party Fifth Plen | - | - | - |
| Fri 30 | TW | GDP Growth Year-over-Year | 12.9 | - | - |
| Fri 30 | CN | NBS Manufacturing PMI | 50.1 | 50.1 | - |
| Fri 30 | CN | NBS Non-Manufacturing PMI | 50.2 | 50.5 | - |
| Fri 30 | CN | NBS General PMI | 50.7 | - | - |
| Date | Release | Prior | Cons. |
|---|---|---|---|
| 2026-11-03 | RatingDog Services PMI | 51.6 | - |
Attention centers on China’s NBS Manufacturing PMI and Non-Manufacturing PMI, both scheduled for October 30, with consensus near 50.1 and 50.5 respectively. The manufacturing reading is expected to hold steady at the prior level, while the non-manufacturing print is forecast to edge higher, offering the first post-GDP gauge of domestic momentum.
These releases will inform whether the export-led Q3 acceleration is carrying into Q4 or whether property and consumption weakness are reasserting themselves. No central-bank speakers from the PBoC, HKMA, or CBC are scheduled, leaving the data to drive positioning. Taiwan export-order trends and any follow-up regulatory statements on e-commerce will also draw focus. Markets will watch for any PBoC liquidity operations that could offset the stronger yuan’s impact on exporters. The PMI outcomes will shape expectations for the medium-term policy-rate trajectory ahead of November data.
The week’s GDP beat and yuan strength have shifted positioning toward reduced near-term stimulus expectations, yet the narrow export base leaves downside risks elevated if external demand fades. Property-sector deflationary pressures remain the dominant domestic risk, with fresh Japan-comparison commentary underscoring the potential for prolonged weakness.
Regulatory scrutiny of e-commerce pricing practices introduced fresh volatility in tech names and could extend to broader consumption support measures. Upside surprises in next week’s PMIs would support the current cycle view, while misses would reinforce calls for more forceful policy action. Market flows show southbound interest persisting despite equity declines, but positioning in the yuan appears stretched after the four-year high. Volatility in copper and Brent crude adds a commodity channel that could amplify growth signals or risks into early November.
Equities closed the week lower across Greater China, with the Shanghai Composite down 0.9% and the CSI 300 declining after a drop on October 22. The Hang Seng fell 2.75% while the TAIEX ended lower.
FX markets saw the clearest move, with USD/CNY declining 0.51% as the yuan hit its four-year high. USD/HKD held near the weak-side peg.
Commodities were mixed: copper closed lower on the week, while Brent crude rose. Gold declined and Bitcoin fell. Daily equity moves included a Shanghai rebound on October 23 after Thursday’s regulatory-driven slide, while the yuan gained to cap the weekly appreciation.
Global trade dynamics supported China’s export surge, with zero-tariff measures boosting South Africa-China flows and Kazakh borrowers issuing yuan debt. No major new geopolitical developments in the last seven days directly altered cross-strait or Hong Kong-mainland linkages.
The IMF’s call for urgent stimulus in China reflected broader concerns over global growth spillovers from weak domestic demand. U.S. diplomatic activity did not disrupt China-Russia energy ties, keeping strategic links intact. Canadian portfolio data cast doubt on coordinated bond-sale narratives, limiting external pressure on Chinese yields. These factors collectively reinforced the export resilience observed in the Q3 print while leaving domestic policy as the key swing factor for the region.
| Asset | Level | WoW |
|---|---|---|
| KOSPI | 5469.47 | -5.2% |
| KOSDAQ | 727.21 | -10.1% |
| USD/KRW | 1324.9 | -0.6% |
| Samsung | 213000.0 | -2.3% |
| SK Hynix | 1275000.0 | -0.2% |
| Brent Crude | 110.33 | +0.7% |
| Gold | 4033.5 | -3.0% |
| Bitcoin | 80126.5 | -2.1% |


BoK decision anchors the week. The Bank of Korea held the policy rate steady after assessing that growth had beaten forecasts and inflation remained contained, delivering a hawkish hold that removed near-term easing pressure. Markets interpreted the explicit flag for future hikes as a tightening bias rather than a pause.
Equity markets fragment. KOSPI closed the review period at 5469.47, down 5.18% week-over-week, while KOSDAQ declined 10.1% to 727.21. Semiconductor names showed sharp divergence, with Samsung at 213000 and SK Hynix at 1275000 after intraday swings that included KRX sidecar activation.
Won reaches multi-year strength. USD/KRW settled at 1324.90, marking a 0.64% weekly gain for the won that marked its strongest level in over two years on robust exporter dollar supply and heavy AI-chip shipments.
Yields ease despite hawkish tone. Government yields declined modestly by week-end, reflecting positioning after the rate decision and softer rate expectations even as Brent crude rose to 110.33.
Export data confirms external resilience. October exports posted a strong increase led by AI semiconductor demand from Samsung and SK Hynix, reinforcing external demand resilience and supporting corporate profit metrics.
Volatility prompts regulatory response. Authorities pledged a crackdown on unfair trading practices following the selloff, while household financial assets remained heavily concentrated in equities.
Sentiment stabilizes after stress. The session tone shifted from acute drawdown pressure to stabilization, though the magnitude of prior losses kept sentiment fragile and foreign flows rotated selectively into chip names.
The Bank of Korea held the policy rate steady and explicitly flagged future hikes after growth exceeded forecasts and inflation stayed contained. Officials highlighted strong export momentum on AI-chip demand as a key support for the outlook. The decision removed near-term easing pressure and reinforced a tightening bias in forward guidance. Bond yields responded with modest declines, suggesting markets had priced a more aggressive path than the committee delivered. Data on improved corporate profits and debt metrics further supported the committee’s assessment of contained balance-sheet stress. The hawkish hold aligns with the won’s multi-year high at 1324.90, which officials noted could ease imported inflation while complicating exporter margins.
| Date | Ctry | Event | Prior | Cons. | Actual |
|---|---|---|---|---|---|
| Mon 26 | KR | Consumer Confidence Index | 107 | - | - |
| Mon 26 | KR | GDP Growth Quarter-over-Qu | 0.60 | 0.70 | - |
| Mon 26 | KR | GDP Growth Year-over-Year | 3.7 | 3.0 | - |
| Mon 26 | KR | 20-Year KTB Auction | 4.5 | - | - |
| Wed 28 | KR | Business Confidence Index | 79.0 | - | - |
| Thu 29 | KR | Industrial Production Mont | -4.8 | - | - |
| Thu 29 | KR | Industrial Production Year | -2.2 | - | - |
| Thu 29 | KR | Retail Sales Month-over-Mo | -1.8 | - | - |
| Sat 31 | KR | Exports Year-over-Year | 83.7 | - | - |
| Sat 31 | KR | Imports Year-over-Year | 26.0 | - | - |
| Sat 31 | KR | Trade Balance | 50.0bn | - | - |
| Date | Release | Prior | Cons. |
|---|---|---|---|
| 2026-11-02 | Inflation Rate Year-over-Year | 2.9 | - |
Consumer Confidence Index and the GDP Growth Quarter-over-Quarter Advance Estimate release early next week and will provide the first read on 2H momentum. The GDP Growth Year-over-Year Advance Estimate follows the same session and will test whether AI-driven export strength is broadening into domestic demand. Business Confidence Index on the subsequent session offers a gauge of corporate sentiment ahead of upcoming decisions. October Exports Year-over-Year data at week-end will confirm whether semiconductor shipments continue to outpace prior prints. These releases matter for the Bank of Korea rate path because stronger-than-expected growth prints would reinforce the recent hawkish hold and reduce scope for near-term easing. Weak consumption or confidence figures could highlight downside risks from the won’s appreciation. Markets will watch for any follow-up comments from officials on how the data shift the balance between external resilience and domestic cooling.
The week’s data shift the outlook toward a higher-for-longer policy rate path, with export strength at odds with equity drawdowns on the KOSPI. Upside scenarios center on sustained AI-chip demand lifting GDP prints above consensus and supporting further won consolidation near current levels. Downside risks include renewed volatility if household equity exposure triggers consumption weakness or if imported inflation from higher crude prices feeds through faster than expected. The market appears to underweight the committee’s explicit hike signal relative to the growth beat, leaving room for repricing if next week’s GDP and export figures confirm resilience. Regulatory focus on trading practices adds a layer of uncertainty for positioning into upcoming decisions.
| Asset | Level | WoW |
|---|---|---|
| JCI | 5373.09 | +7.5% |
| KLCI | 1604.36 | +0.5% |
| STI | 5415.91 | +0.1% |
| USD/IDR | 18115.0 | +0.3% |
| USD/THB | 33.78 | +1.1% |
| USD/MYR | 4.09 | +0.1% |
| USD/PHP | 63.89 | +1.5% |
| USD/SGD | 1.28 | +0.1% |
| Brent Crude | 110.3 | +0.7% |
| Gold | 4032.7 | -3.1% |
| Bitcoin | 80100.89 | -2.1% |


Indonesia equity and FX stress dominated the period. The JCI recorded a net 7.53% advance to close at 5,373.09. USD/IDR finished the week at 18,115.00 after Bank Indonesia intervention.
Regional equity markets showed limited follow-through. The KLCI rose 0.54% over the week to 1,604.36 while the STI gained 0.07% to 5,415.91. USD/THB climbed 1.05% to 33.78 and USD/PHP advanced 1.50% to 63.89, reflecting modest regional currency softening against the dollar.
Policy and liquidity adjustments from Bank Indonesia shaped sentiment. The central bank kept the benchmark rate unchanged and raised the deposit facility rate while cutting reserve requirements, a package released after the rupiah moved higher. The latest CPI print left little room for easing even as higher Brent prices raised imported inflation risks.
Malaysia and Singapore data provided underlying support. Malaysia’s ringgit held near 4.09 after stronger domestic prints, and the KLCI posted steady daily gains. Singapore’s STI closed higher on two sessions, ending at 5,415.91.
Thailand and the Philippines recorded smaller FX moves. USD/THB and USD/PHP advanced on two sessions. No tier-one statistical releases occurred in either economy during the five sessions.
Vietnam and broader ASEAN flows remained secondary. No Vietnam-specific data prints appeared, and regional attention stayed fixed on Indonesia’s MSCI review and BI actions rather than cross-border capital shifts.
Overall the week confirmed Indonesia-specific risk repricing. The combination of the currency threshold breach, equity outflows and subsequent partial recovery produced the clearest through-line, with other ASEAN markets showing only modest transmission.
Bank Indonesia held the policy rate steady and raised the deposit facility rate while cutting reserve requirements to support rupiah stability after the currency moved higher. Officials stated the rupiah remained manageable and reiterated commitment to currency defense without signaling an imminent rate change. No other ASEAN central bank held a policy meeting or released minutes during the week. Bank Negara Malaysia maintained its hawkish bias in public commentary, with the overnight policy rate path still viewed as dependent on incoming inflation and trade data. The Bangko Sentral ng Pilipinas continued to be described by external observers as among the more hawkish in the region, though no new forward guidance emerged. The latest CPI print for Indonesia and elevated Brent levels reinforced the case for BI to keep policy settings tight into the next decision round.
| Date | Ctry | Event | Prior | Cons. | Actual |
|---|---|---|---|---|---|
| Mon 26 | TH | Exports Year-over-Year | 24.3 | 17.9 | - |
| Mon 26 | TH | Imports Year-over-Year | 25.1 | 31.3 | - |
| Mon 26 | TH | New Car Sales Year-over-Ye | 25.6 | - | - |
| Mon 26 | TH | Trade Balance | -2.5bn | -1.8bn | - |
| Tue 27 | SG | MAS 12-Week Bill Auction | - | - | - |
| Tue 27 | SG | MAS 4-Week Bill Auction | - | - | - |
| Tue 27 | SG | Mas 36-Week Bill Auction | - | - | - |
| Wed 28 | MY | Producer Price Index Year- | 10.7 | - | - |
| Wed 28 | SG | 5-Year Bond Auction | 1.8 | - | - |
| Wed 28 | TH | Central Bank Interest Rate | 1.0 | - | - |
| Wed 28 | SG | Export Prices Year-over-Ye | - | - | - |
| Wed 28 | SG | Import Prices Year-over-Ye | - | - | - |
| Wed 28 | SG | Producer Price Index Year- | - | - | - |
| Thu 29 | PH | Exports Year-over-Year | - | - | - |
| Date | Release | Prior | Cons. |
|---|---|---|---|
| 2026-11-04 | Inflation Rate Year-over-Year | 7.2 | - |
| 2026-11-04 | GDP Growth Year-over-Year | 5.3 | - |
| 2026-11-05 | Central Bank Interest Rate Decision | 2.8 | - |
| 2026-11-05 | Headline Unemployment Rate | 5.3 | - |

Thailand’s central bank interest rate decision is scheduled with markets watching for any shift in forward guidance on growth support versus inflation containment. No other high-impact ASEAN statistical releases are listed for the coming sessions, leaving central bank communications as the primary focus. Bank Indonesia officials are expected to provide further updates on liquidity tools and rupiah management following the recent intervention. Bank Negara Malaysia’s upcoming meeting will be assessed against the latest trade and inflation prints that showed contained price pressures. The Bangko Sentral ng Pilipinas and Monetary Authority of Singapore are not scheduled for decisions, but any speeches will be parsed for signals on the rate path in coming quarters. State Bank of Vietnam’s easing bias noted earlier in the month will remain in view given the absence of new data. Overall the light calendar means policy signals from the six central banks will carry greater weight for rate expectations than incoming numbers.
| Asset | Level | WoW |
|---|---|---|
| Nifty 50 | 22753.2 | -0.6% |
| Sensex | 73606.75 | -0.3% |
| USD/INR | 95.21 | +0.2% |
| EUR/INR | 106.66 | +0.0% |
| Reliance | 1201.8 | -0.0% |
| HDFC Bank | 688.05 | -3.4% |
| Brent Crude | 110.3 | +0.7% |
| Gold | 4032.6 | -3.1% |
| Bitcoin | 80085.33 | -2.2% |


Equity and currency pressure from external shocks Indian equities declined through the week as Brent crude advanced before settling higher. Nifty 50 and Sensex both finished lower on a Friday-to-Friday basis. The moves erased earlier gains and left both benchmarks in negative territory.
Rupee defense amid intervention and inflows USD/INR closed the period higher after RBI steps and Jio Platforms IPO inflows. The currency posted a six-week high mid-week before reversing. Forward premiums rose following tightened forex rules, adding costs for importers and borrowers.
Liquidity conditions tightened Banks accessed the RBI’s first cash auction in three months as market rates spiked. No scheduled macroeconomic releases printed during the week, leaving flows, crude prices, and policy signals as the dominant drivers. HDFC Bank shares fell while Reliance ended nearly flat.
Growth and inflation backdrop September industrial output and services activity remained resilient according to available indicators. The RBI Bulletin highlighted strong macroeconomic fundamentals and policy interventions supporting the economy. Private-sector activity reached a four-month high in the HSBC flash PMI print released after the period, with new orders rising and price pressures easing.
RBI October minutes signaled a continued tightening bias while explicitly cautioning against an aggressive hiking cycle given sticky inflation. The policy rate remained unchanged through the week. Multiple rounds of forex intervention supported the rupee, with the central bank also conducting variable-rate operations to manage liquidity after the first cash auction in three months. Officials noted that using the rupee as a stabilizer risks real-economy costs, consistent with the observed tightening of forex rules. September activity data showing resilient output reinforced the view that external price pressures, rather than domestic demand weakness, are the primary near-term concern for the rate path.
| Date | Ctry | Event | Prior | Cons. | Actual |
|---|---|---|---|---|---|
| Wed 28 | IN | Industrial Production Year | 8.0 | - | - |
| Wed 28 | IN | Manufacturing Production Y | 9.0 | - | - |
| Fri 30 | IN | Government Budget Value | -7102.5bn | - | - |
| Fri 30 | IN | Bank Loan Growth Year-over | 19.4 | - | - |
| Fri 30 | IN | Deposit Growth Year-over-Y | 17.8 | - | - |
| Fri 30 | IN | Foreign Exchange Reserves | 721.0bn | - | - |

HSBC Manufacturing PMI Final is scheduled for release early in the period and will update the services and manufacturing pulse already flagged in the flash survey. The data will inform views on whether recent oil-driven inflation risks are feeding into domestic price and output trends ahead of upcoming decisions. Traders will monitor any follow-up liquidity operations or forex guidance from the central bank as USD/INR remains elevated. No other high-impact Indian releases appear on the immediate calendar.
The week’s oil surge highlighted the terms-of-trade vulnerability that could pressure margins and CPI if sustained. RBI intervention successfully capped rupee depreciation but at the cost of tighter liquidity and higher forward premiums, shifting the policy mix toward currency defense. Equity underperformance concentrated in rate-sensitive names such as HDFC Bank, suggesting markets are already pricing tighter financial conditions. Upside risks center on continued Jio-related inflows supporting the rupee and allowing policy focus to remain on growth. Downside risks include further Brent advances that could force additional tightening signals in the next set of communications. The data gap during the week leaves the industrial production release as the key swing factor for the near-term growth and rate outlook.
| Asset | Level | WoW |
|---|---|---|
| BIST 100 | 11081.32 | -3.0% |
| USD/TRY | 49.76 | +0.5% |
| EUR/TRY | 55.73 | +0.3% |
| GBP/TRY | 66.43 | +0.6% |
| Gold (TRY) | 4031.8 | -3.1% |
| Brent Crude | 110.3 | +0.7% |
| EUR/USD | 1.12 | -0.3% |
| Bitcoin | 80107.09 | -2.1% |


Equity Market Pressure The BIST 100 declined 3.05% over the week to close at 11,081.32. Losses accelerated mid-week after the regulator lifted the qualified-investor threshold fivefold, removing leverage from retail funds and erasing equity value across the board.
FX and Commodity Moves USD/TRY rose 0.48% to 49.76. EUR/TRY advanced 0.26% to 55.73 while GBP/TRY gained 0.61% to 66.43. Gold priced in lira fell 3.08% to 4,031.80, tracking the equity decline rather than global bullion prices.
Geopolitical Overlay Turkish Foreign Minister Hakan Fidan, backed by six European and Middle Eastern counterparts, warned against renewed strikes on Iran and stated that diplomacy remains the only viable channel. Defence Minister Yasar Guler separately clarified that Turkish forces will not engage Houthis under the Saudi pact, limiting any immediate fiscal or security-spending impulse.
Data Calendar Silence No high-impact Turkish releases printed during the five-day window. The absence of fresh inflation, activity or fiscal prints left the prior growth and price trajectory intact for Central Bank of the Republic of Turkey deliberations.
No Central Bank of the Republic of Turkey officials spoke and no minutes were released. The Headline Unemployment Rate and Balance of Trade Final scheduled for the following days will supply the next concrete inputs on labour-market slack and external balances. Those prints will feed directly into the assessment of demand pressures ahead of upcoming decisions. Officials have previously tied policy adjustments to sustained declines in core inflation and external deficits; the current data gap therefore preserves the existing signal until the releases arrive. The regulatory tightening on qualified investors does not alter the monetary-policy mandate but may indirectly affect credit transmission through reduced leverage in capital markets.
| Date | Ctry | Event | Prior | Cons. | Actual |
|---|---|---|---|---|---|
| Tue 27 | TR | Headline Unemployment Rate | 7.8 | - | - |
| Tue 27 | TR | Labor Force Participation | 52.5 | - | - |
| Wed 28 | TR | Balance of Trade Final | -5.2bn | -5.2bn | - |
| Wed 28 | TR | Exports Final | 23.5bn | 26.0bn | - |
| Wed 28 | TR | Imports Final | 28.7bn | 31.2bn | - |
| Fri 30 | TR | Economic Confidence Index | 101 | - | - |
| Fri 30 | TR | Tourism Revenues | 15.9bn | - | - |
| Fri 30 | TR | Tourist Arrivals Year-over | -0.03 | - | - |
| Fri 30 | TR | MPC Meeting Summary | - | - | - |
| Date | Release | Prior | Cons. |
|---|---|---|---|
| 2026-11-03 | Inflation Rate Month-over-Month | 1.8 | - |
| 2026-11-03 | Inflation Rate Year-over-Year | 29.7 | - |
Headline Unemployment Rate prints on 27 October; any material deviation will update estimates of labour-market slack feeding into the next Central Bank of the Republic of Turkey meeting. Balance of Trade Final follows on 28 October and will clarify whether the external deficit continues to narrow. Both releases arrive before the subsequent policy decision and will shape the assessment of demand and imported-price pressures. Markets will also monitor any follow-through comments from Central Bank of the Republic of Turkey speakers on the inflation trajectory. The combination of labour and trade data should provide the clearest read yet on whether domestic demand is moderating at the pace required for coming quarters. Absent surprises, the path to the next decision remains data-dependent rather than pre-committed.
The fivefold increase in the qualified-investor threshold introduces downside risk to domestic equity holdings and could tighten credit conditions faster than expected. Geopolitical statements reduce the probability of direct military outlays but leave open the chance of renewed regional tensions that would pressure the lira and imported inflation. With no fresh activity data this week, the growth outlook rests on the prior quarter’s trajectory; a weaker-than-expected unemployment print could shift the balance toward earlier easing. Conversely, a narrower trade deficit would support the current policy stance. The market’s limited reaction to the regulatory change suggests the full impact on leverage and capital flows may still be under-appreciated.
| Asset | Level | WoW |
|---|---|---|
| Saudi Aramco | 25.6 | -0.8% |
| MSCI Saudi | 33.69 | -4.1% |
| MSCI UAE | 19.05 | -2.9% |
| MSCI Qatar | 15.18 | -0.9% |
| MSCI Kuwait | 34.32 | -1.6% |
| Brent Crude | 110.3 | +0.7% |
| WTI Crude | 101.3 | -2.3% |
| Gold | 4030.7 | -3.1% |
| USD/SAR | 3.75 | +3.2% |
| USD/AED | 3.67 | +0.0% |
| USD/KWD | 0.31 | -0.8% |
| Bitcoin | 80098.6 | -2.1% |


Equity benchmarks post broad declines MSCI Saudi fell 4.13% to 33.69. MSCI UAE declined 2.86% to 19.05. MSCI Qatar fell 0.91% to 15.18. MSCI Kuwait declined 1.62% to 34.32. Saudi Aramco shares closed at 25.6, down 0.78% for the week.
Oil prices diverge Brent crude rose 0.68% to 110.3. WTI declined 2.28% to 101.3.
Calendar quiet on high-impact GCC releases No high-impact statistical releases from GCC countries printed during the week.
No GCC central bank minutes, decisions, or speeches altered the existing policy stance during the week. The data flow leaves the rate path unchanged.
| Date | Ctry | Event | Prior | Cons. | Actual |
|---|---|---|---|---|---|
| Mon 26 | SA | Exports Level | 84.4bn | - | 87.2bn |
| Mon 26 | SA | Imports Level | 70.0bn | - | 71.6bn |
| Mon 26 | SA | Trade Balance | 14.4bn | - | 15.6bn |
| Thu 29 | SA | M3 Money Supply Year-over- | 5.6 | - | - |
| Thu 29 | SA | Private Bank Lending Year- | 6.0 | - | - |
| Sun 1 | SA | GDP Growth Year-over-Year | -4.7 | - | - |

Saudi Arabia's GDP Growth Year-over-Year Preliminary release is scheduled for November 1. The print will inform assessments of growth momentum. Qatar's ongoing LNG supply arrangements will continue to shape energy-sector flows. UAE and Kuwait equity listings and IPO activity are expected to test whether non-oil momentum holds. No other high-impact GCC data are scheduled between October 26 and October 30.
Brent's level above 110 contrasted with WTI weakness. Differentiation in equity performance across GCC benchmarks highlights varying market responses. Officials' messaging on economic resilience has so far contained market moves.
| Time | Country | Event | Our Est. | Consensus | Prior | Impact |
|---|---|---|---|---|---|---|
| MONDAY, NOVEMBER 2 | ||||||
| 01:00 | 🇷🇺 | S&P Global Manufacturing PMI Index | — | — | 49.8 | ●●○ |
| 02:00 | 🇩🇪 | Retail Sales Month-over-Month | — | — | 1.3 | ●●○ |
| 02:00 | 🇩🇪 | Retail Sales Year-over-Year | — | — | -0.40 | ●●○ |
| 03:15 | 🇪🇸 | S&P Global Manufacturing PMI Index | — | — | 51 | ●●○ |
| 03:30 | 🇨🇭 | procure.ch Manufacturing PMI | — | — | 55.3 | ●●○ |
| 03:45 | 🇮🇹 | S&P Global Manufacturing PMI Index | — | — | 50.4 | ●●○ |
| 09:00 | 🇺🇸 | ISM Manufacturing PMI | — | — | 54.5 | ●●● |
| 09:00 | 🇺🇸 | ISM Manufacturing Employment | — | — | 52.7 | ●●○ |
| 09:30 | 🇨🇦 | S&P Global Manufacturing PMI Index | — | — | 51.5 | ●●○ |
| 11:15 | 🇺🇸 | Fed Goolsbee Speech CB | — | — | — | ●●● |
| 18:00 | 🇰🇷 | Inflation Rate Year-over-Year | — | — | 2.9 | ●●○ |
| 22:30 | 🇦🇺 | RBA Interest Rate Decision CB | — | — | 4.6 | ●●● |
| 23:30 | 🇦🇺 | RBA Press Conference CB | — | — | — | ●●● |
| TUESDAY, NOVEMBER 3 | ||||||
| 02:00 | 🇹🇷 | Inflation Rate Month-over-Month | — | — | 1.8 | ●●○ |
| 02:00 | 🇹🇷 | Inflation Rate Year-over-Year | — | — | 29.7 | ●●○ |
| 02:30 | 🇨🇭 | Inflation Rate Year-over-Year | — | — | 1 | ●●○ |
| 06:30 | 🇧🇷 | BCB Focus Market Readout | — | — | — | ●●○ |
| 07:00 | 🇲🇽 | Business Confidence Index | — | — | 48 | ●●○ |
| 10:00 | 🇺🇸 | JOLTs Job Openings | — | — | 7.1M | ●●● |
| 10:00 | 🇺🇸 | Factory Orders Month-over-Month | — | — | 0.10 | ●●○ |
| 15:30 | 🇺🇸 | API Weekly Crude Oil Stocks | — | — | — | ●●○ |
| 16:45 | 🇳🇿 | Employment Change Quarter-over-Quarter | — | — | 0.50 | ●●○ |
| 16:45 | 🇳🇿 | Headline Unemployment Rate | — | — | 5.6 | ●●○ |
| 17:00 | 🇦🇺 | Ai Group Industry Index | — | — | -24.2 | ●●○ |
| 20:45 | 🇨🇳 | RatingDog Services PMI | — | — | 51.6 | ●●○ |
| WEDNESDAY, NOVEMBER 4 | ||||||
| 00:30 | 🇳🇱 | Inflation Rate Year-over-Year Preliminary | — | — | 3.4 | ●●○ |
| 03:00 | 🇪🇸 | Unemployment Level Change | — | — | 23,587 | ●●○ |
| 03:15 | 🇪🇸 | S&P Global Services PMI | — | — | 58.3 | ●●○ |
| 03:30 | 🇸🇪 | Riksbank Rate Decision CB | — | — | 1.8 | ●●● |
| 03:45 | 🇮🇹 | S&P Global Services PMI | — | — | 51.7 | ●●○ |
| 05:00 | 🇸🇪 | Riksbank Press Conference CB | — | — | — | ●●● |
| 06:00 | 🇺🇸 | MBA 30-Year Mortgage Rate | — | — | — | ●●○ |
| 07:00 | 🇲🇽 | Consumer Confidence Index | — | — | 45.1 | ●●○ |
| 08:15 | 🇺🇸 | ADP Employment Change | — | — | 90,000 | ●●○ |
| 08:30 | 🇨🇦 | Trade Balance | — | — | 4.2B | ●●○ |
| 08:30 | 🇺🇸 | Exports Level | — | — | 315.2B | ●●○ |
| 08:30 | 🇺🇸 | Imports Level | — | — | 420.8B | ●●○ |
| 08:30 | 🇺🇸 | Trade Balance | — | — | -105.6B | ●●○ |
| 09:00 | 🇵🇱 | Central Bank Interest Rate Decision CB | — | — | 3.8 | ●●● |
| 09:00 | 🇺🇸 | Services Sector PMI | — | — | 54.9 | ●●● |
| 09:30 | 🇺🇸 | EIA Weekly Crude Oil Inventory | — | — | — | ●●○ |
| 09:30 | 🇺🇸 | EIA Weekly Gasoline Inventory | — | — | — | ●●○ |
| 16:30 | 🇧🇷 | Central Bank Interest Rate Decision CB | — | — | — | ●●● |
| 18:50 | 🇯🇵 | BoJ Monetary Policy Meeting Minutes CB | — | — | — | ●●● |
| 19:30 | 🇦🇺 | Trade Balance | — | — | 495.0M | ●●● |
| 20:00 | 🇵🇭 | Inflation Rate Year-over-Year | — | — | 7.2 | ●●○ |
| 23:00 | 🇮🇩 | GDP Growth Year-over-Year | — | — | 5.3 | ●●○ |
| Time | Country | Event | Our Est. | Consensus | Prior | Impact |
|---|---|---|---|---|---|---|
| THURSDAY, NOVEMBER 5 | ||||||
| 02:00 | 🇩🇪 | Factory Orders Month-over-Month | — | — | -10.6 | ●●○ |
| 02:00 | 🇲🇾 | Central Bank Interest Rate Decision CB | — | — | 2.8 | ●●● |
| 02:45 | 🇫🇷 | Industrial Production Month-over-Month | — | — | -0.30 | ●●○ |
| 03:00 | 🇨🇭 | Headline Unemployment Rate | — | — | 3 | ●●○ |
| 04:00 | 🇮🇹 | Retail Sales Month-over-Month | — | — | 0.30 | ●●○ |
| 04:00 | 🇳🇴 | Norges Bank Interest Rate Decision CB | — | — | 4.5 | ●●● |
| 04:30 | 🇬🇧 | S&P Global Construction PMI | — | — | 46.1 | ●●○ |
| 07:00 | 🇧🇷 | Industrial Production Month-over-Month | — | — | -0.60 | ●●○ |
| 07:00 | 🇬🇧 | BoE Interest Rate Decision CB | — | 4 | 3.8 | ●●● |
| 07:00 | 🇬🇧 | BoE MPC Vote Cut | — | — | — | ●●○ |
| 07:00 | 🇬🇧 | BoE MPC Vote Hike | — | — | — | ●●○ |
| 07:00 | 🇬🇧 | BoE MPC Vote Unchanged | — | — | — | ●●○ |
| 07:00 | 🇬🇧 | BoE Monetary Policy Report | — | — | — | ●●○ |
| 07:00 | 🇬🇧 | MPC Meeting Minutes | — | — | — | ●●○ |
| 08:00 | 🇧🇷 | S&P Global Services PMI | — | — | 49.2 | ●●○ |
| 08:30 | 🇺🇸 | Nonfarm Productivity Quarter-over-Quarter Prel | — | — | — | ●●○ |
| 08:30 | 🇺🇸 | Weekly Jobless Claims | — | — | — | ●●○ |
| 09:10 | 🇺🇸 | Speech by Fed's Barkin | — | — | — | ●●○ |
| 14:00 | 🇲🇽 | Central Bank Interest Rate Decision CB | — | — | 6.5 | ●●● |
| 20:00 | 🇵🇭 | Headline Unemployment Rate | — | — | 5.3 | ●●○ |
| FRIDAY, NOVEMBER 6 | ||||||
| 02:00 | 🇩🇪 | Industrial Production Month-over-Month | — | — | 2 | ●●○ |
| 02:00 | 🇬🇧 | Lloyds House Price Index Month-over-Month | — | — | 0 | ●●○ |
| 02:00 | 🇬🇧 | Lloyds House Price Index Year-over-Year | — | — | 0 | ●●○ |
| 02:45 | 🇫🇷 | Trade Balance | — | — | -6.1B | ●●○ |
| 03:00 | 🇨🇭 | Consumer Confidence Index | — | — | -36 | ●●○ |
| 08:30 | 🇨🇦 | Headline Unemployment Rate | — | — | 6.5 | ●●● |
| 08:30 | 🇨🇦 | Employment Change | — | — | -68,300 | ●●○ |
| 08:30 | 🇨🇦 | Full-Time Employment Change | — | — | -35,400 | ●●○ |
| 08:30 | 🇨🇦 | Labor Force Participation | — | — | 64.8 | ●●○ |
| 08:30 | 🇨🇦 | Part-Time Employment Change | — | — | -32,900 | ●●○ |
| 08:30 | 🇺🇸 | Headline Unemployment Rate | 4.2% M | — | 4.2 | ●●● |
| 08:30 | 🇺🇸 | Payroll Jobs Growth | — | — | 29,000 | ●●● |
| 08:30 | 🇺🇸 | Annual Wage Growth | — | — | 3 | ●●○ |
| 08:30 | 🇺🇸 | Labor Force Participation | — | — | 61.8 | ●●○ |
| 08:30 | 🇺🇸 | Monthly Wage Growth | — | — | 0.10 | ●●○ |
| 10:00 | 🇨🇦 | Ivey PMI Seasonally Adjusted | — | — | 58.2 | ●●● |
| 10:00 | 🇺🇸 | Michigan Consumer Sentiment Prel | — | — | 48 | ●●● |
| 13:00 | 🇧🇷 | Trade Balance | — | — | 7.7B | ●●○ |
AI-Generated Content: This publication is 100% generated by artificial intelligence systems and should not be considered as financial advice, investment recommendation, or professional research. All analysis, forecasts, and commentary are algorithmically produced.
Data Sources: Market data from public exchange and market-data providers. US Treasury yields from the Federal Reserve (FRED constant-maturity series). Macroeconomic data from central banks and national statistics offices. Economic calendar data from RoboMacro Economic Calendar. All data subject to revision and may be delayed.
No Warranty: RoboMacro makes no warranty, express or implied, regarding the accuracy, completeness, or reliability of the information contained in this publication. Data may be delayed, incomplete, or contain errors. Past performance is not indicative of future results.
Not Financial Advice: Nothing in this publication constitutes investment advice, tax advice, legal advice, or any other form of professional advice. Any opinions expressed are AI-generated and do not represent the views of any individual or organisation. Readers should consult qualified professionals before making investment decisions.
Nowcasts and Model Output: The US labour nowcast is the median of a ten-model ensemble. Activity indices are composite z-scores of weekly public high-frequency indicators, seasonally adjusted, published only for weeks meeting a minimum indicator-coverage threshold; the as-of date and coverage are shown on every row. All model output carries significant uncertainty.
Contact: [email protected] | robomacro.com
Publication: Global Macro Watch is published weekly on Sundays, covering the preceding Monday-to-Friday week. © 2026 RoboMacro. All rights reserved.