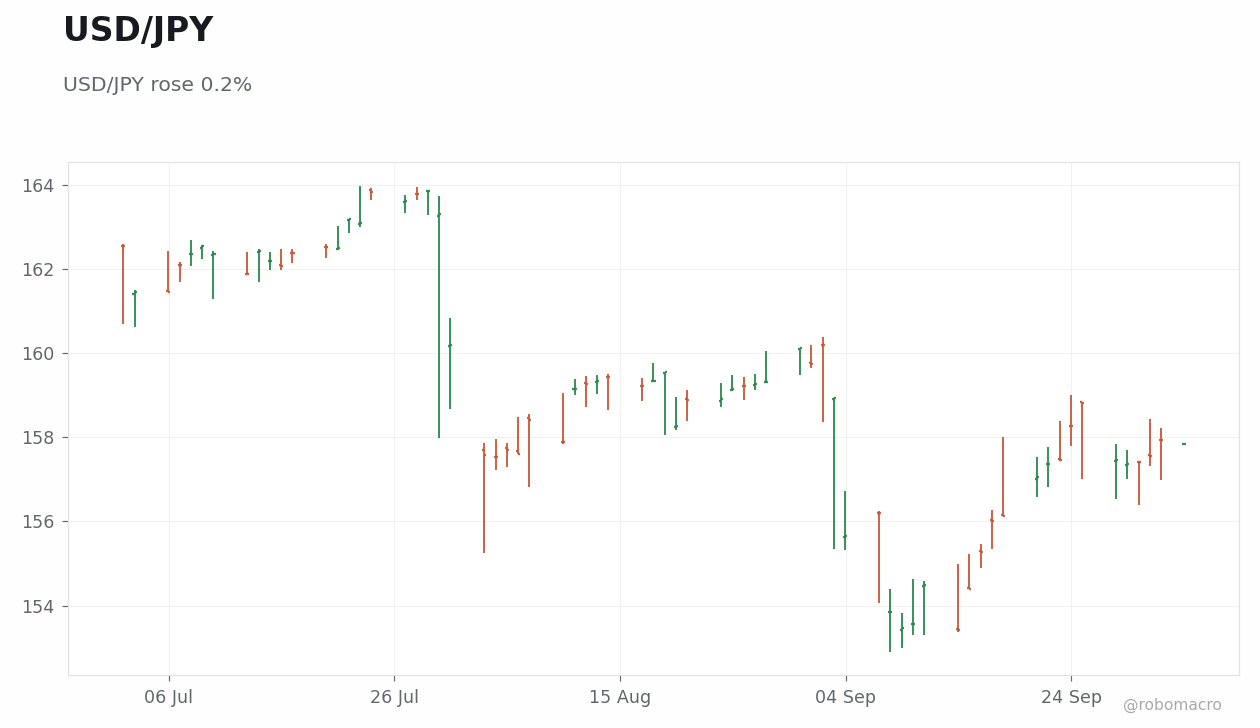
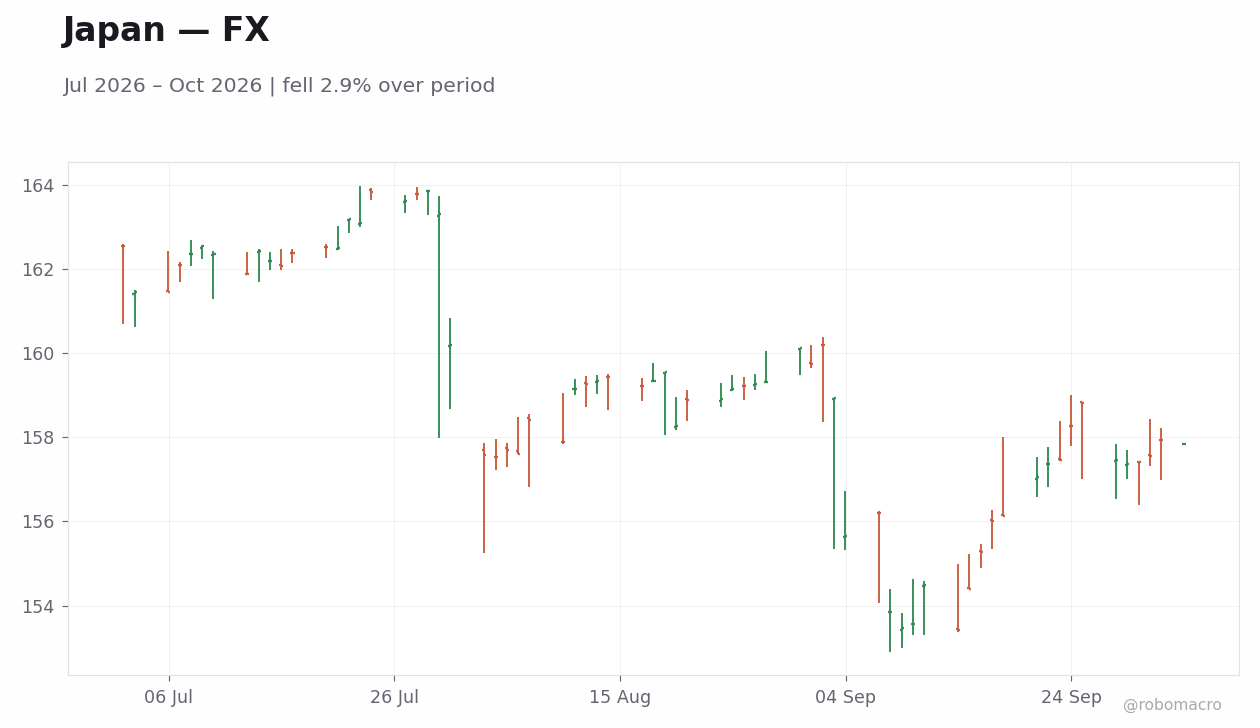
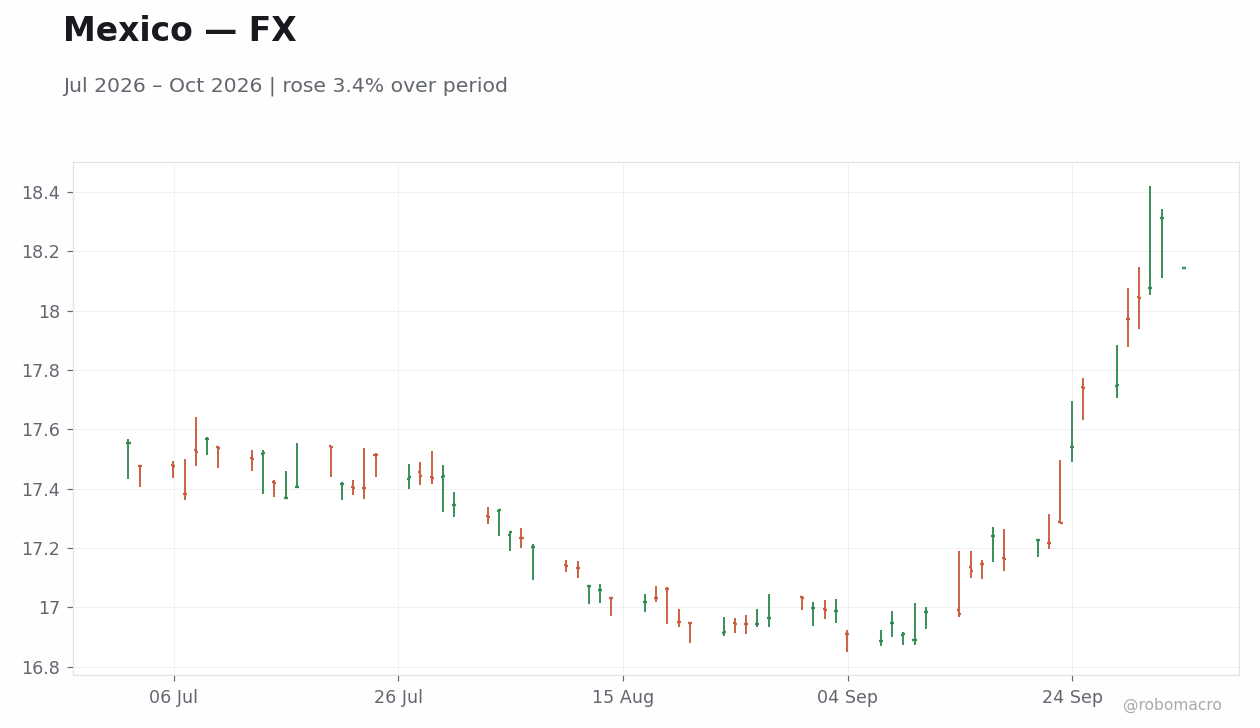
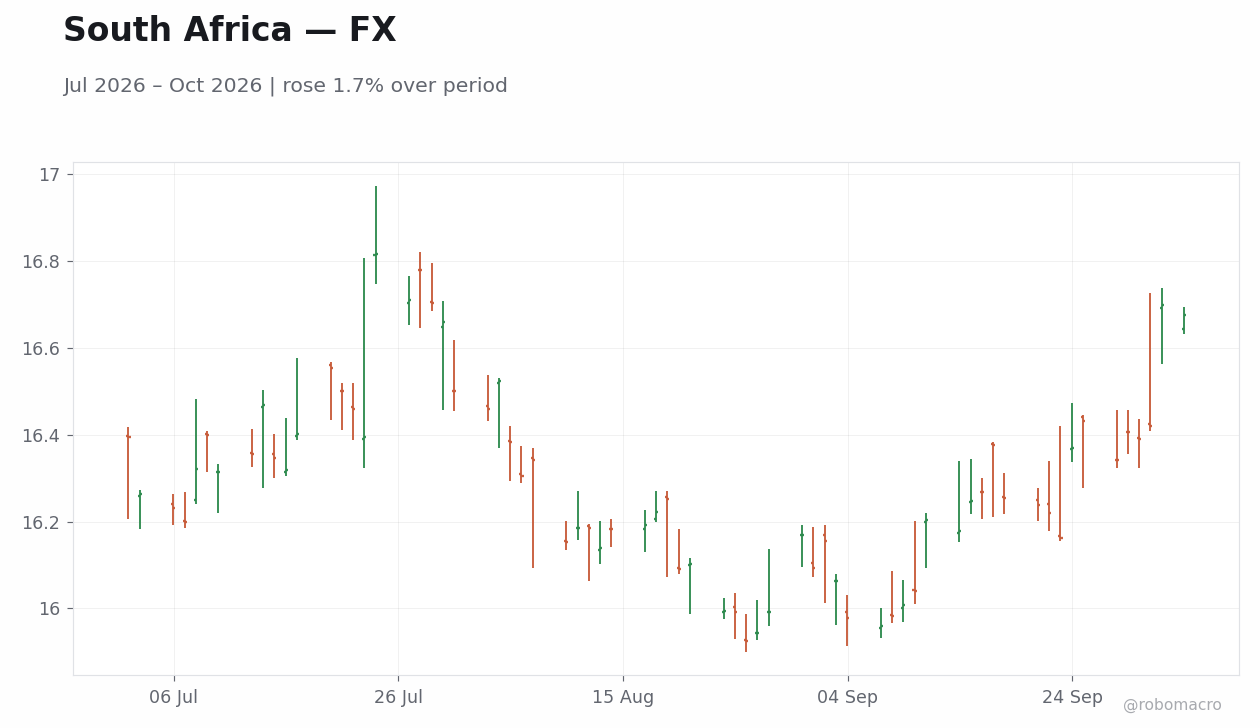
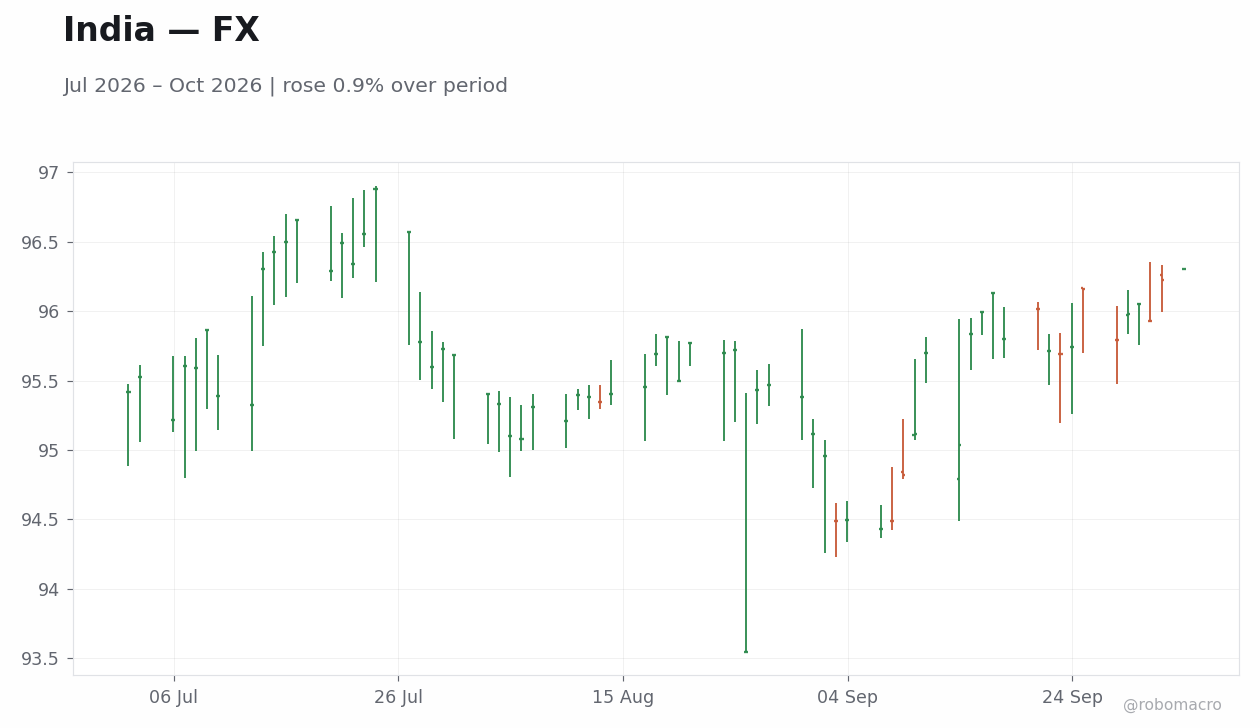
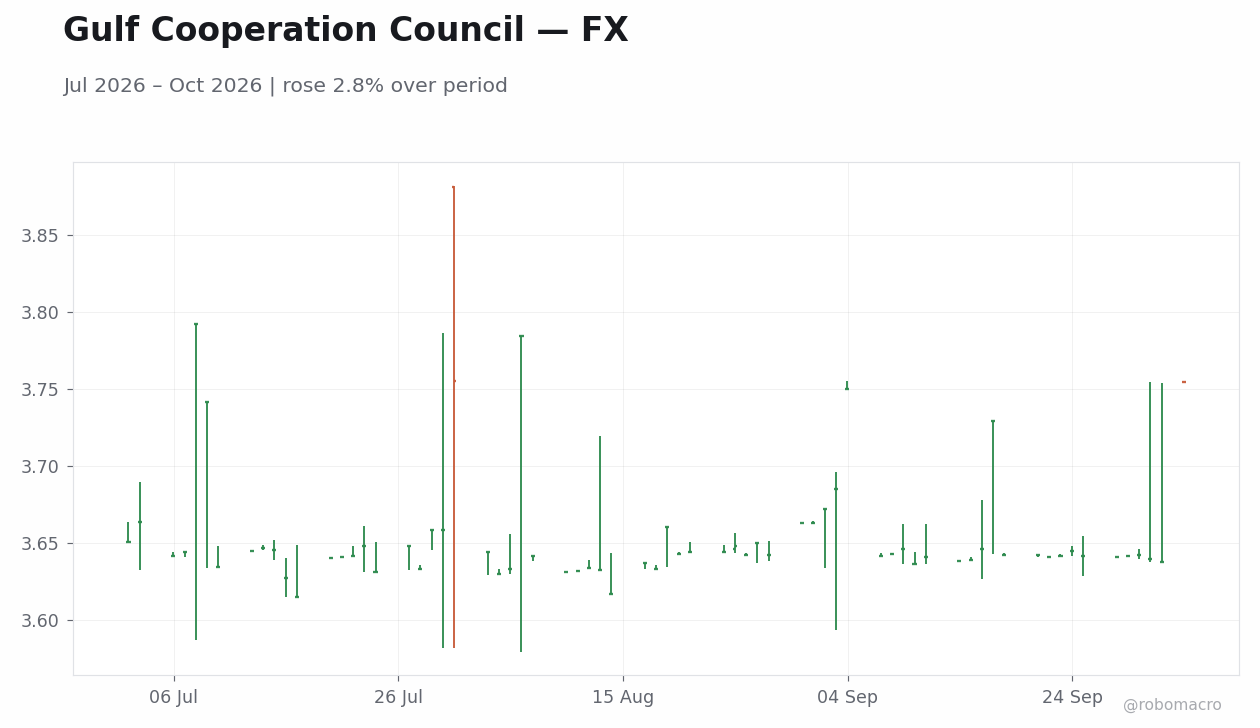
Dollar strength dominated price action in the week of September 28–October 2, 2026. USD/MXN climbed 2.23 percent to 18.15 and USD/ZAR rose 2.04 percent to 16.67, both ranking among the largest volatility-adjusted moves. USD/JPY reached 157.83, USD/CAD finished at 1.42 after a 0.64 percent gain, and USD/PEN advanced 4.27 percent to 3.43. These moves occurred alongside a 0.53 percent rise in USD/INR to 96.30 and a 2.97 percent increase in USD/CLP to 989.6. The configuration leaves the global expansion in its mid-cycle phase, where currency volatility transmits external price signals faster than most central banks can adjust.
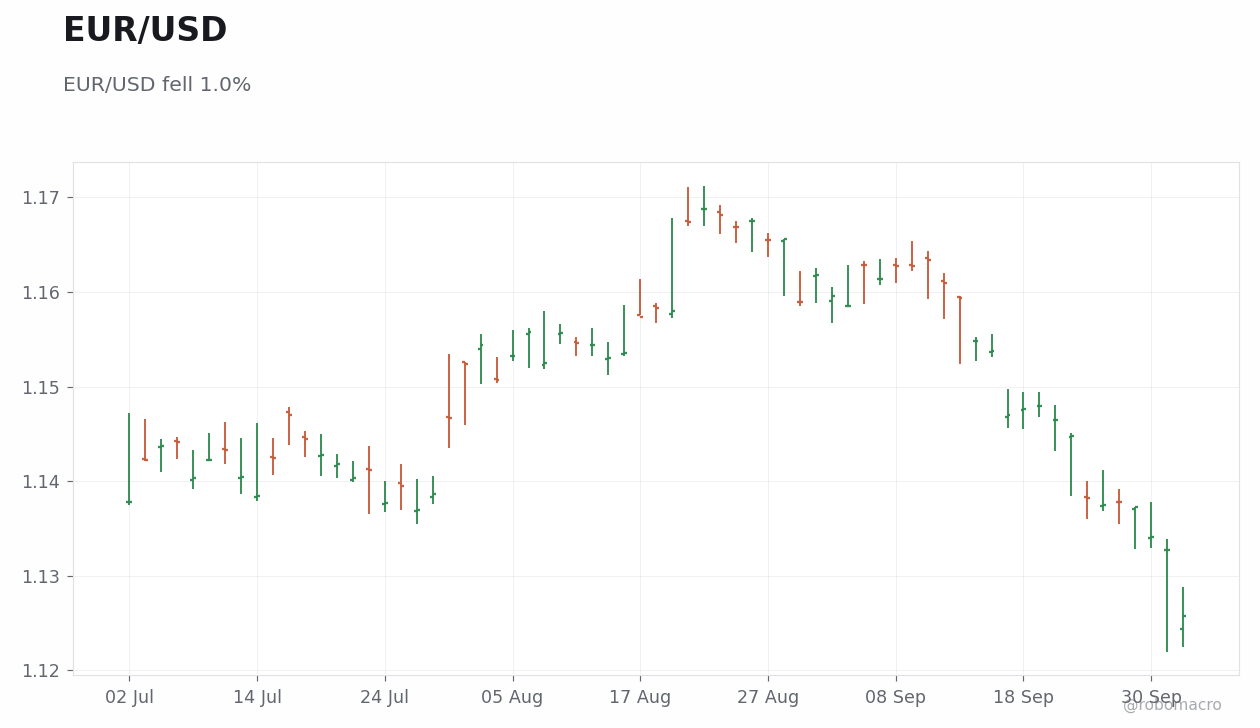
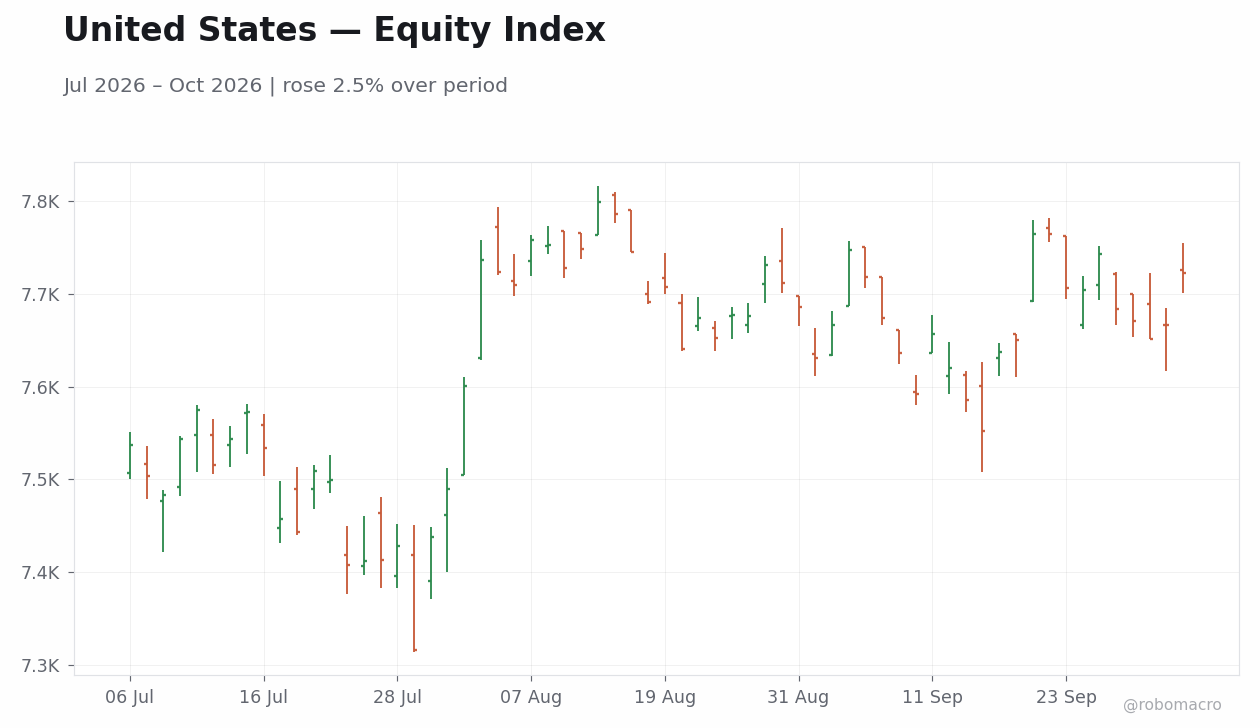
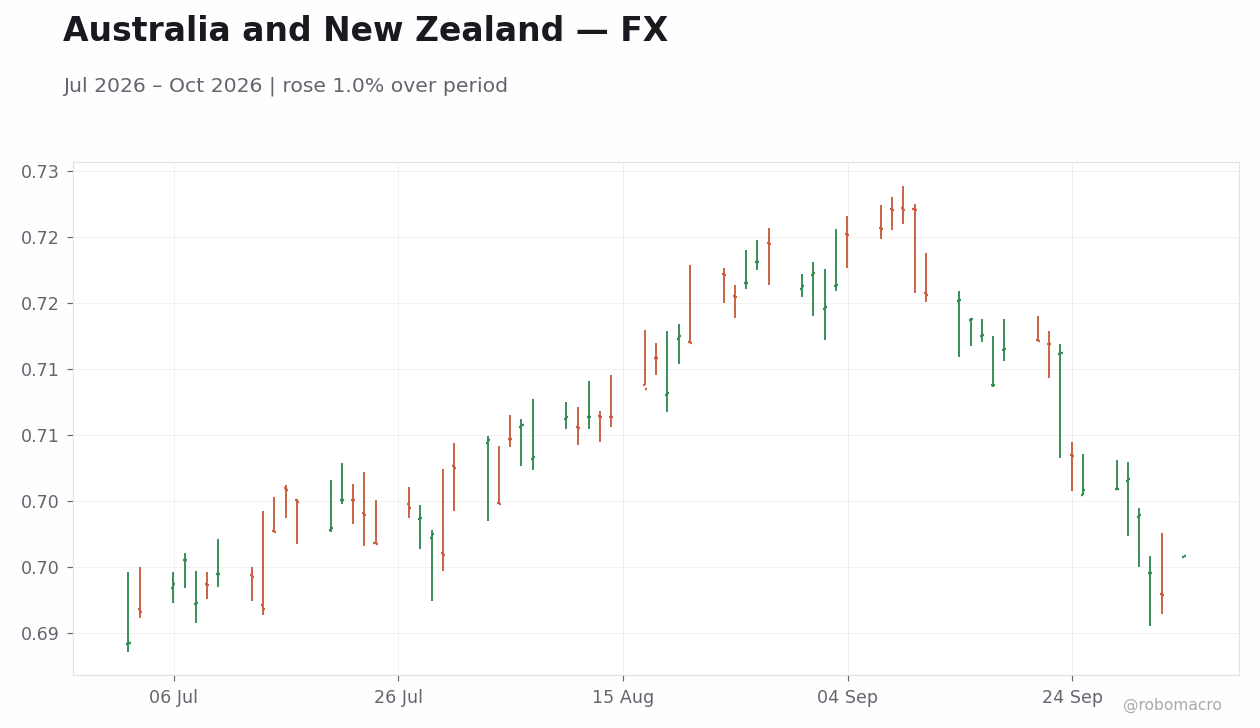
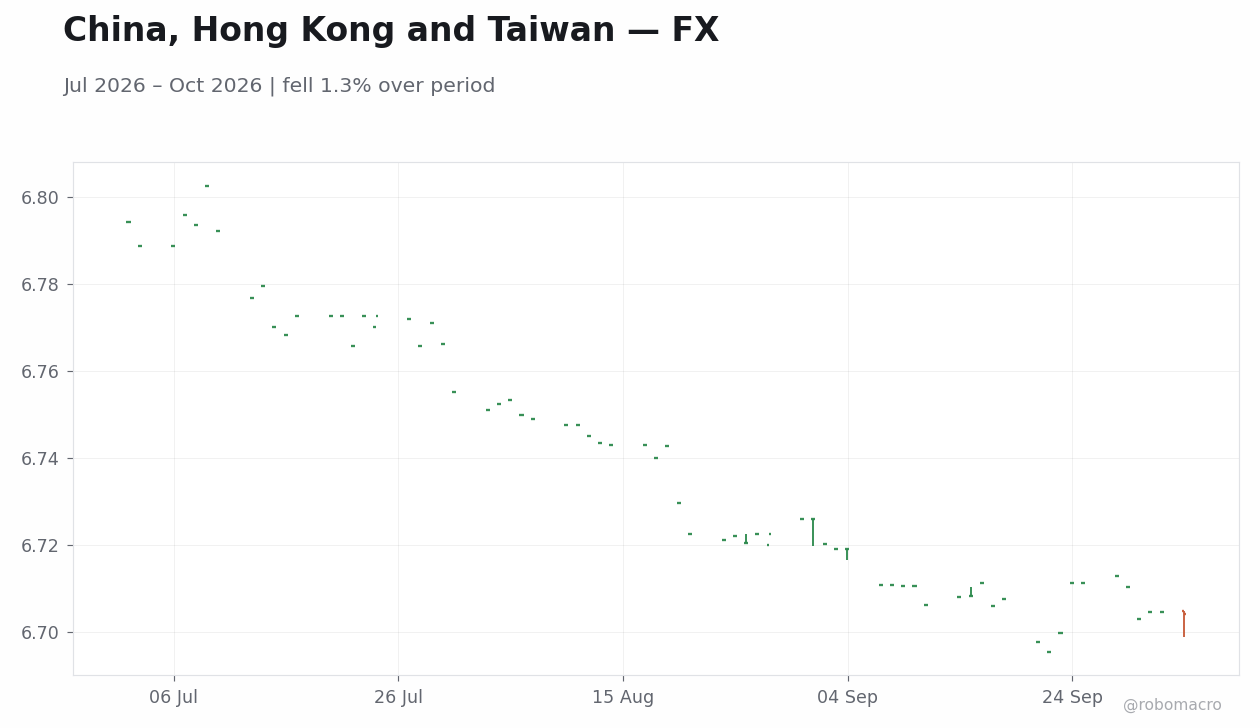
We note that the dollar’s breadth extended beyond the usual suspects. USD/SEK posted a 1.1 percent weekly gain while EUR/USD fell amid euro-area inflation surprises. In contrast, USD/CNY declined 0.13 percent to 6.70 and AUD/USD fell 0.73 percent to 0.70, showing selective differentiation inside Asia and commodity-linked currencies. The data suggest that markets are pricing persistent US yield advantage rather than any single data surprise, consistent with the 0.51 percent weekly gain in the S&P 500 to 7722.72.
Published every Sunday afternoon 100% AI-generated — not financial advice
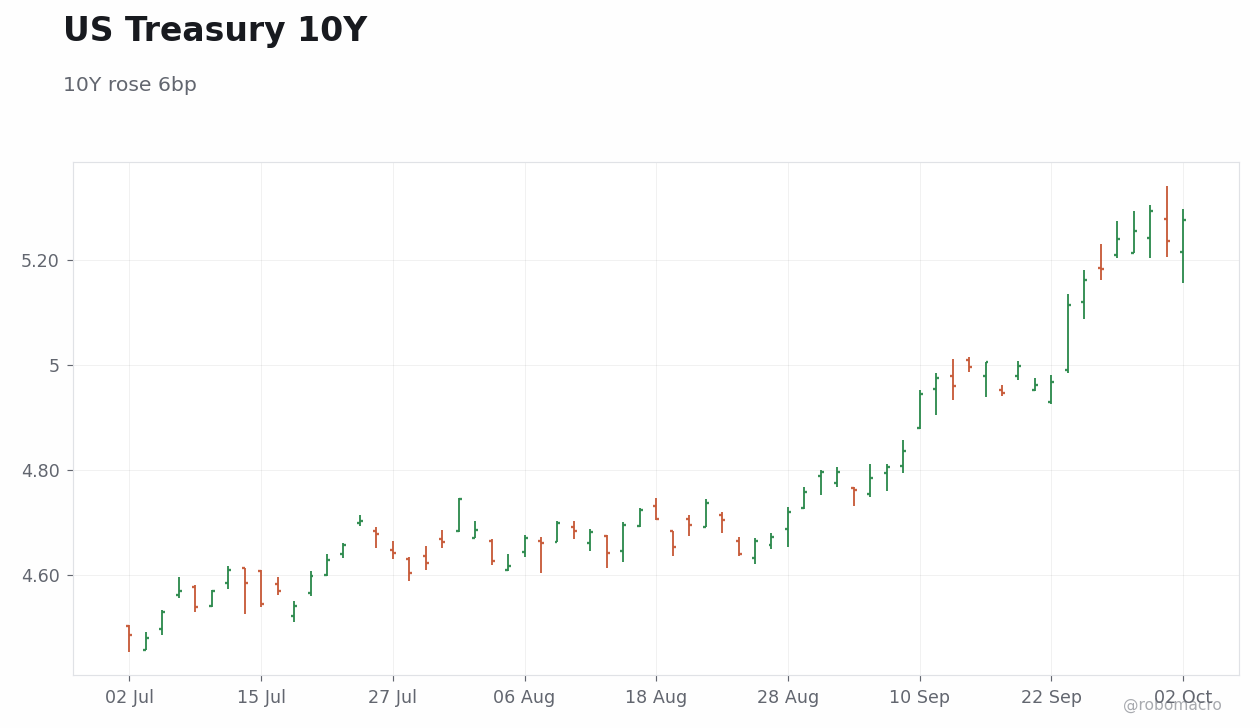
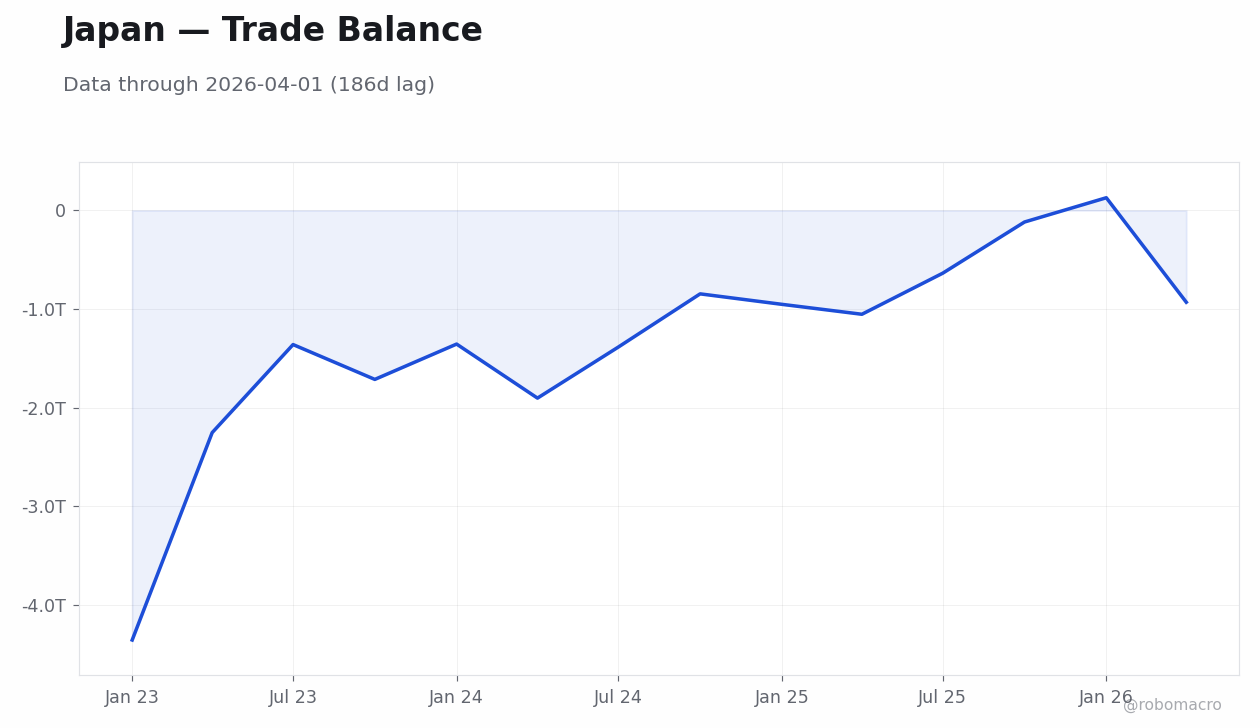
Developed-market outcomes clustered around selective resilience and continued data dependence. US labor-market data showed softening with payrolls rising less than expected and the unemployment rate moving higher, while core PCE inflation softened month-over-month below consensus. Multiple Federal Reserve speakers delivered no material shift in forward guidance. In the euro area, Spanish, French and Italian inflation prints exceeded expectations, lifting Eurozone HICP upside risks, and German 10-year Bund yields moved higher. Japanese industrial production and retail sales both missed expectations, yet the Tankan Large Manufacturers Index rose modestly. The Bank of England’s Deputy Governor Ramsden warned rates may need to rise if inflationary pressures persist, while Taylor saw no immediate need to hike. Across these economies the common thread remains tolerance for divergent prints without immediate policy recalibration.
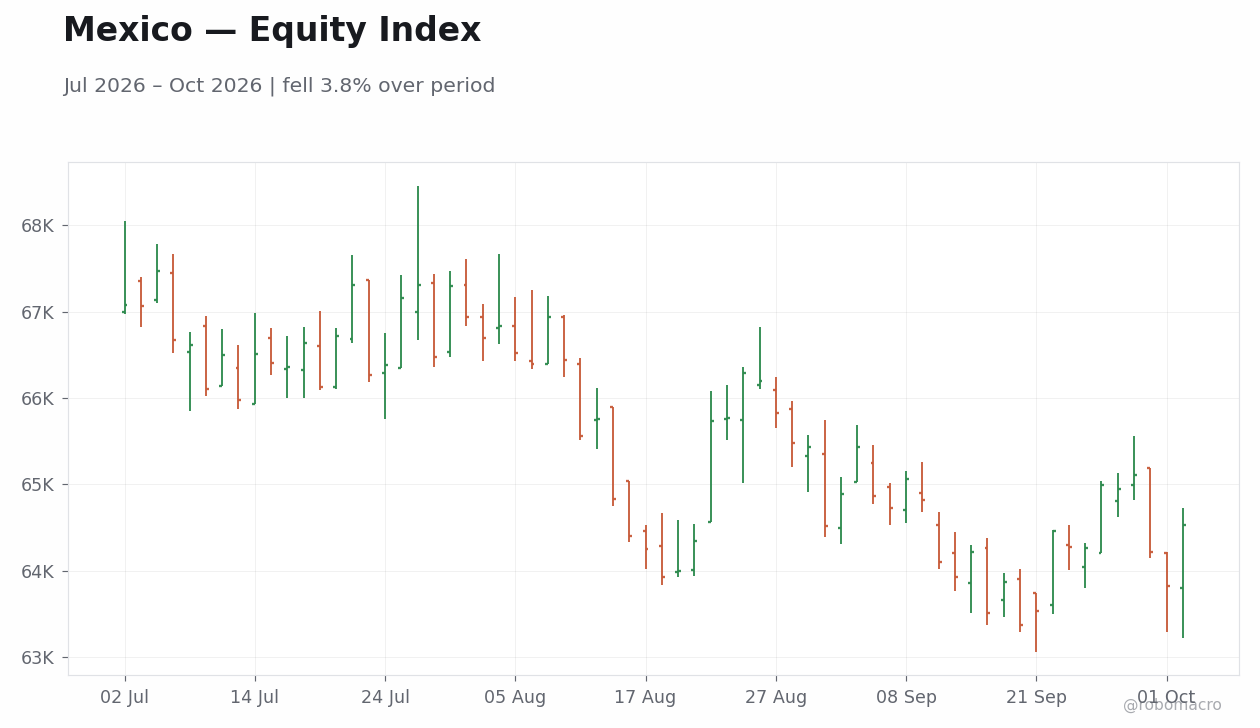
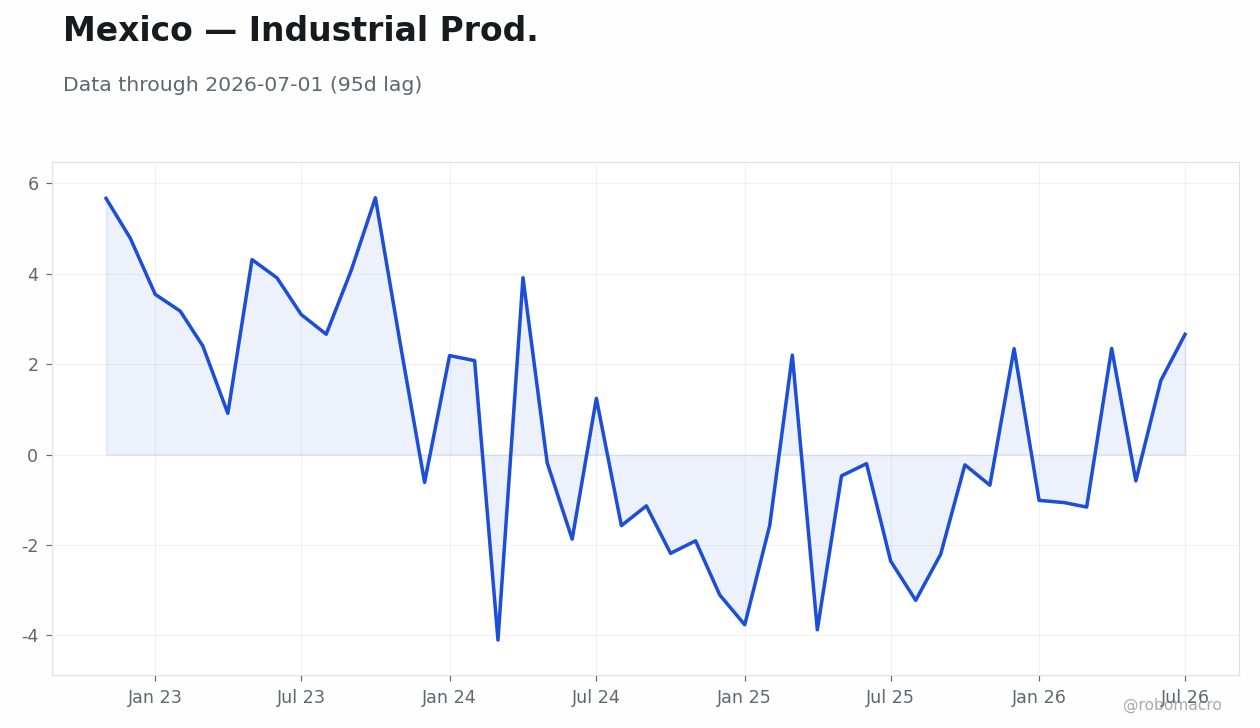
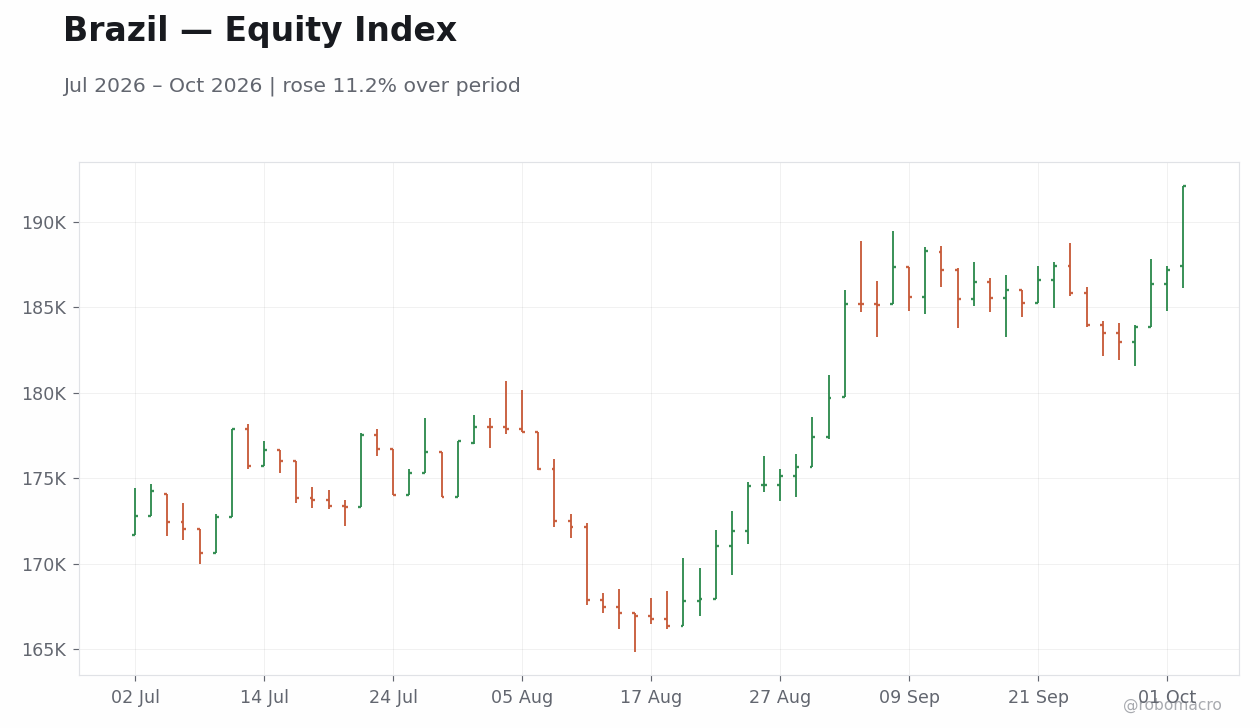
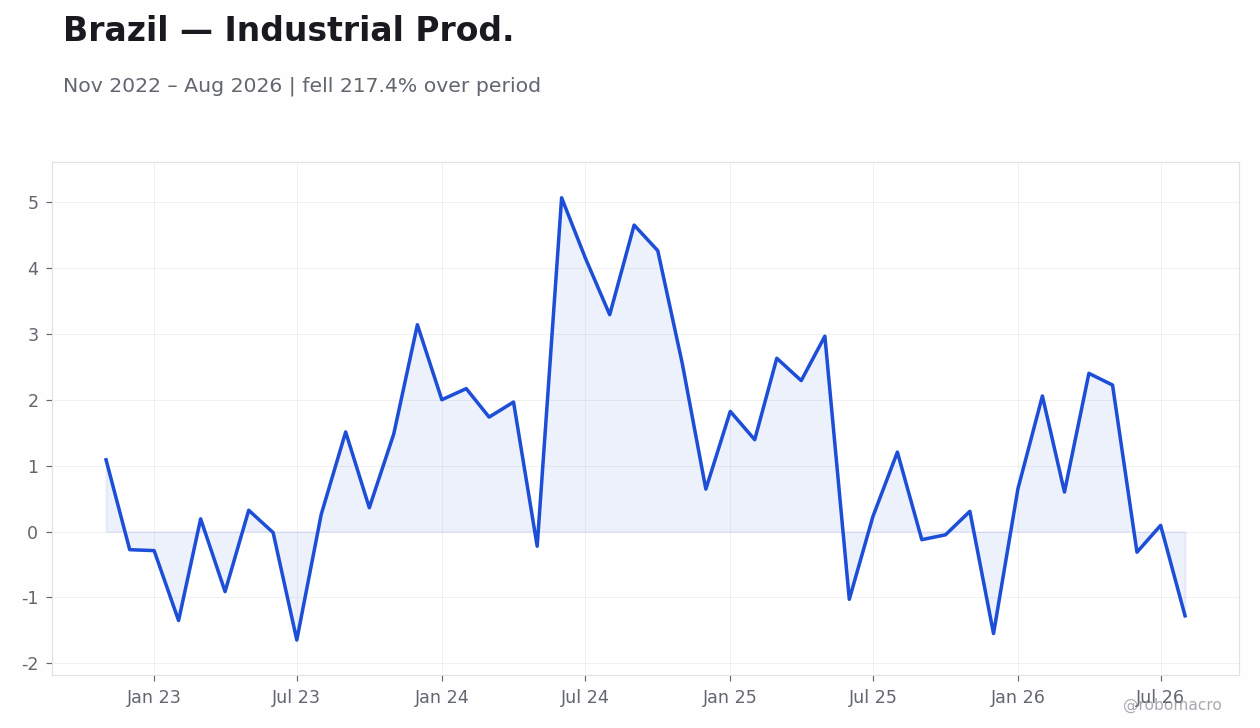
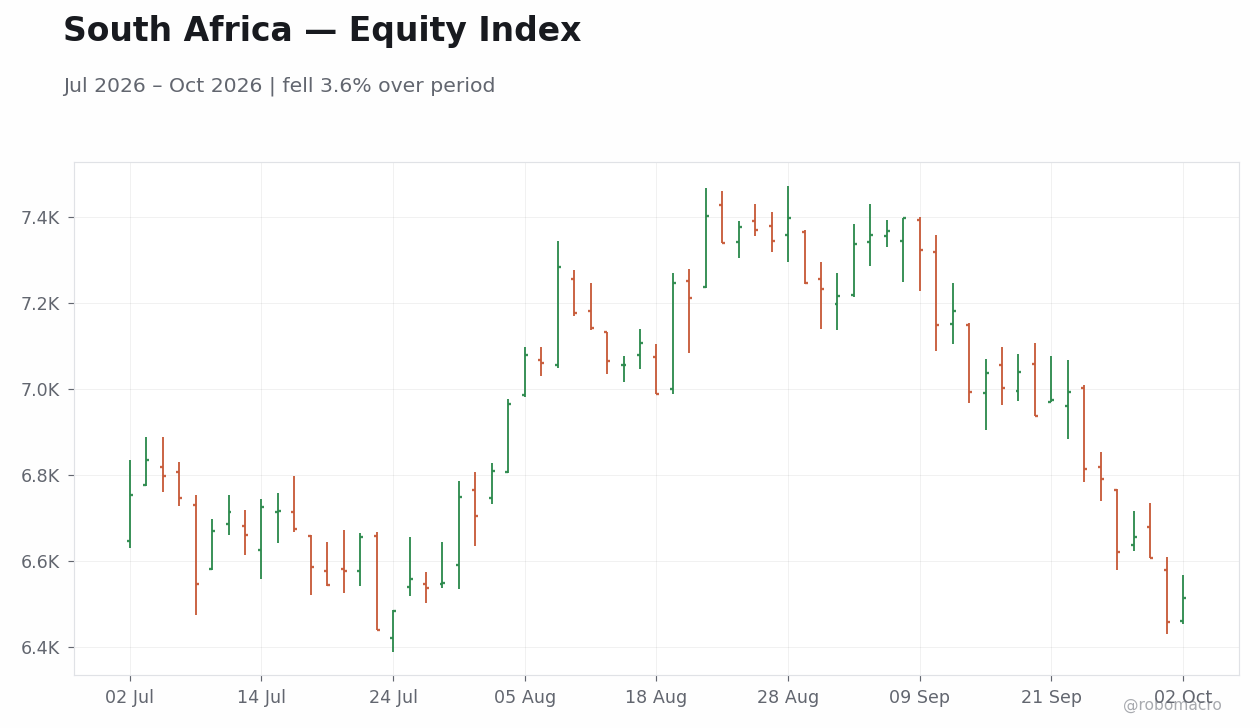
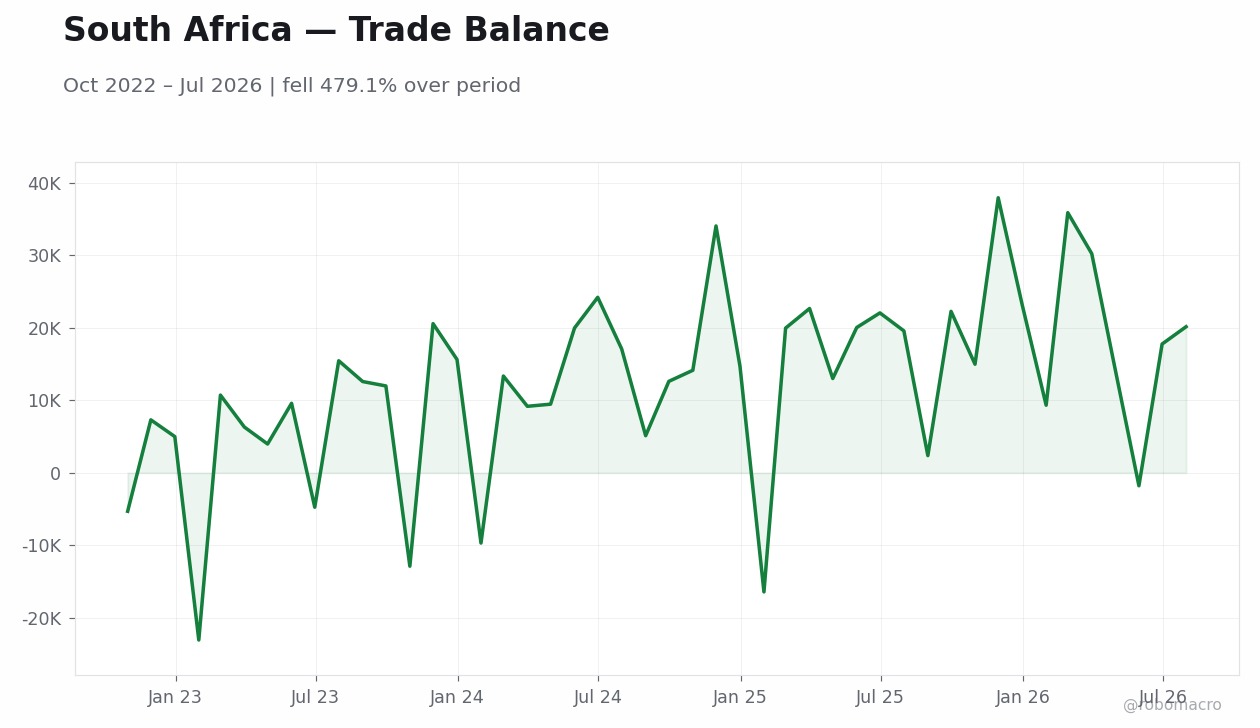
Emerging-market data flows split along currency and domestic-demand lines. Brazil’s headline unemployment rate held at a record low, supporting a 4.99 percent weekly gain in the Bovespa to 192,115, while industrial production posted a month-over-month contraction. Mexico’s external trade data showed softening momentum as USD/MXN advanced 2.23 percent to 18.15 and the IPC Bolsa declined 0.64 percent to 64,531.68. South Africa’s trade balance provided modest support to the rand even as USD/ZAR rose 2.04 percent to 16.67 and the JSE Top 40 fell 0.55 percent. In contrast, China’s September NBS Manufacturing PMI rose while Non-Manufacturing PMI also advanced, confirming the first official expansion reading in months, and Beijing announced mortgage subsidies for first-time buyers together with a policy-rate cut. The configuration leaves EM central banks absorbing dollar-driven imported price signals without uniform rate responses.
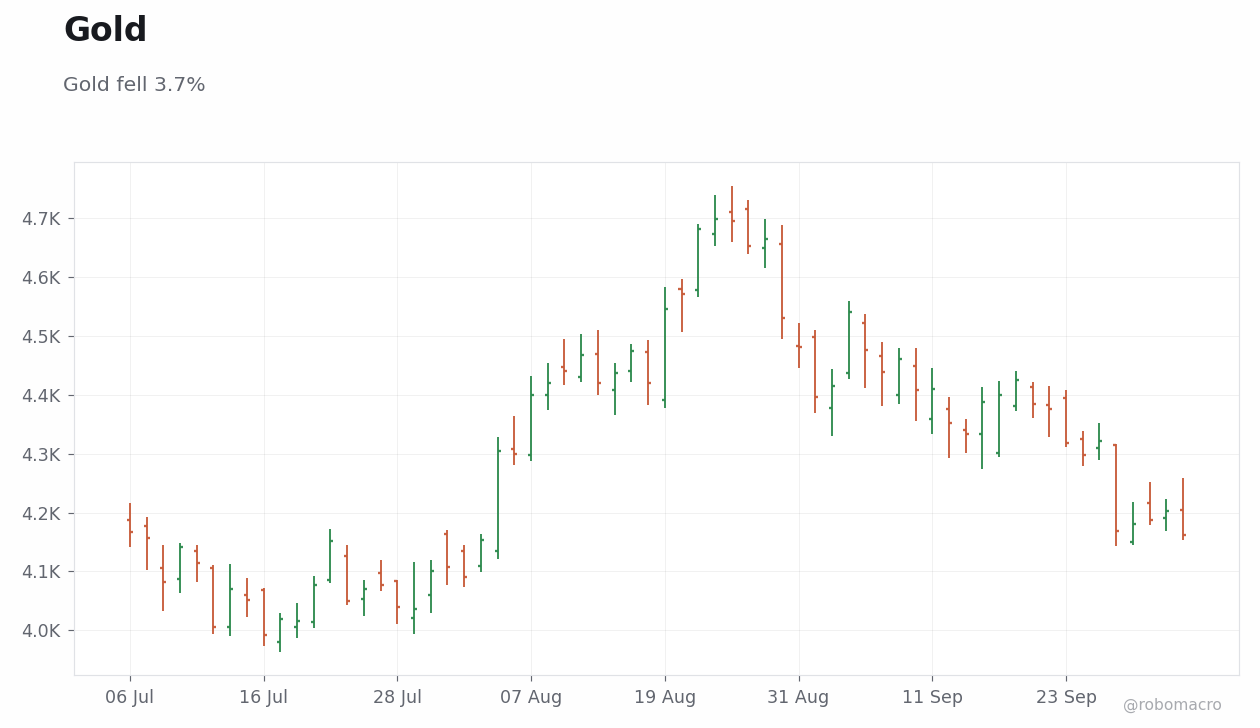
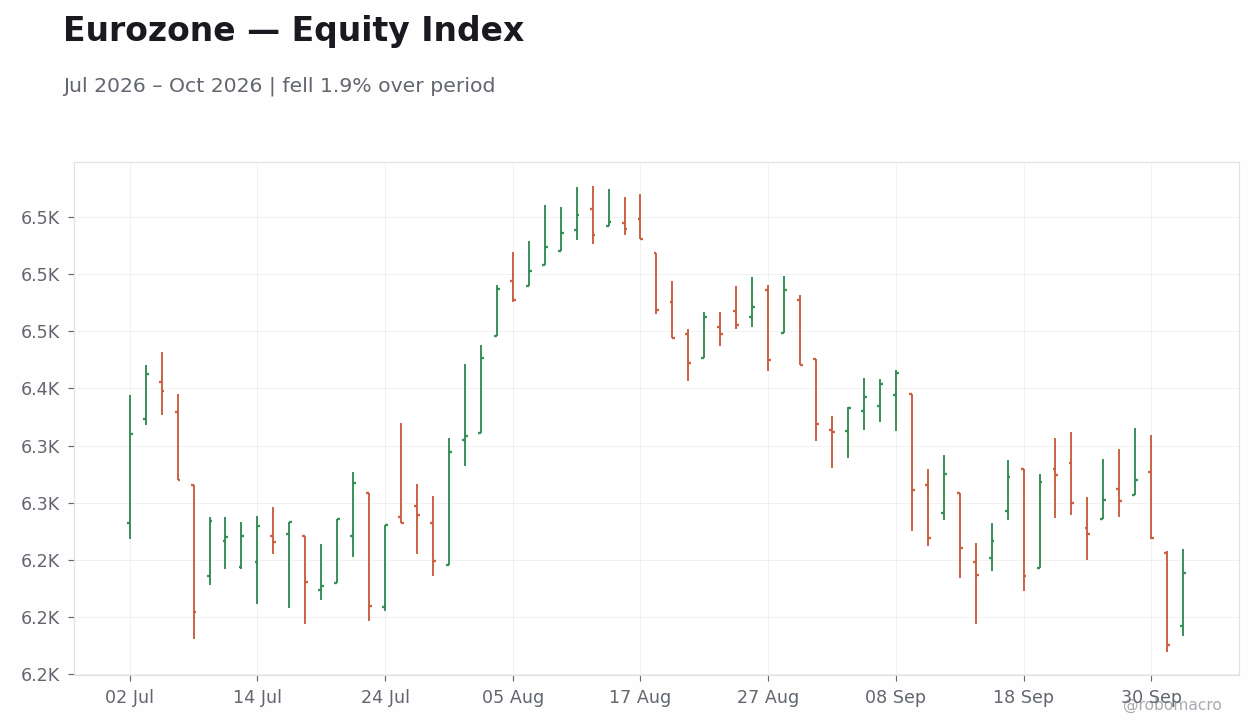
Cross-asset price action reinforced the dollar-led narrative. The S&P 500 closed the week at 7722.72, up 0.51 percent, while the Nikkei 225 gained 2.9 percent on a volatility-adjusted basis. German 10-year yields rose alongside French 10-year yields, reflecting reduced near-term easing odds. Brent crude declined 2.88 percent to 102.25, easing pressure on imported costs for net-energy importers yet leaving producer currencies such as the Norwegian krone and Canadian dollar exposed. Gold fell 3.7 percent and silver declined 6.0 percent on the same volatility-adjusted ranking, while iron ore dropped 5.9 percent. Equity indices in the euro area posted net weekly declines, with the Euro Stoxx 50 and IBEX 35 both lower, underscoring that dollar strength and sticky inflation prints outweighed commodity relief in several markets.
Policy outlook remains anchored to incoming data across major central banks. The Federal Reserve, ECB, Bank of Japan and Banco de Mexico each left forward guidance unchanged after the week’s prints. Norges Bank maintained its policy rate amid a 3.30 percent Norway CPI YoY reading, while the Riksbank minutes showed all governors shifting hawkish and flagging November rate-hike risk. Banco Central do Brasil and South African Reserve Bank kept rates unchanged, with Governor Kganyago reinforcing the 3 percent inflation target. Bank Indonesia maintained its policy rate and coordinated stabilisation measures with the Finance Ministry, signalling that currency stability takes precedence over near-term rate adjustment. The common thread is tolerance for divergent activity and inflation prints without immediate recalibration of rate paths.
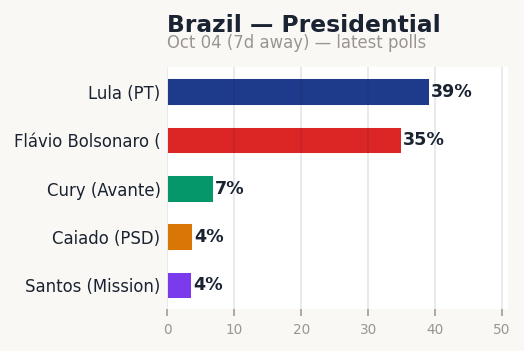
Forward look centers on the Brazilian General Elections scheduled for October 4, 2026. First-round presidential voting alongside Chamber, one-third of the Senate and governors will test continuation of redistributive social spending against potential market liberalization. Latest polls show Lula at 40.0 percent and Flávio Bolsonaro at 36.2 percent. Market participants will also monitor the next round of US labor and inflation releases, euro-area HICP prints and any Bank of Japan Summary of Opinions updates. The data suggest that dollar breadth and EM currency responses will remain the primary transmission channel for global price signals into the following week.
| Economy | Real GDP (% y/y) | Consumer Prices (% y/y) | ||||
|---|---|---|---|---|---|---|
| 2026E | 2027E | 2028E | 2026E | 2027E | 2028E | |
| Americas | ||||||
| United States | 2.3 | 2.1 | 2.1 | 3.2 | 2.1 | 2.2 |
| Canada | 1.5 | 1.9 | 1.7 | 2.5 | 2.1 | 2.0 |
| Mexico | 1.6 | 2.2 | 2.1 | 3.9 | 3.4 | 3.0 |
| Brazil | 1.9 | 2.0 | 2.4 | 4.0 | 3.4 | 3.0 |
| Argentina | 3.5 | 4.0 | 3.8 | 30.4 | 15.7 | 9.6 |
| Colombia | 2.3 | 2.5 | 2.6 | 5.9 | 5.2 | 3.4 |
| Chile | 2.4 | 2.6 | 2.3 | 2.9 | 3.3 | 3.0 |
| Peru | 2.8 | 2.8 | 2.8 | 2.5 | 1.8 | 2.0 |
| Asia / Pacific | ||||||
| Japan | 0.7 | 0.6 | 0.6 | 2.2 | 2.3 | 2.0 |
| China | 4.4 | 4.0 | 4.0 | 1.2 | 1.5 | 1.8 |
| India | 6.5 | 6.5 | 6.5 | 4.7 | 4.0 | 4.0 |
| Australia | 2.0 | 1.7 | 1.9 | 4.0 | 3.2 | 2.6 |
| New Zealand | 2.1 | 2.4 | 2.4 | 3.1 | 2.3 | 2.1 |
| South Korea | 1.9 | 2.1 | 2.2 | 2.5 | 1.9 | 2.0 |
| Indonesia | 5.0 | 5.1 | 5.2 | 3.0 | 2.6 | 2.5 |
| Malaysia | 4.7 | 4.3 | 4.3 | 1.9 | 2.0 | 2.0 |
| Philippines | 4.1 | 5.8 | 6.1 | 4.3 | 3.2 | 3.0 |
| Singapore | 3.5 | 2.7 | 2.5 | 2.3 | 1.9 | 2.0 |
| Thailand | 1.5 | 2.1 | 2.3 | 0.9 | 1.0 | 1.2 |
| Taiwan | 5.2 | 3.0 | 2.4 | 1.5 | 1.6 | 1.6 |
| Vietnam | 7.1 | 6.7 | 6.2 | 4.9 | 4.6 | 3.7 |
| Western Europe | ||||||
| Euro area | 1.1 | 1.2 | 1.4 | 2.6 | 2.2 | 2.1 |
| Germany | 0.8 | 1.2 | 1.2 | 2.7 | 2.3 | 2.0 |
| France | 0.9 | 0.9 | 1.2 | 1.8 | 1.7 | 1.9 |
| Italy | 0.5 | 0.5 | 0.8 | 2.6 | 2.4 | 2.3 |
| Spain | 2.1 | 1.8 | 1.8 | 3.0 | 2.3 | 2.5 |
| United Kingdom | 0.8 | 1.3 | 1.6 | 3.2 | 2.4 | 2.0 |
| Sweden | 2.0 | 1.9 | 2.1 | 1.5 | 1.8 | 2.6 |
| Norway | 1.5 | 1.3 | 1.1 | 3.3 | 2.6 | 2.2 |
| Denmark | 2.0 | 1.6 | 1.6 | 2.0 | 2.2 | 2.2 |
| Switzerland | 1.3 | 1.3 | 1.8 | 0.5 | 0.5 | 0.6 |
| Netherlands | 1.2 | 1.4 | 1.4 | 2.7 | 2.4 | 2.3 |
| Poland | 3.3 | 2.4 | 2.6 | 3.3 | 3.3 | 3.9 |
| Czech Republic | 2.2 | 2.2 | 2.1 | 2.4 | 2.2 | 2.5 |
| Hungary | 1.7 | 2.0 | 2.3 | 3.8 | 3.5 | 3.1 |
| Romania | 0.7 | 2.5 | 2.7 | 7.8 | 3.9 | 4.3 |
| EMEA Emerging | ||||||
| Turkey | 3.4 | 3.5 | 3.8 | 28.6 | 21.4 | 17.0 |
| South Africa | 1.0 | 1.3 | 1.5 | 3.9 | 3.4 | 3.0 |
| Israel | 3.5 | 4.4 | 3.7 | 2.3 | 2.1 | 2.0 |
| Saudi Arabia | 3.1 | 4.5 | 3.6 | 2.3 | 2.1 | 2.0 |
| UAE | 3.1 | 5.3 | 4.6 | 2.5 | 2.0 | 2.0 |
| Egypt | 4.2 | 4.8 | 5.5 | 13.2 | 11.1 | 8.1 |
| Nigeria | 4.1 | 4.3 | 4.1 | 16.0 | 15.9 | 12.7 |
| Kenya | 4.5 | 4.7 | 5.1 | 5.9 | 5.9 | 5.7 |
| Global Aggregates | ||||||
| Global | 3.1 | 3.2 | 3.2 | 4.4 | 3.7 | 3.4 |
| Developed markets | 1.8 | 1.7 | 1.7 | 2.8 | 2.2 | 2.1 |
| Emerging markets | 3.9 | 4.2 | 4.2 | 5.5 | 4.6 | 4.1 |
| Central Bank | Instrument | Current Rate |
Last Change |
bp | Next Meeting |
Q1 2026 |
Q2 2026 |
Q3 2026 |
Q4 2026 |
|---|---|---|---|---|---|---|---|---|---|
| The Americas | |||||||||
| Federal Reserve | Fed funds upper | 4.00% | Sep 2026 | +25 | Oct 28 | 3.75 | 3.75 | — | — |
| Bank of Canada | O/N rate | 2.25% | Oct 2025 | -25 | Oct 28 | 2.25 | 2.25 | — | — |
| BCB (Brazil) | SELIC | 13.75% | Sep 2026 | -25 | Nov 4 | 14.75 | 14.25 | — | — |
| Banxico | O/N rate | 6.50% | May 2026 | -25 | Nov 5 | 6.75 | 6.50 | — | — |
| BCRA (Argentina) | Aggregates regime | — | Jul 2025 | — | — | — | — | — | — |
| BanRep (Colombia) | Repo | 12.00% | Jul 2026 | +75 | — | 10.25 | 11.25 | — | — |
| BCCh (Chile) | MPR | 4.50% | Dec 2025 | -25 | — | 4.50 | 4.50 | — | — |
| Europe / Africa | |||||||||
| ECB | Depo rate | 2.50% | Sep 2026 | +25 | Oct 29 | 2.00 | 2.25 | — | — |
| Bank of England | Bank rate | 3.75% | Dec 2025 | -25 | Nov 5 | 3.75 | 3.75 | — | — |
| Riksbank | Repo rate | 1.75% | Oct 2025 | -25 | Nov 4 | 1.75 | 1.75 | — | — |
| Norges Bank | Dep rate | 4.50% | Sep 2026 | +25 | Nov 5 | 4.00 | 4.25 | — | — |
| SNB | Policy rate | 0.00% | Jun 2025 | -25 | Dec 10 | 0.00 | 0.00 | — | — |
| CNB (Czech) | 2-wk repo | 3.75% | Jun 2026 | +25 | Nov 5 | 3.50 | 3.75 | — | — |
| NBH (Hungary) | Base rate | 5.50% | Aug 2026 | -25 | Oct 20 | 6.25 | 6.25 | — | — |
| NBP (Poland) | Ref rate | 3.75% | Mar 2026 | -25 | — | 3.75 | 3.75 | — | — |
| SARB | Repo rate | 7.25% | Sep 2026 | +25 | Nov 19 | 6.75 | 7.00 | — | — |
| CBRT (Turkey) | 1-wk repo | 37.00% | Jan 2026 | -100 | Oct 22 | 37.00 | 37.00 | — | — |
| Asia / Pacific | |||||||||
| RBA | Cash rate | 4.35% | May 2026 | +25 | Nov 3 | 4.10 | 4.35 | — | — |
| RBNZ | OCR | 2.75% | Sep 2026 | +25 | Oct 28 | 2.25 | 2.25 | — | — |
| BoJ | Pol rate | 1.25% | Sep 2026 | +25 | Oct 30 | 0.75 | 1.00 | — | — |
| PBoC | 1-yr LPR | 3.00% | May 2025 | -10 | — | 3.00 | 3.00 | — | — |
| RBI (India) | Repo rate | 5.25% | Dec 2025 | -25 | — | 5.25 | 5.25 | — | — |
| BoK (Korea) | Base rate | 3.00% | Aug 2026 | +25 | — | 2.50 | 2.50 | — | — |
| BI (Indonesia) | BI-Rate | 5.75% | Jun 2026 | +25 | Oct 21 | 4.75 | 5.75 | — | — |
| BSP (Philippines) | Rev repo | 5.00% | Aug 2026 | +25 | — | 4.25 | 4.75 | — | — |
| BoT (Thailand) | 1-day repo | 1.00% | Feb 2026 | -25 | Oct 28 | 1.00 | 1.00 | — | — |
| CBC (Taiwan) | Disc rate | 2.00% | Mar 2024 | +12.5 | — | — | — | — | — |
| MAS (Singapore) | SGD NEER | Mild appr. | Apr 2026 | slope+ | — | — | — | — | — |
| Nonfarm Payrolls (m/m) | +96k | 80% CI +57k…+173k |
| Unemployment Rate | 4.1% | |
| Avg Hourly Earnings (y/y) | 3.3% |
| Economy | Activity Index | 4-wk Δ | 13-wk Δ | Week ending | Indicators | Signal |
|---|---|---|---|---|---|---|
| United States | 61.4 | +6.0 | +6.0 | 2026-09-25 | 6/7 | Expanding · Advancing |
| Canada | 60.5 | +8.0 | +11.1 | 2026-09-25 | 6/8 | Expanding · Advancing |
| Germany | 59.7 | +13.2 | +16.3 | 2026-10-02 | 5/6 | Expanding · Advancing |
| Australia | 59.0 | +6.5 | +15.5 | 2026-09-25 | 3/3 | Expanding · Advancing |
| Brazil | 52.6 | -6.5 | -3.7 | 2026-10-02 | 3/4 | Expanding · Retreating |
| New Zealand | 51.6 | +0.5 | -0.8 | 2026-09-25 | 4/5 | Expanding · Flat |
| Spain | 51.0 | +5.9 | -4.9 | 2026-09-25 | 5/5 | Expanding · Advancing |
| Italy | 50.8 | -9.2 | -6.2 | 2026-09-25 | 5/5 | Expanding · Retreating |
| Japan | 45.7 | -17.2 | +12.8 | 2026-09-25 | 5/5 | Contracting · Retreating |
| Euro Area | 44.9 | -2.9 | -7.5 | 2026-09-25 | 5/5 | Contracting · Retreating |
| Poland | 40.8 | -13.6 | -6.1 | 2026-10-02 | 3/4 | Contracting · Retreating |
| France | 39.8 | -4.8 | -17.5 | 2026-09-25 | 4/5 | Contracting · Retreating |
Activity remains in expansion in United States, Germany, Italy, Spain, Canada, Brazil, Australia, New Zealand; while high-frequency trackers point to sub-trend activity in Euro Area, France, Japan, Poland. On a 4-week basis, momentum is improving in United States, Germany, Spain, Canada, Australia and cooling in Euro Area, France, Italy, Japan, Brazil, Poland. RoboMacro's labor ensemble nowcasts the next US payrolls print at +96k.


Week in Review
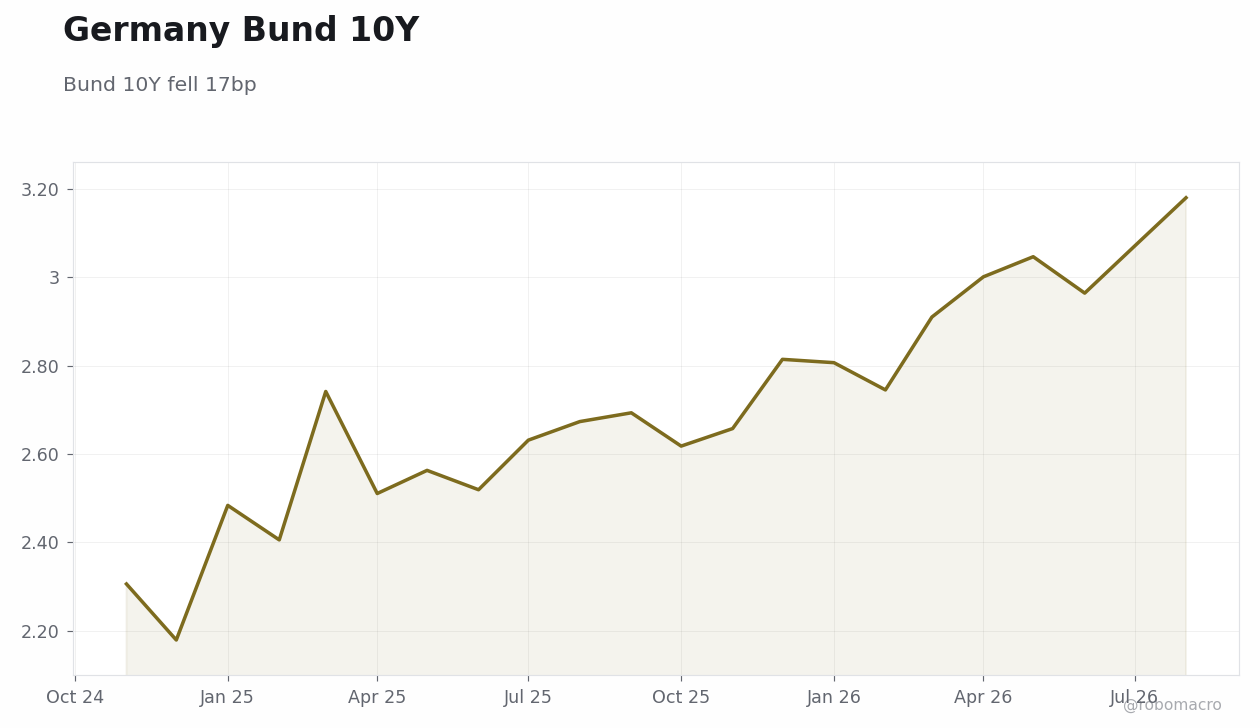
German 10-year Bund yields fell 17 basis points to 3.45%, the largest move among major DM markets. US 10-year Treasury yields rose 6 basis points to 5.24%, UK 10-year gilt yields rose 2 basis points to 5.38% and Japanese 10-year bond yields rose 4 basis points to 3.11%. US yields followed a volatile intra-week path with the 10-year starting the week at 5.2400 on Monday, rising to 5.2930 on Wednesday before pulling back to close at 5.2770 on Friday. The 30-year yield moved from 5.5610 on Monday to 5.6380 on Wednesday before ending the week at 5.6300. This occurred as US labor market data showed softening while core PCE inflation softened month-over-month and final Q3 GDP growth was revised higher. UK gilt yields edged higher amid divergent household borrowing trends and data-dependent Bank Rate views.
Curve & Spreads
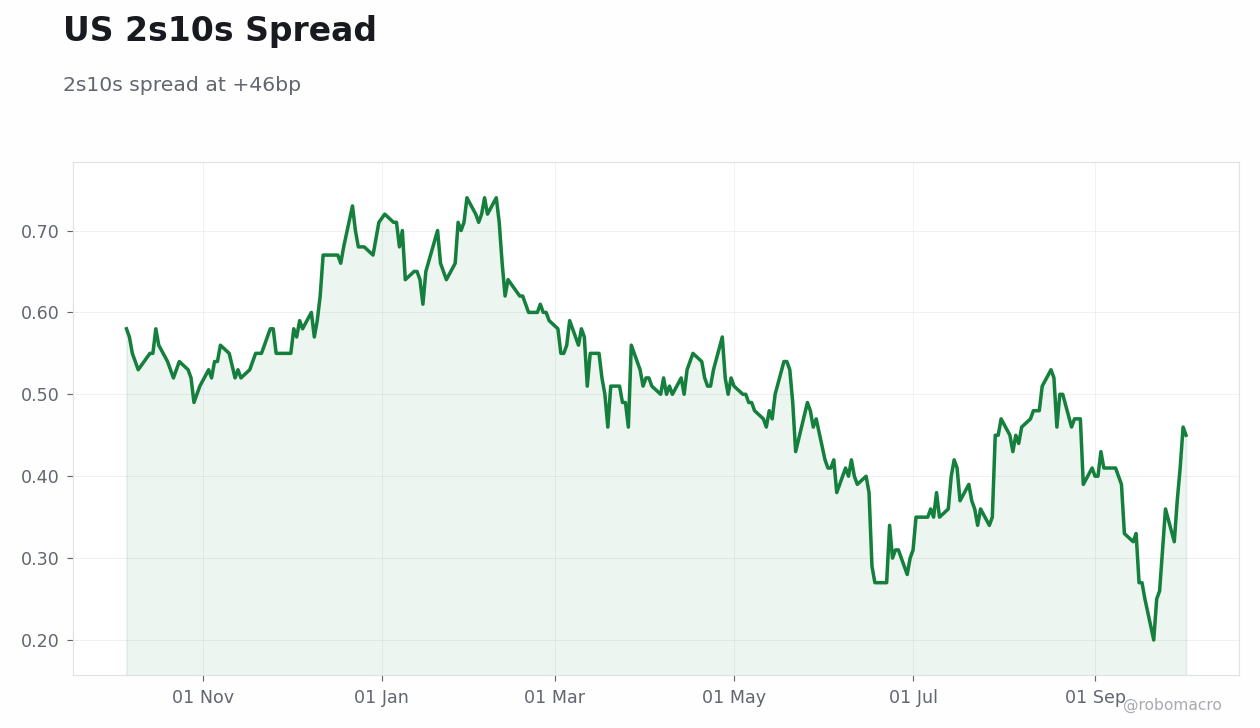
The US 2s10s stands at +46bp, compared with Germany 2s10s at +38bp and UK 2s10s at +70bp. The UK curve is steeper than both the US and German curves. These positively sloped curves across DM markets imply expectations of resilient growth ahead rather than contraction. The modest steepening in the US and Germany relative to the steeper UK curve suggests balanced growth expectations without aggressive repricing of near-term risks.
EM Bonds
Turkish 10-year yields stood at 35.61% with the 2-year at 40.35% and 2s10s at -474bp after the front end moved significantly higher. Brazilian 10-year yields stood at 14.27%, South African 10-year yields at 9.01% and Indonesian 10-year yields at 7.16%. These EM yield levels remain markedly higher than DM benchmarks such as the US 10-year at 5.24% and German 10-year at 3.45%. The substantial premium reflects ongoing risk differentials even as DM markets showed mixed directional moves.
Central Bank Read
Front-end yields generally outperformed back-end yields in DM markets, with the US 2-year falling 9 basis points while the 10-year rose 6 basis points, a configuration that implies an easing bias. German 2-year yields fell 21 basis points versus a 17 basis point decline in 10-year yields, similarly implying an easing bias. The UK 2-year fell 2 basis points against a 2 basis point rise in the 10-year, reinforcing that the curve implies an easing bias. Japanese 2-year yields fell 1 basis point while the 10-year rose 4 basis points, pointing in the same direction. Overall curve shapes suggest policy accommodation could be delivered if incoming data continues to show softening momentum, consistent with the data-dependent stance reiterated by multiple central banks.
Week Ahead
With a light economic calendar next week, any surprise inflation prints will be watched most closely for duration risk given their direct bearing on policy expectations. Payrolls and jobs data releases will also matter for gauging labor market momentum and its influence on yield curves. Central bank meeting outcomes from the Fed, ECB, BoE and BoJ will be pivotal in confirming or shifting the easing bias currently priced into curves. Treasury auctions will provide additional insight into demand at current yield levels.
| Country | 2Y | 2Y WoW | 10Y | 10Y WoW | 30Y | 30Y WoW | 2s10s |
|---|---|---|---|---|---|---|---|
| United States | 4.78% | -9bp | 5.24% | +6bp | 5.61% | +14bp | +46bp |
| United Kingdom | 4.68% | -2bp | 5.38% | +2bp | 5.91% | +4bp | +70bp |
| Germany | 3.08% | -21bp | 3.45% | -17bp | 3.83% | -9bp | +38bp |
| France | 3.73% | +13bp | 4.87% | +14bp | 5.42% | +13bp | +113bp |
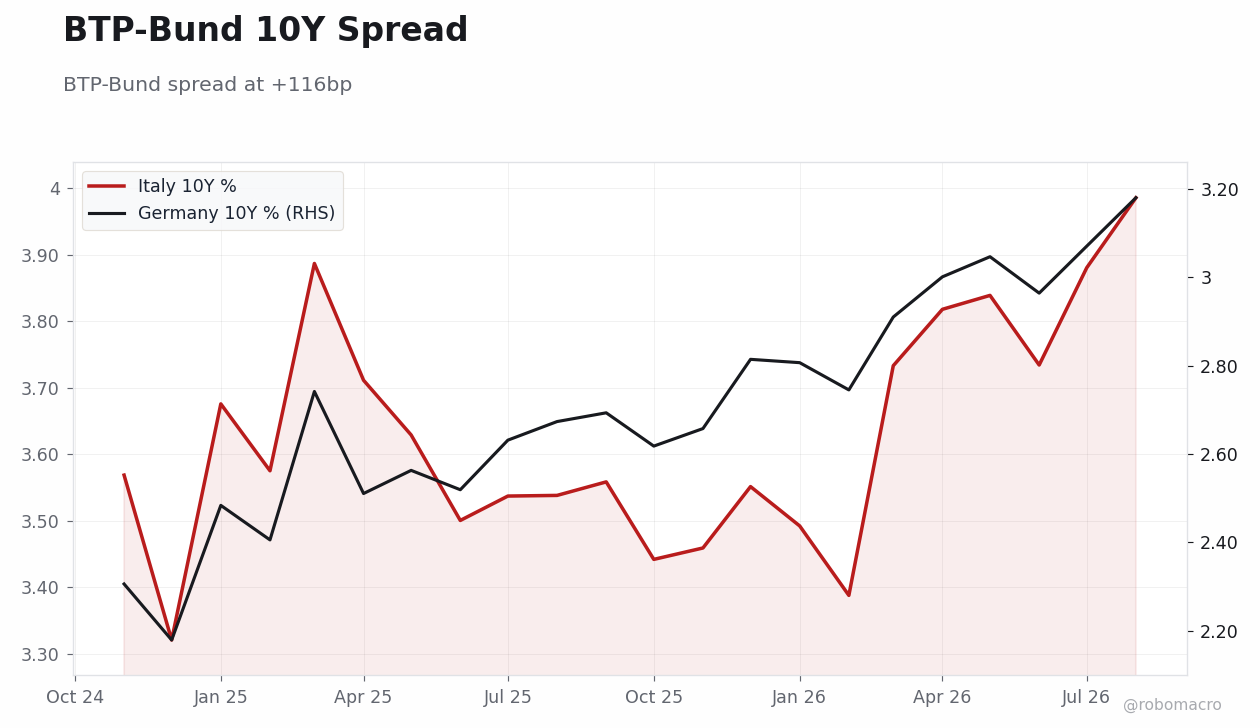
| Italy | 3.55% | -1bp | 4.61% | +6bp | 5.17% | +5bp | +106bp |
| Spain | 3.37% | +0bp | 4.11% | +3bp | 4.63% | +7bp | +74bp |
| Japan | 1.93% | -1bp | 3.11% | +4bp | 4.21% | +6bp | +119bp |
| Canada | 3.27% | -7bp | 3.94% | +2bp | 4.29% | +7bp | +67bp |
| Australia | 4.83% | -18bp | 5.33% | -6bp | 5.82% | +7bp | +50bp |
| China | 1.25% | -1bp | 1.70% | +3bp | 2.12% | -1bp | +45bp |
| India | 6.68% | +22bp | 7.21% | +10bp | 7.68% | +6bp | +53bp |
| Brazil | 13.80% | -3bp | 14.27% | +15bp | — | — | +47bp |
| Mexico | — | — | 9.51% | -1bp | — | — | — |
| South Korea | 3.89% | -8bp | 4.35% | -4bp | 4.50% | -8bp | +46bp |
| Indonesia | — | — | 7.16% | +8bp | 7.30% | +9bp | — |
| Turkey | 40.35% | +349bp | 35.61% | 0bp | — | — | -474bp |
| South Africa | — | — | 9.01% | +7bp | 9.38% | +12bp | — |
| Poland | — | — | 6.30% | -10bp | — | — | — |
Germany’s 2Y yield fell 21bp while Australia’s 2Y dropped 18bp, the largest declines in the table. Turkey’s 2Y surged 349bp, the standout advance, with India’s 2Y rising 22bp. US 2Y eased 9bp even as the 30Y climbed 14bp, steepening the 2s10s to +46bp. France’s curve shifted higher across tenors, with the 10Y up 14bp, contrasting sharply with Germany’s 10Y decline of 17bp. Japan’s 2s10s widened 119bp amid modest gains in longer yields. Brazil’s 10Y rose 15bp while Poland’s 10Y fell 10bp, underscoring peripheral divergence. Attention next week centers on inflation releases and central-bank communications that could extend these yield differentials.


Week in Review
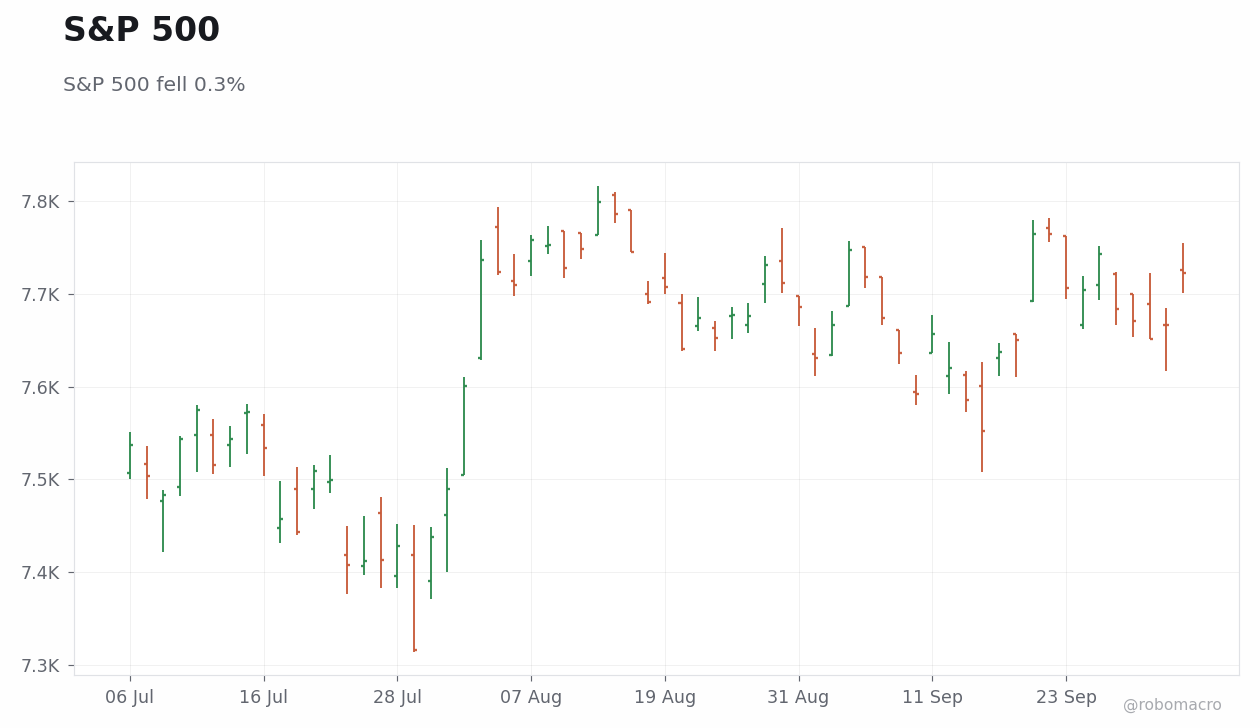
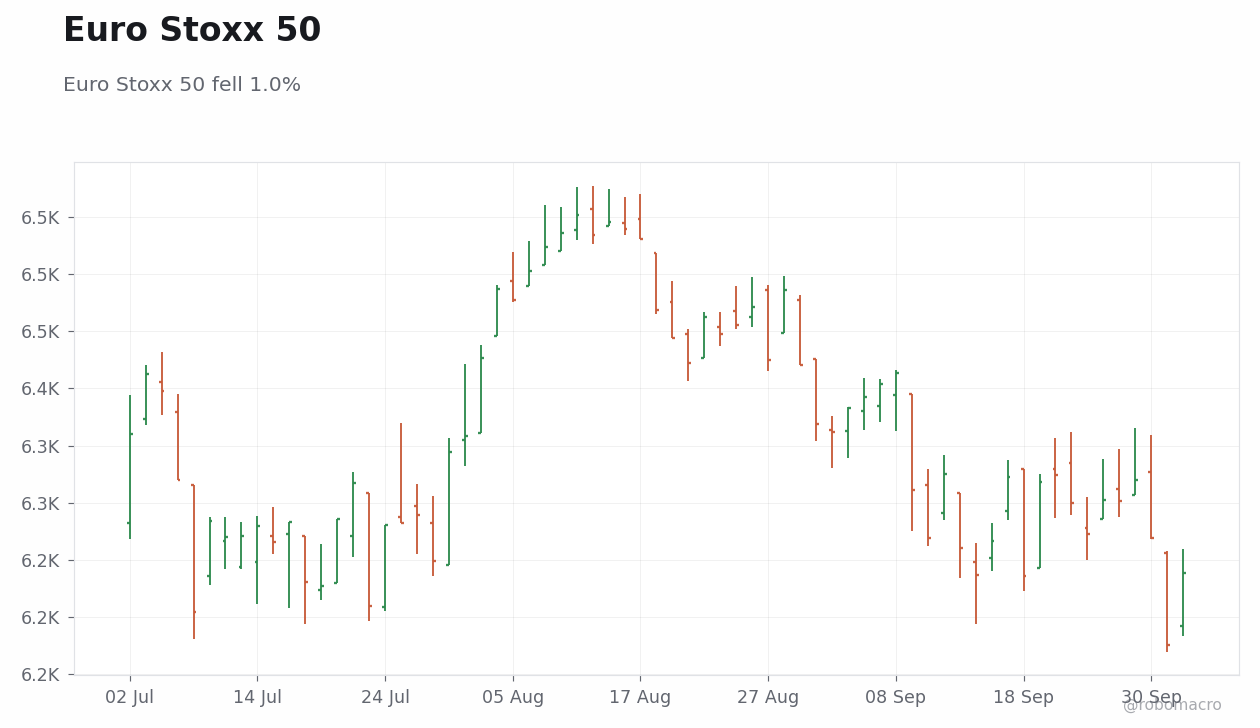
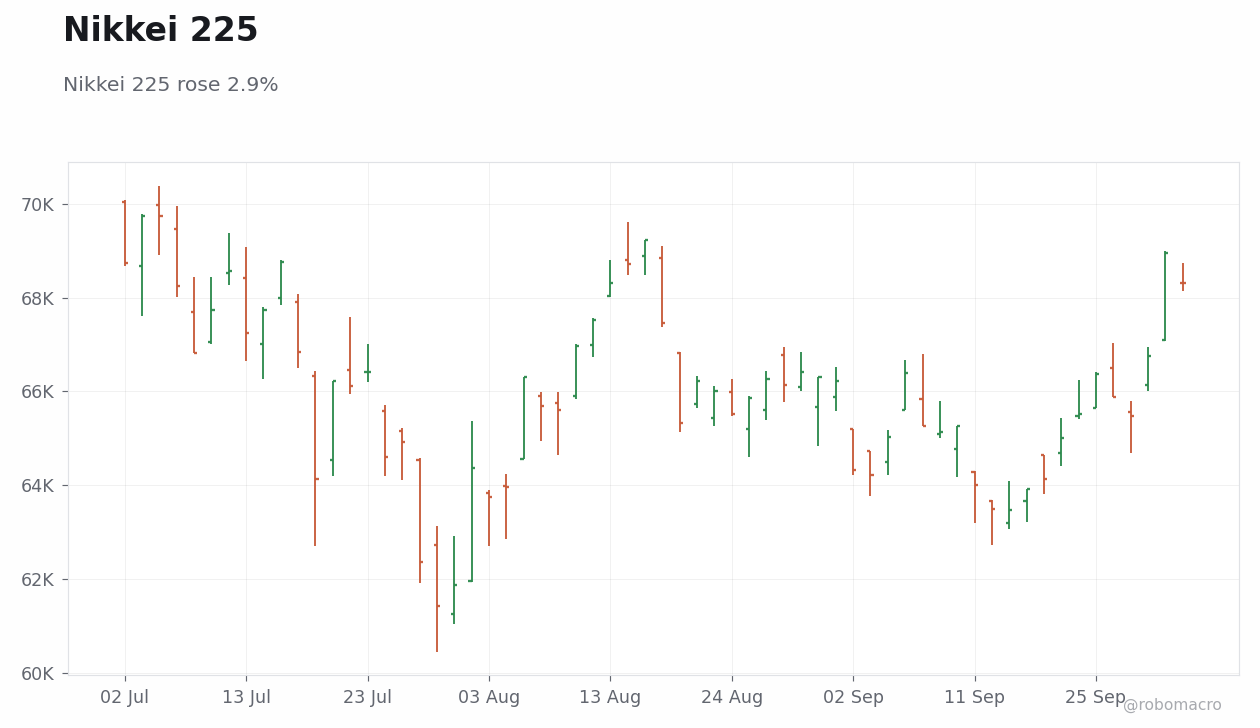
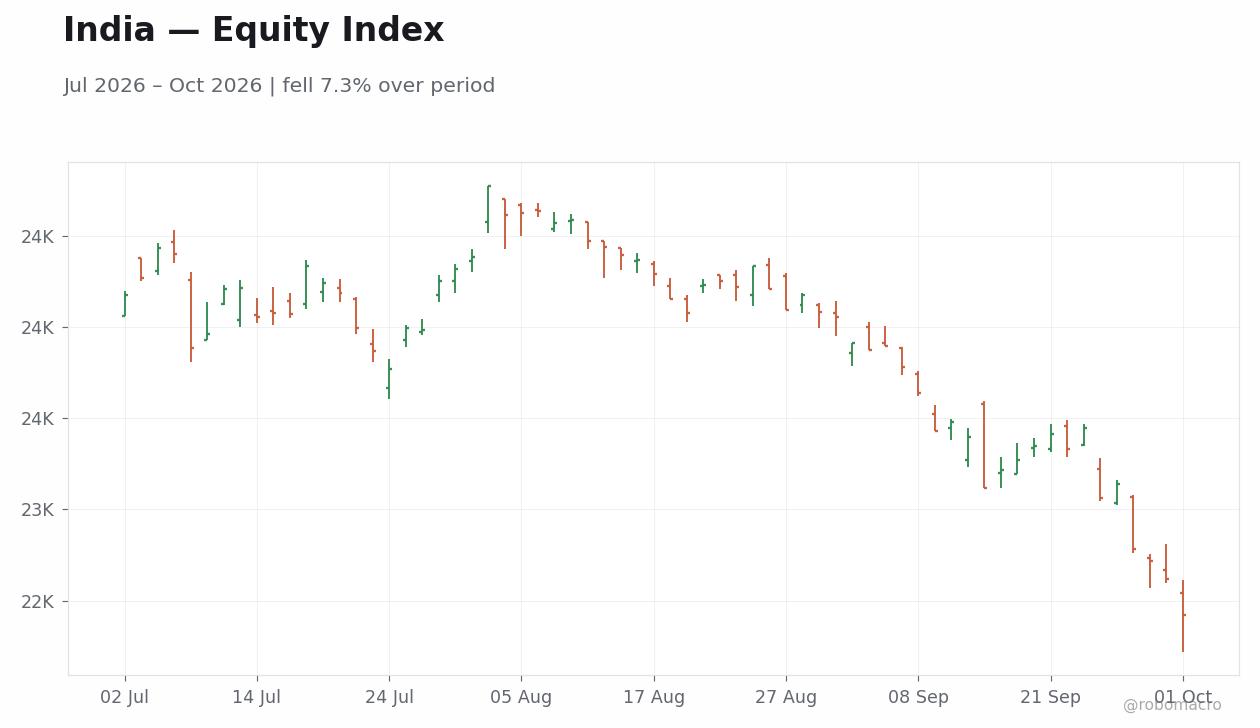
The S&P 500 fell 0.3% week-over-week. The index declined from 7,684 on Monday to 7,671 on Tuesday and 7,652 on Wednesday before rebounding through 7,666 on Thursday to close at 7,723 on Friday. The Nasdaq 100 rose 0.7% to 30,808, advancing every session from 30,277 on Monday. The Dow Jones fell 1.3% to 51,177 while the Russell 2000 declined 0.2% to 2,833. In Europe the Euro Stoxx 50 fell 1.0% to 6,238 after dropping sharply to 6,175 on Thursday. Across Asia and EM the Nikkei 225 gained 2.9% to 68,309 and the Ibovespa surged 4.7% to 192,115 even as the Nifty 50 fell 2.8%, Hang Seng fell 2.2% and JSE Top 40 fell 2.3%.
Regional Divergences
European equities lagged with the FTSE 100 down 2.2%, CAC 40 down 2.2%, FTSE MIB down 2.7% and IBEX 35 down 3.1%. The US showed internal divergence as the Nasdaq 100 rose 0.7% while the Dow Jones fell 1.3%. Japan outperformed sharply with the Nikkei 225 up 2.9% against softer activity data, while Brazil’s Ibovespa jumped 4.7% on the back of record-low unemployment. India’s Nifty 50 fell 2.8% and South Africa’s JSE Top 40 fell 2.3%, highlighting EM differentiation. These splits aligned with country-specific macro catalysts including European inflation surprises, mixed German demand signals, Japanese industrial production misses and Brazil’s resilient labor market prints.
Volatility & Risk Appetite
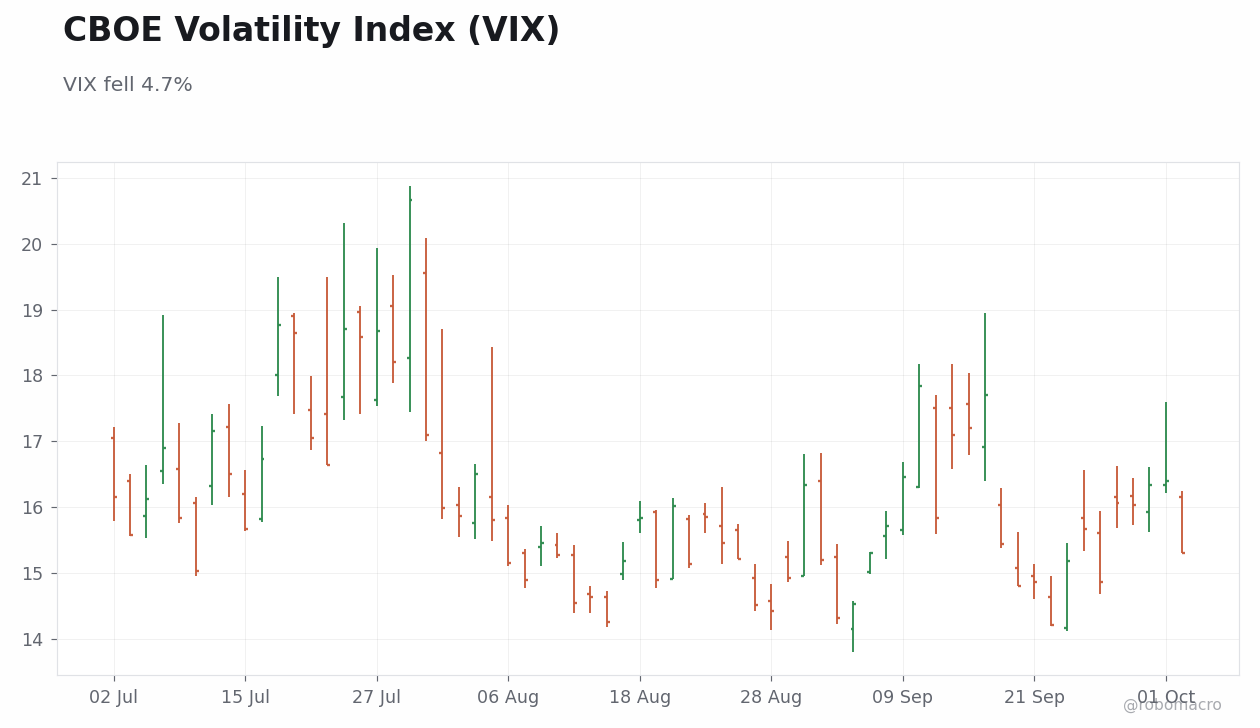
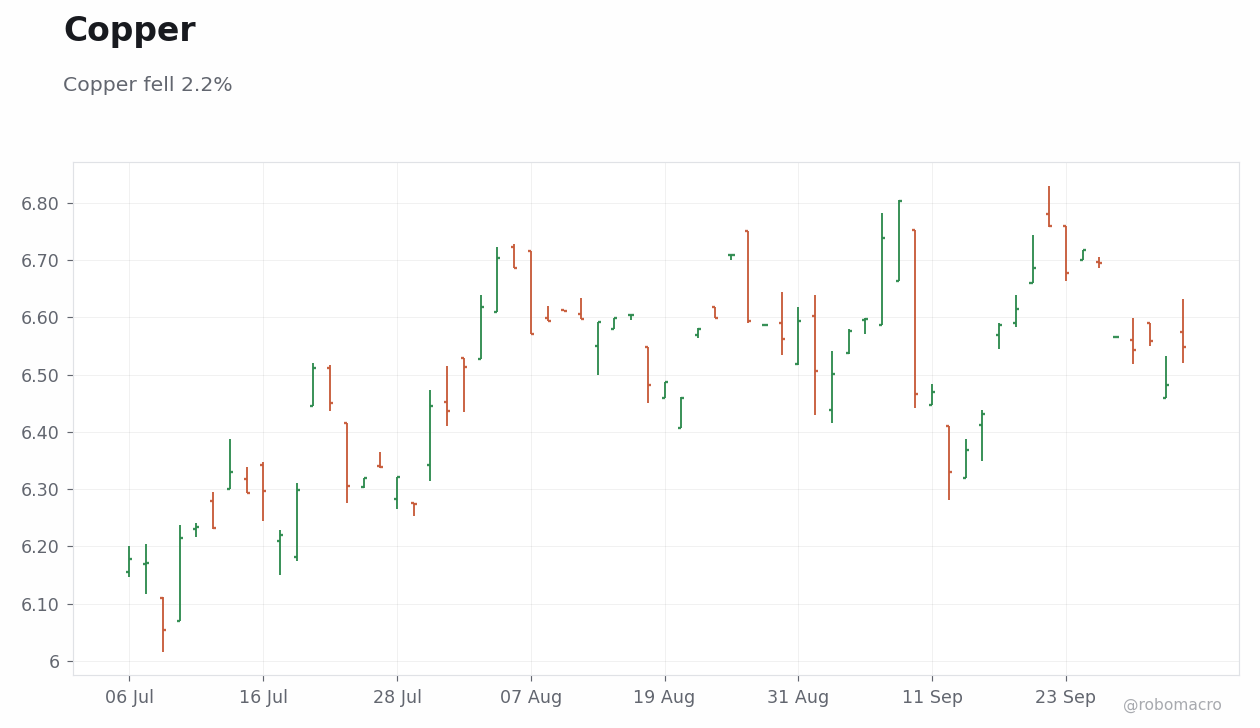
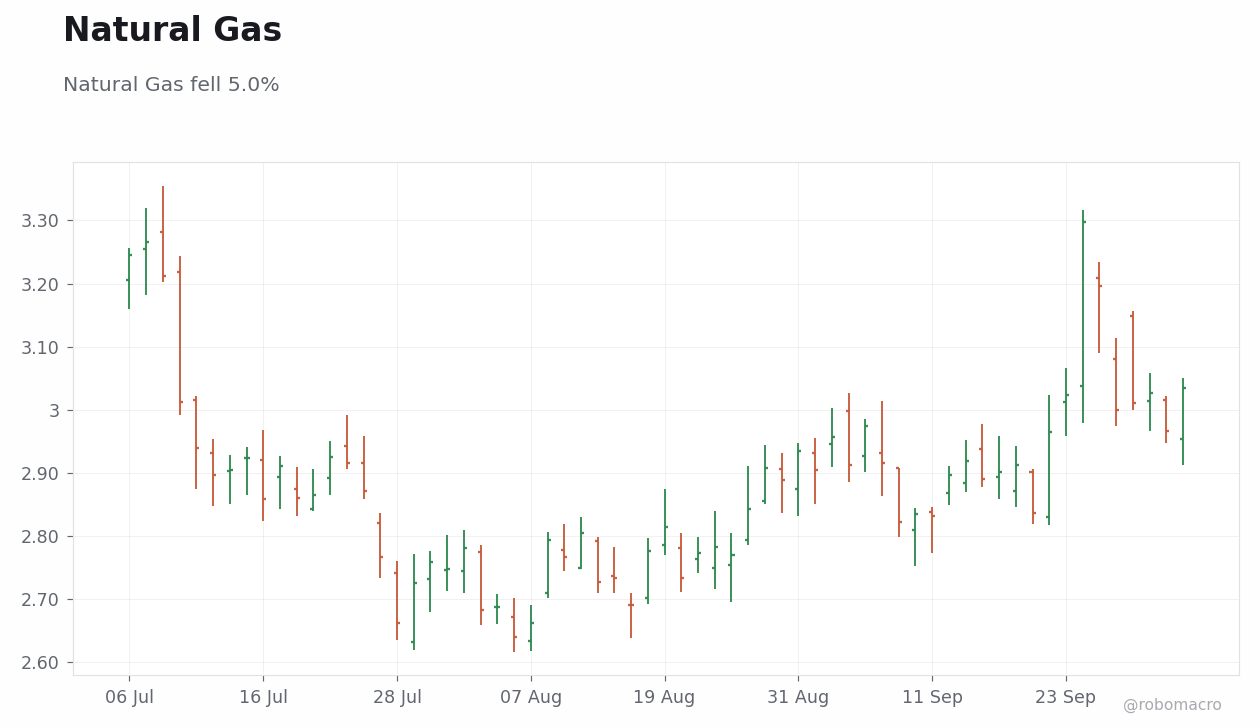
The VIX closed at 15.3 on Friday. Growth outperformed value as the Nasdaq 100 rose 0.7% against the Dow Jones fall of 1.3%. Small versus large performance was nearly identical with the Russell 2000 down 0.2% and the S&P 500 down 0.3%. Commodity moves offered sector signals as WTI Crude fell 1.4%, Brent Crude fell 2.0%, Gold fell 3.7% and Silver fell 6.0%, suggesting pressure on resource and materials equities while Copper fell 2.2% on the week. Natural Gas fell 5.0% and Wheat fell 2.9%, adding to differentiation across cyclical exposures.
Week Ahead
The economic calendar next week is light with no major CPI, payrolls or GDP prints scheduled. Earnings reports will dominate corporate calendars while scattered PMI releases and central bank meeting minutes remain the primary scheduled inputs. These events pose the biggest risk to equity markets through potential surprises in corporate guidance rather than macro data. Overall the setup leans neutral for risk-on or risk-off moves absent outsized earnings deviations.
| Index | Level | WoW | MTD | YTD |
|---|---|---|---|---|
| S&P 500 | 7,723 | -0.3% | +0.7% | +12.6% |
| Nasdaq 100 | 30,808 | +0.7% | +1.0% | +22.2% |
| Dow Jones | 51,177 | -1.3% | +0.5% | +5.8% |
| Russell 2000 | 2,833 | -0.2% | +0.9% | +12.9% |
| S&P/TSX | 35,503 | -0.8% | +1.0% | +11.3% |
| FTSE 100 | 10,462 | -2.2% | +0.3% | +5.1% |
| Euro Stoxx 50 | 6,238 | -1.0% | +1.0% | +5.3% |
| DAX | 25,231 | -0.7% | +1.2% | +2.8% |
| CAC 40 | 7,897 | -2.2% | +0.8% | -3.6% |
| FTSE MIB | 50,483 | -2.7% | +0.5% | +11.3% |
| IBEX 35 | 19,085 | -3.1% | +0.4% | +9.1% |
| Nikkei 225 | 68,309 | +2.9% | -0.9% | +31.8% |
| Hang Seng | 23,972 | -2.2% | 0.0% | -9.0% |
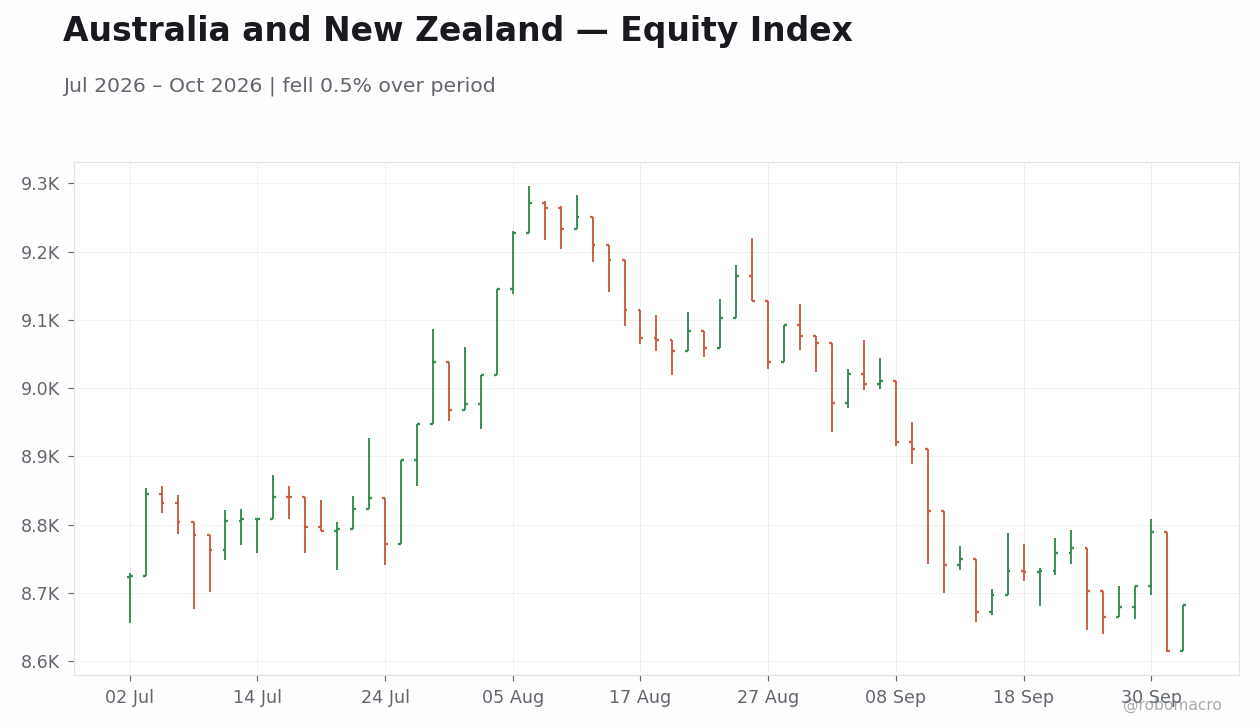
| S&P/ASX 200 | 8,682 | +0.2% | +0.8% | -0.5% |
| KOSPI | 7,004 | -1.1% | +0.5% | +62.5% |
| Nifty 50 | 22,422 | -2.8% | 0.0% | -14.2% |
| Ibovespa | 192,115 | +4.7% | +2.6% | +19.7% |
| IPC Mexico | 64,532 | -0.7% | +1.1% | +0.6% |
| JSE Top 40 | 100,780 | -2.3% | +0.6% | -6.9% |
Ibovespa rose 4.7% while Nikkei 225 gained 2.9%. IBEX 35 led declines, falling 3.1%, followed by Nifty 50 at -2.8% and FTSE MIB at -2.7%. US indices diverged as Nasdaq 100 advanced 0.7% against a 1.3% drop in Dow Jones. European benchmarks retreated broadly, with FTSE 100 and CAC 40 both down 2.2%. KOSPI outperformed on a year-to-date basis at +62.5%, contrasting with Nifty 50’s -14.2% decline. S&P 500 eased 0.3% while Russell 2000 fell 0.2%. Next week, investors will monitor fresh data prints and policy signals for direction on cross-border flows.
| Index | WoW | MTD | YTD |
|---|---|---|---|
| S&P 500 | -0.3% | +0.7% | +12.6% |
| Nasdaq 100 | +0.7% | +1.0% | +22.2% |
| Dow Jones | -1.3% | +0.5% | +5.8% |
| Russell 2000 | -0.2% | +0.9% | +12.9% |
| S&P/TSX | -0.8% | +1.0% | +11.3% |
| FTSE 100 | -2.2% | +0.3% | +5.1% |
| Euro Stoxx 50 | -1.0% | +1.0% | +5.3% |
| DAX | -0.7% | +1.2% | +2.8% |
| CAC 40 | -2.2% | +0.8% | -3.6% |
| FTSE MIB | -2.7% | +0.5% | +11.3% |
| IBEX 35 | -3.1% | +0.4% | +9.1% |
| Nikkei 225 | +2.9% | -0.9% | +31.8% |
| Hang Seng | -2.2% | 0.0% | -9.0% |
| S&P/ASX 200 | +0.2% | +0.8% | -0.5% |
| KOSPI | -1.1% | +0.5% | +62.5% |
| Nifty 50 | -2.8% | 0.0% | -14.2% |
| Ibovespa | +4.7% | +2.6% | +19.7% |
| IPC Mexico | -0.7% | +1.1% | +0.6% |
| JSE Top 40 | -2.3% | +0.6% | -6.9% |


Week in Review
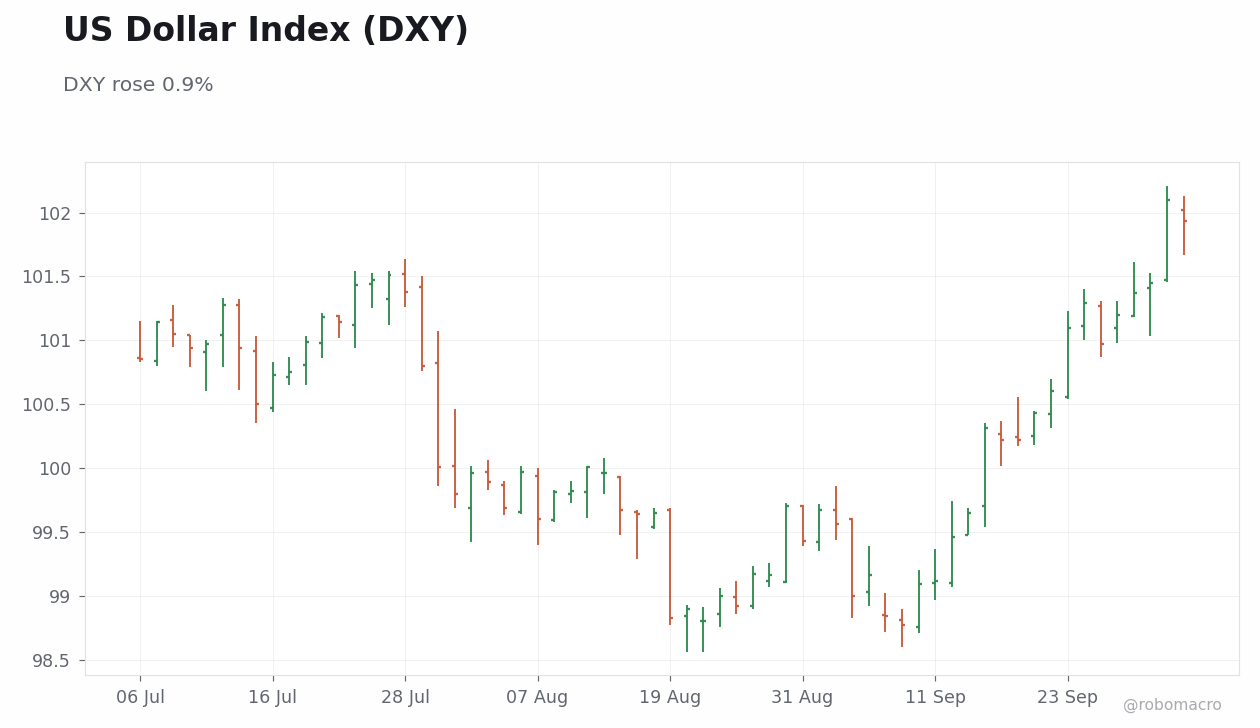
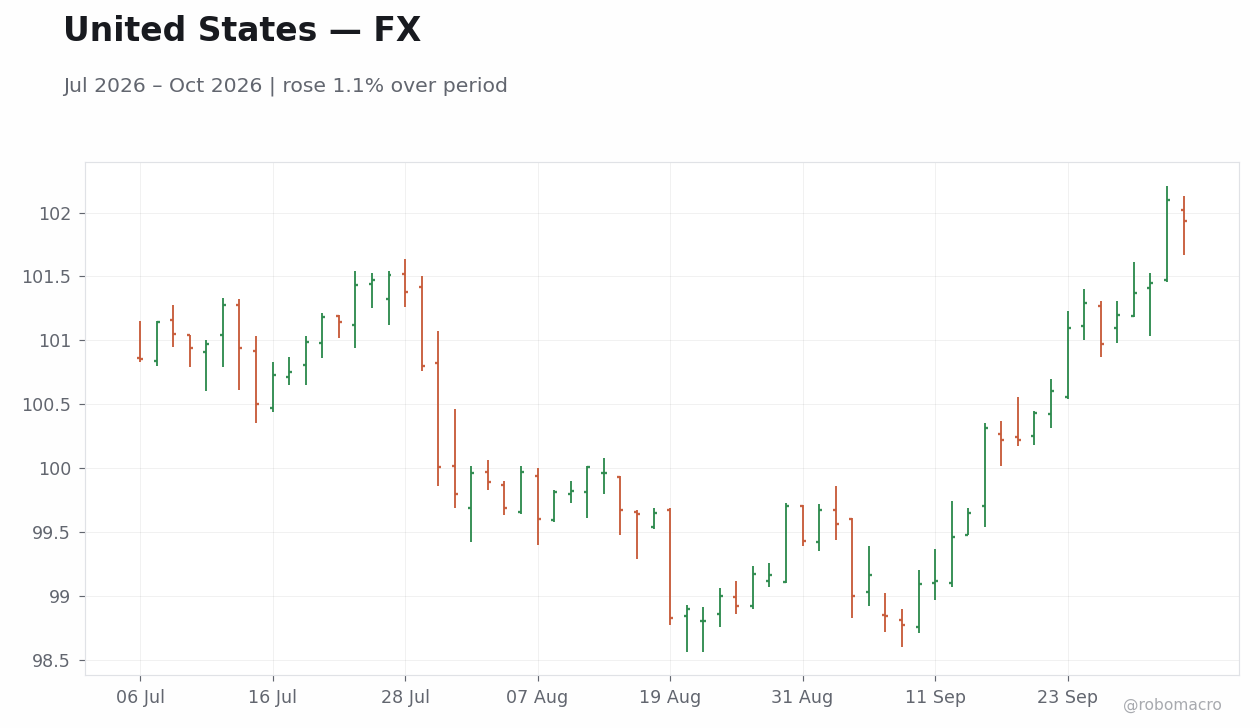
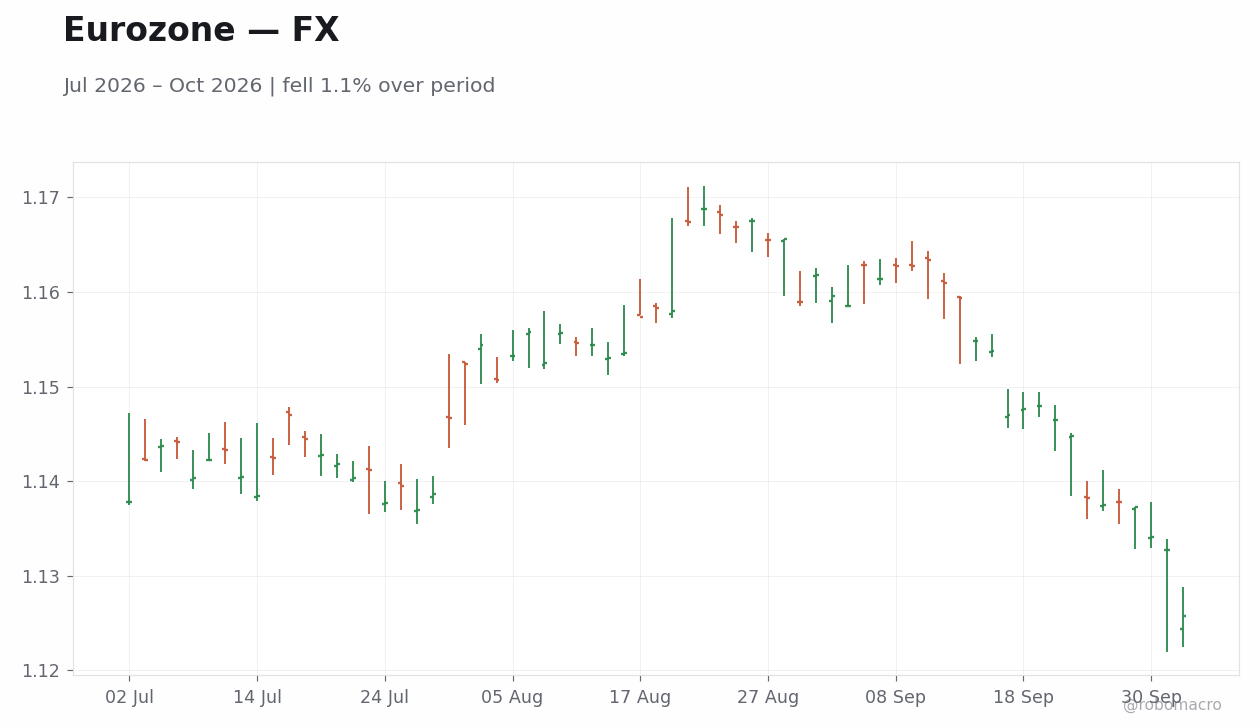
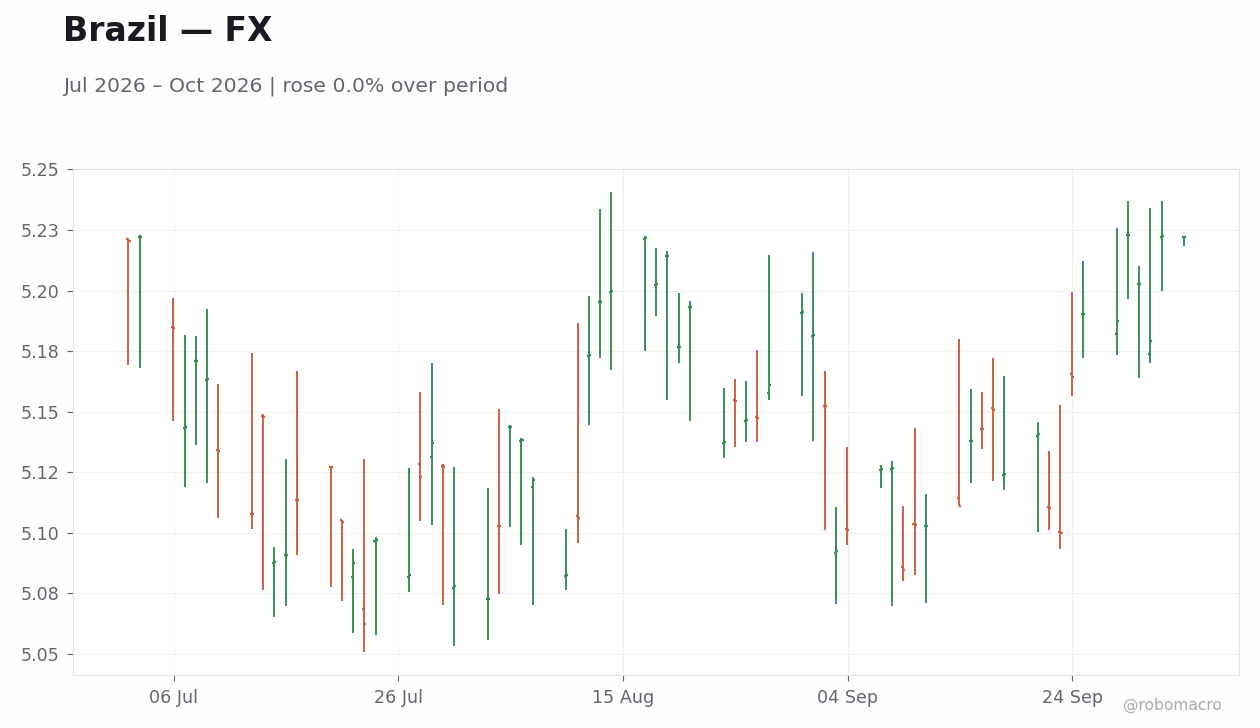
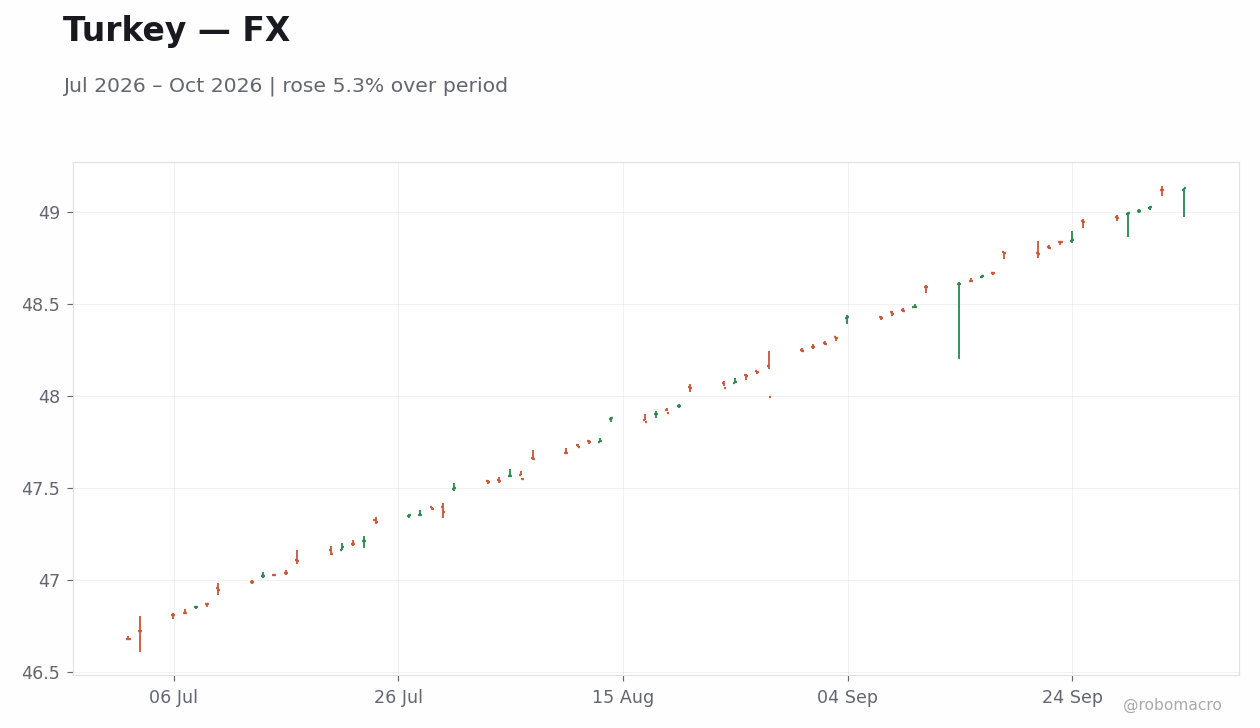
The DXY rose 0.9% week-over-week to close at 101.93. After trading at 101 on Tuesday and Wednesday, it climbed to 102 on Thursday and held that level on Friday. In G10 FX, EUR/USD fell 1.0% to 1.1257, declining steadily from 1.1378 on Monday to 1.1373, 1.1341, 1.1327 and 1.1257 on Friday, while GBP/USD rose 0.2% to 1.3240 with closes of 1.3229, 1.3254, 1.3233, 1.3264 and 1.3240. USD/JPY gained 0.2% to 157.83, steady at 157 from Monday through Wednesday before moving to 158 on Thursday and Friday, and AUD/USD fell 0.7% to 0.6958. In EM FX, USD/MXN surged 2.2% to 18.14, USD/ZAR advanced 2.0% to 16.68, USD/BRL rose 0.7% to 5.2223, USD/TRY increased 0.3% to 49.13, USD/INR gained 0.5% to 96.30 and USD/CNY fell 0.1% to 6.7040.
Dollar & G10
Dollar strength reflected shifts in rate differentials, with the US 10Y rising 6bp to 5.24% against a German 10Y that fell 17bp to 3.45% and a UK 10Y that rose 2bp to 5.38%. The US 2s10s widened to +46bp while the German 2s10s stood at +38bp and the UK 2s10s at +70bp. EUR/USD closed at 1.1257 after its 1.0% weekly decline, GBP/USD ended at 1.3240 after a 0.2% gain, and USD/JPY finished at 157.83 after a 0.2% advance as Japanese 10Y yields rose 4bp to 3.11%. These moves left the dollar broadly firmer against G10 currencies amid mixed rate moves in Canada and Australia where the Canadian 2Y fell 7bp to 3.27% and the Australian 2Y fell 18bp to 4.83%.
EM FX
EM FX was mixed but tilted softer against the dollar, led by a 2.2% rise in USD/MXN to 18.14 and a 2.0% increase in USD/ZAR to 16.68. USD/BRL rose 0.7% to 5.2223 while Brazilian 10Y yields rose 15bp to 14.27%, and USD/TRY gained 0.3% to 49.13 even as Turkish 2Y yields surged 349bp to 40.35% leaving the 2s10s deeply inverted at -474bp. USD/CNY was little changed, falling 0.1% to 6.7040, consistent with modest moves in Chinese yields where the 10Y rose 3bp to 1.70%. These performances occurred alongside varying bond yield differentials versus the US curve that steepened to 2s10s at +46bp.
Bitcoin & Crypto
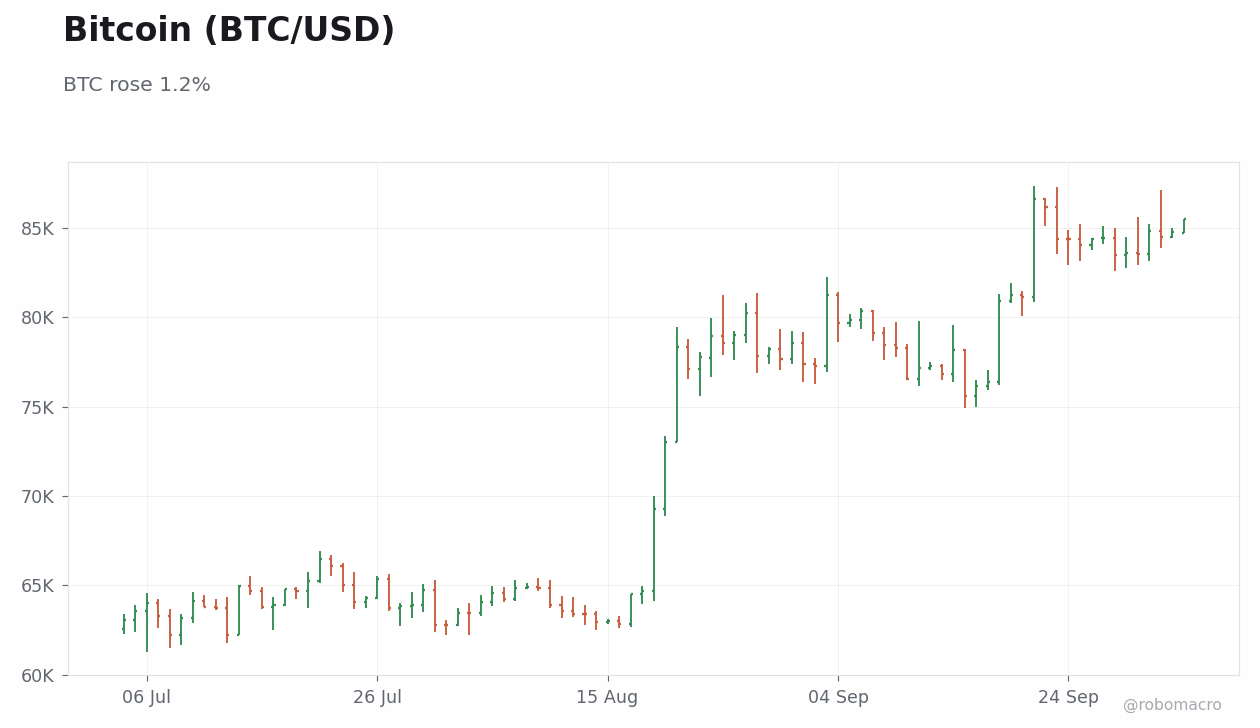
Bitcoin rose 1.2% week-over-week to $85,462 while Ethereum gained 0.5% to $2,701. Bitcoin climbed from 83,554 on Wednesday to 84,853 on Thursday before easing to 84,497 on Friday and recovering to 84,764 on Saturday. Solana fell 1.0% to $121 and XRP declined 0.9% to $2, leaving digital assets modestly mixed amid broader risk sentiment that also saw the Nasdaq 100 rise 0.7% to 30,808. The performance left Bitcoin outperforming Ethereum on the week while altcoins lagged.
Week Ahead
In the week ahead, attention will center on central bank communications and inflation data that could further shape rate differentials across the US, Europe and Asia. Trade balance releases in several EM economies may also influence FX positioning, particularly where commodity exposure remains relevant. No specific crypto regulatory events or ETF deadlines appear on the immediate calendar, leaving on-chain flows and broader risk sentiment as primary drivers for Bitcoin and digital assets. Overall, the period looks set to remain data-dependent with curve shape continuing to reflect varying policy expectations.


Week in Review
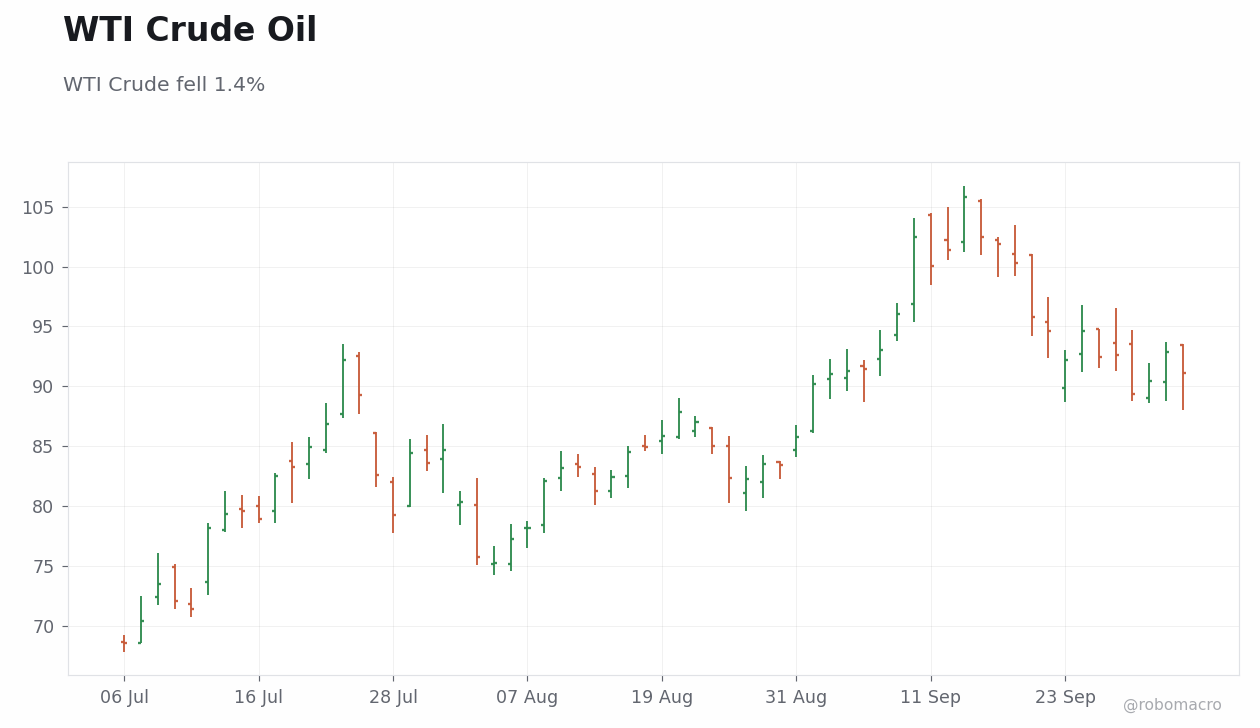
Silver led declines among major commodities, falling 6.0% week-over-week to 60.41. Energy markets softened alongside metals, with WTI Crude declining 1.4% to 91.11 and Brent Crude falling 2.0% to 102.25. Gold decreased 3.7% to 4162.30 while Copper fell 2.2% to 6.55. Natural Gas dropped 5.0% to 3.04 and Wheat declined 2.9% to 683.00. During the week WTI Crude rose from 89.4 on Tuesday to 92.9 on Thursday before closing at 91.1 on Friday. Gold climbed from 4,180 on Tuesday to 4,202 on Thursday before retreating to 4,162 on Friday, mirroring the late-week pullback seen across precious metals.
Energy Complex
WTI Crude settled at 91.11, down 1.4% on the week, while Brent Crude ended at 102.25, down 2.0%. Natural Gas closed at 3.04 after a 5.0% weekly decline, having traded from 3.0110 on Tuesday to a low of 2.9670 on Thursday before recovering to 3.0350 on Friday. The complex faced headwinds from mixed demand signals out of major economies even as geopolitical developments and OPEC+ supply discipline provided a partial floor. Inventory builds and seasonal demand patterns remained key watchpoints for traders navigating the latest leg lower.
Metals & Ags
Gold closed at 4162.30, down 3.7% week-over-week, while Silver fell 6.0% to 60.41, pushing the gold-silver ratio higher. Copper ended at 6.55 after a 2.2% weekly decline but recorded a 1.0% month-to-date gain, offering a modestly constructive signal for global industrial activity. Wheat finished at 683.00, down 2.9% on the week with month-to-date performance flat at 0.0%. Iron Ore dropped 5.9% to 91.35, reflecting softer steel demand momentum in key consuming regions. Overall the metals complex reflected caution on near-term growth while agricultural prices remained range-bound.
Week Ahead
The economic calendar next week contains no major commodity-relevant events. There are no scheduled EIA crude or gas inventories releases, OPEC meetings, China PMI or industrial production data, US CPI prints, or central bank meetings that directly affect commodity currencies such as CAD, AUD or BRL. Market participants will therefore focus on non-calendar risks including geopolitical developments, weather patterns for agriculture, and OPEC diplomacy. Any fresh signals on global demand or supply adjustments are likely to drive positioning in the absence of high-impact data.
| Pair | Level | WoW | MTD | YTD |
|---|---|---|---|---|
| DXY | 101.93 | +0.9% | -0.2% | +3.6% |
| EUR/USD | 1.1257 | -1.0% | -0.6% | -4.2% |
| GBP/USD | 1.3240 | +0.2% | -0.2% | -1.7% |
| USD/JPY | 157.83 | +0.2% | +0.2% | +0.7% |
| AUD/USD | 0.6958 | -0.7% | +0.2% | +4.2% |
| NZD/USD | 0.5623 | -0.5% | -0.2% | -2.3% |
| USD/CAD | 1.4245 | +0.6% | +0.1% | +3.9% |
| USD/CHF | 0.8284 | -0.2% | -0.9% | +4.6% |
| USD/CNY | 6.7040 | -0.1% | -0.0% | -4.2% |
| USD/BRL | 5.2223 | +0.7% | +0.8% | -5.3% |
| USD/MXN | 18.14 | +2.2% | +0.4% | +0.9% |
| USD/INR | 96.30 | +0.5% | +0.4% | +7.0% |
| USD/ZAR | 16.68 | +2.0% | +1.6% | +0.8% |
| USD/TRY | 49.13 | +0.3% | +0.2% | +14.3% |
| Commodity | Level | WoW | MTD | YTD |
|---|---|---|---|---|
| WTI Crude | 91.11 | -1.4% | -1.9% | +59.0% |
| Brent Crude | 102.25 | -2.0% | -0.1% | +68.3% |
| Gold | 4162.30 | -3.7% | -0.9% | -3.9% |
| Silver | 60.41 | -6.0% | -0.5% | -14.4% |
| Copper | 6.55 | -2.2% | +1.0% | +16.1% |
| Natural Gas | 3.04 | -5.0% | +2.3% | -16.1% |
| Wheat | 683.00 | -2.9% | +0.0% | +34.9% |
| Iron Ore | 91.35 | -5.9% | 0.0% | -14.8% |
| Asset | Level | WoW | MTD | YTD |
|---|---|---|---|---|
| Bitcoin | $85,462 | +1.2% | +0.7% | -3.7% |
| Ethereum | $2,701 | +0.5% | -0.2% | -10.0% |
| Solana | $121 | -1.0% | +2.1% | -4.7% |
| XRP | $2 | -0.9% | +0.7% | -19.9% |
The dollar index rose 0.9% to 101.93, led by sharp gains in USD/MXN (+2.2% to 18.14) and USD/ZAR (+2.0% to 16.68). EUR/USD dropped 1.0% to 1.1257 while AUD/USD fell 0.7% to 0.6958, extending losses against the broadly firmer greenback. GBP/USD bucked the trend with a 0.2% gain to 1.3240, diverging from euro-area peers. USD/CNY eased just 0.1% to 6.7040 as Asian currencies showed relative resilience. USD/INR and USD/TRY posted smaller advances of 0.5% and 0.3%, respectively. Attention next week turns to fresh inflation prints and central-bank speeches for signs of sustained USD momentum.
| Asset | Level | WoW |
|---|---|---|
| S&P 500 | 7722.72 | +0.5% |
| Nasdaq 100 | 30807.93 | +1.8% |
| Dow Jones | 51176.96 | -0.6% |
| Russell 2000 | 2832.9 | +0.5% |
| USD/JPY | 157.83 | +0.2% |
| EUR/USD | 1.13 | -1.1% |
| GBP/USD | 1.32 | +0.1% |
| Gold | 4162.3 | -0.1% |
| WTI Crude | 91.11 | -1.6% |
| Bitcoin | 85430.02 | +1.1% |


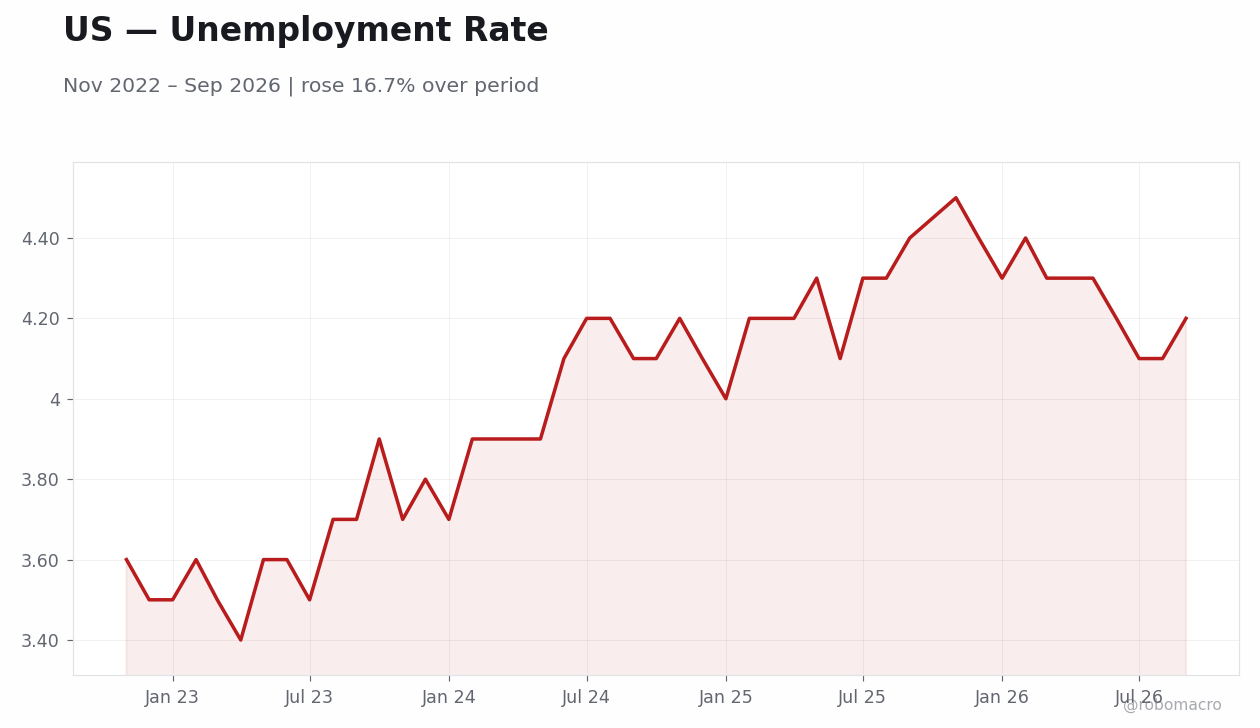
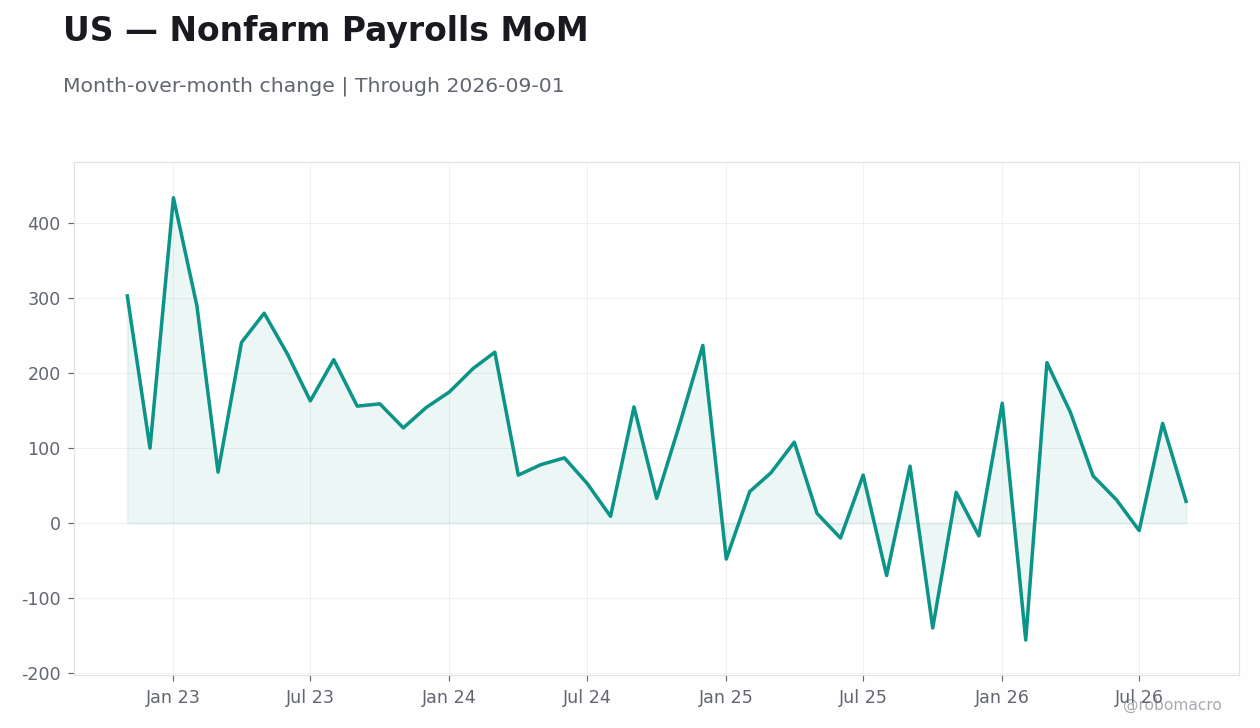
Labor market shows resilience fading. Nonfarm payrolls printed below consensus and the prior month’s gain. The unemployment rate moved higher while annual wage growth eased below expectations. Monthly wage growth slowed. These prints reinforced the view that labor demand is cooling without abrupt deterioration.
Inflation and growth signals diverge. Core PCE rose below consensus month-over-month while the year-over-year rate held steady. Final Q3 GDP growth was lifted above the forecast, confirming underlying momentum. ADP employment surprised higher versus expectations.
Consumer and manufacturing gauges soften. Conference Board Consumer Confidence fell. The Dallas Fed Manufacturing Index slipped. ISM Manufacturing PMI printed below consensus. JOLTs job openings declined and missed forecasts. S&P/Case-Shiller home prices accelerated above consensus.
Policy communications remain steady. Federal Reserve speakers addressed audiences across the week without altering the data-dependent stance. Markets absorbed the mixed releases while the 2-year Treasury yield climbed before closing the period lower.
Federal Reserve speakers addressed markets during the week with no material change in forward guidance. Comments focused on data dependence without signaling imminent adjustments to the policy rate.
Core PCE softening month-over-month and the labor market miss on payrolls reinforced the view that incoming prints will continue to guide the medium-term rate path. Final Q3 GDP supported the assessment that growth remains solid enough to avoid near-term easing pressure.
The 2-year yield’s intraday move reflected limited repricing of policy expectations after the mixed data. Officials maintained the stance that the policy rate remains appropriate pending further evidence on inflation persistence and labor-market balance. No new projections or dot-plot updates were released.
Core PCE inflation rose below consensus month-over-month, easing near-term price pressure while the year-over-year rate stayed steady. Final Q3 GDP growth was revised higher quarter-over-quarter, lifting the growth outlook even as personal spending rose less than expected. ADP employment change beat forecasts.
Nonfarm payrolls added fewer jobs than consensus and the prior print, while the unemployment rate rose. Annual wage growth slowed and missed consensus. Monthly wage growth printed below expectations. JOLTs job openings fell below the forecast and prior level.
S&P/Case-Shiller home prices rose above consensus. Conference Board Consumer Confidence dropped. ISM Manufacturing PMI came in below expectations, while the employment sub-index rose. Factory orders rose in line with the revised consensus. Weekly jobless claims printed below expectations. These releases together point to a mid-cycle expansion with cooling labor demand and contained inflation supporting a steady Federal Reserve policy rate path.
| Date | Ctry | Event | Prior | Cons. | Actual |
|---|---|---|---|---|---|
| Mon 28 | US | Speech by Fed's Bowman | - | - | - |
| Mon 28 | US | Un General Assembly | - | - | "" |
| Mon 28 | US | Dallas Fed Manufacturing I | 11.6 | - | 9.8 |
| Mon 28 | US | 3-Month Treasury Bill Auct | 4.0 | - | 4.1 |
| Mon 28 | US | 6-Month Treasury Bill Auct | 4.2 | - | 4.3 |
| Mon 28 | US | Speech by Fed's Barkin | - | - | - |
| Tue 29 | US | Redbook Retail Sales Year- | 7.6 | - | 8.2 |
| Tue 29 | US | S&P/Case-Shiller Home Pric | 2.2 | 2.2 | 2.5 |
| Tue 29 | US | House Price Index | 442 | - | 444 |
| Tue 29 | US | House Price Index Month-ov | 0 | 0.10 | 0.30 |
| Tue 29 | US | House Price Index Year-ove | 2.3 | - | 2.6 |
| Tue 29 | US | S&P/Case-Shiller Home Pric | 0.40 | - | 0 |
| Tue 29 | US | Ny Fed Bill Purchases 1 To | - | - | - |
| Tue 29 | US | JOLTs Job Openings | 7.3mn | 7.2mn | 7.1mn |
| Date | Release | Prior | Cons. |
|---|---|---|---|
| 2026-10-05 | Services Sector PMI | 55.4 | 55.7 |
| 2026-10-06 | ADP Employment Change Weekly | 20K | - |
| 2026-10-06 | Exports Level | 310.7bn | - |
| 2026-10-06 | Imports Level | 399.3bn | - |
| 2026-10-06 | Trade Balance | -88.6bn | -89.8bn |
| 2026-10-06 | Speech by Fed's Williams | - | - |
| 2026-10-06 | Speech by Fed's Bowman | - | - |
| 2026-10-06 | API Weekly Crude Oil Stocks | 1.0mn | - |
| 2026-10-06 | Speech by Fed's Logan | - | - |
| 2026-10-07 | MBA 30-Year Mortgage Rate | 7.3 | - |


Monday brings Japan Consumer Confidence at 35.3 expected. Tuesday features US ISM Services PMI and factory orders alongside speeches from several Federal Reserve officials. Wednesday includes ADP employment, ISM non-manufacturing, and trade balance data.
Thursday highlights weekly jobless claims and speeches from additional Federal Reserve participants. Friday delivers the University of Michigan consumer sentiment reading. Markets will focus on services-sector strength and any further labor-market signals to assess whether the recent payrolls softening persists.
Central bank speakers scheduled across the week will be monitored for any evolution in tone following the softer core PCE and employment prints. The data flow will inform views on whether growth momentum can coexist with cooling labor demand without altering the policy rate trajectory.
The sharp payrolls miss raises downside risks to the growth outlook if subsequent prints confirm labor-market cooling. Upside risks remain from the final GDP print and resilient ADP employment. Consumer confidence signals potential downside to spending if price concerns intensify.
Positioning appears aligned with continued dollar strength, as USD/JPY held near 157.83 despite the softer inflation data. Volatility in the 2-year yield after the intraday jump suggests markets remain sensitive to labor and inflation surprises. Flow data show limited rotation out of equities despite the mixed releases, consistent with mid-cycle resilience.
The S&P 500 closed at 7722.72, up 0.51 percent week-over-week after trading lower mid-week. The Nasdaq 100 ended at 30807.93, gaining 1.75 percent over the period, while the Dow Jones finished at 51176.96, down 0.59 percent. The Russell 2000 closed at 2832.90, up 0.53 percent.
The 2-year Treasury yield rose from earlier in the week after jumping intraday, while the 10-year yield advanced. USD/JPY reached 157.83, up 0.23 percent week-over-week. EUR/USD declined, and GBP/USD closed higher.
WTI Crude ended at 91.11, down 1.61 percent week-over-week after moving higher intraday. Gold closed at 4162.30, down 0.15 percent. Bitcoin finished at 85430.02, up 1.15 percent. Equity gains coincided with softer inflation data while rising yields reflected limited near-term policy easing expectations.
Dollar strength persisted with USD/JPY at 157.83 and EUR/USD at 1.13, extending the pattern seen in prior weeks where US yield support outweighed incremental tightening elsewhere. Brent crude’s earlier reversal continued to ease imported inflation risks for net-energy importers without shifting US data dependence.
Japan’s finance minister stated the government views reflation policy as over, leaving USD/JPY elevated near 157.83. European fiscal-spread concerns remained contained while US 10-year yields rose. Trade developments provided modest support to sentiment without altering the broader cross-border capital flow dynamics.
| Asset | Level | WoW |
|---|---|---|
| Euro Stoxx 50 | 6238.5 | -1.0% |
| DAX | 25231.2 | -0.6% |
| CAC 40 | 7897.19 | -2.2% |
| EUR/USD | 1.13 | -1.1% |
| EUR/GBP | 0.85 | -1.2% |
| EUR/JPY | 177.21 | -1.1% |
| Gold | 4162.3 | -0.1% |
| Brent Crude | 102.25 | -2.9% |
| Bitcoin | 85430.02 | +1.1% |


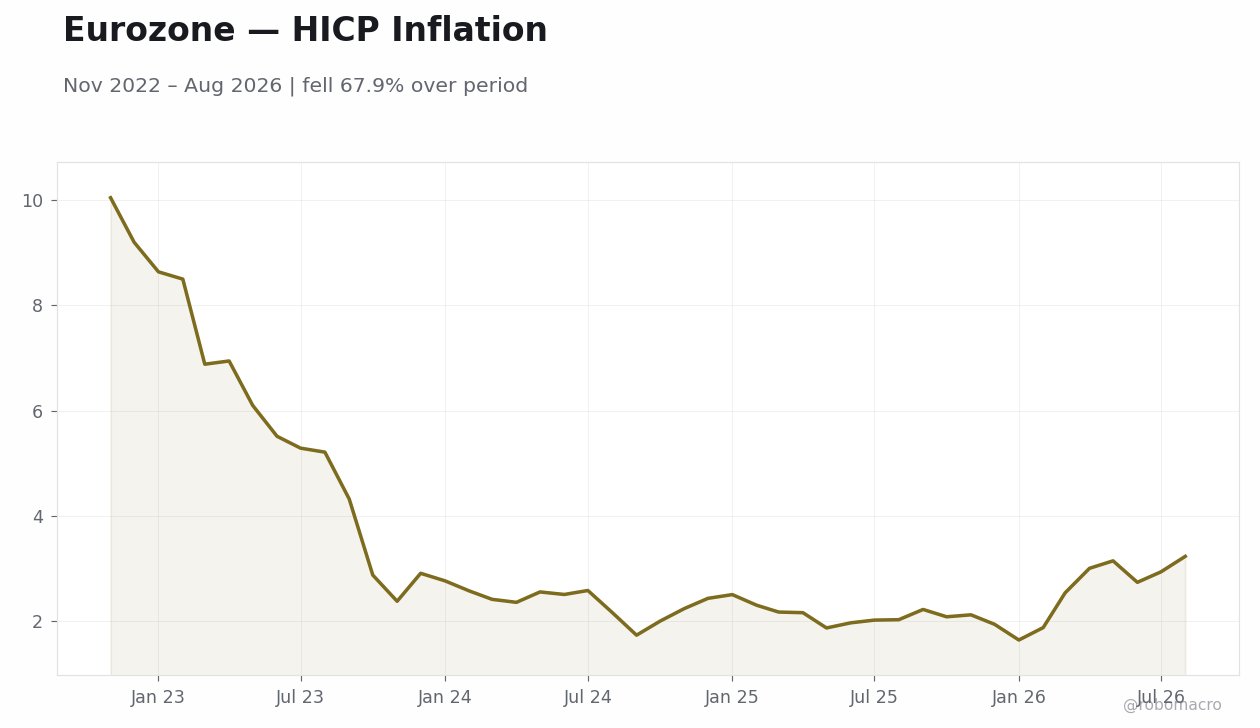
Inflation prints surprise higher across core states. Spanish, French and Italian inflation releases exceeded consensus, with month-over-month rates showing mixed moderation. These outcomes directly raised the bar for Eurozone HICP projections.
Labor market and demand signals diverge. German retail sales advanced month-over-month, beating the prior reading, though the year-over-year figure contracted. Unemployment held steady while the number of unemployed persons increased, extending the soft trend. Spanish and Italian manufacturing PMIs improved above consensus levels.
Markets price reduced easing odds. Equity indices closed lower across the session. Bund yields rose modestly. The euro weakened against the dollar, consistent with the inflation-driven repricing.
Fiscal concerns remain secondary. Comments from Banque de France reiterated that sovereign debt risks require domestic spending restraint, yet market focus stayed on the CPI sequence. No Governing Council speakers altered forward guidance during the week.
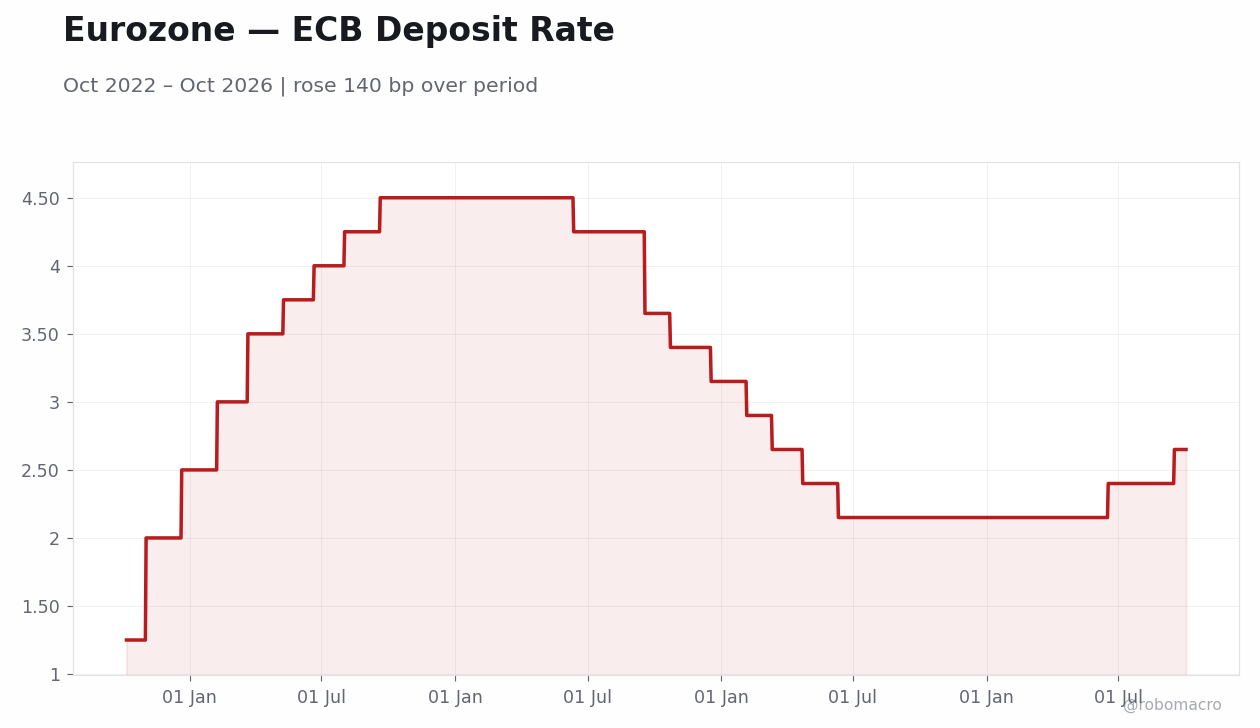
No European Central Bank policy decision or minutes were released during the week. Banque de France Governor Moulin stated that France cannot rely on the ECB to resolve sovereign debt risks and must cut spending. No other Governing Council members delivered speeches that altered forward guidance. The inflation surprises in Spain, France and Italy raised the bar for the medium-term rate path by demonstrating stickier price momentum than the September consensus had incorporated. German retail sales and unemployment data provided no offsetting growth impulse that would accelerate easing. Markets therefore adjusted expectations toward fewer policy-rate cuts over the coming quarters while remaining data-dependent. The configuration leaves the ECB in a holding pattern until the next inflation and activity releases clarify whether the September prints represent a one-off or a sustained deviation.
Spanish preliminary inflation beat expectations with the year-over-year rate above consensus and prior, while the month-over-month rate eased. French inflation printed above consensus and prior, with the month-over-month rate at a less negative reading than expected. Italian CPI rose more than forecast. German retail sales increased month-over-month though the year-over-year print contracted. The German unemployment rate remained unchanged while the number of unemployed persons increased more than expected. Spanish and Italian manufacturing PMIs reached levels above consensus. These releases collectively signal persistent price pressures that keep the Eurozone in a mid-cycle phase where inflation convergence remains incomplete. The data support a slower pace of policy-rate reductions than markets had anticipated earlier, with growth signals remaining selective rather than broad-based.
| Date | Ctry | Event | Prior | Cons. | Actual |
|---|---|---|---|---|---|
| Mon 28 | FI | Business Confidence Index | 6.0 | - | 3.0 |
| Mon 28 | FI | Consumer Confidence Index | -3.0 | - | -4.9 |
| Mon 28 | AT | UniCredit Bank Manufacturi | 54.4 | - | 54.9 |
| Mon 28 | BE | Olo Auction | - | - | - |
| Mon 28 | FR | 12-Month BTF Auction | 3.2 | - | 3.2 |
| Mon 28 | FR | 3-Month BTF Auction | 2.6 | - | 2.7 |
| Mon 28 | FR | 6-Month BTF Auction | 2.9 | - | 2.9 |
| Tue 29 | DE | Bundesbank President Nagel | - | - | - |
| Tue 29 | ES | Inflation Rate Month-over- | 0.70 | - | 0.30 |
| Tue 29 | ES | Inflation Rate Year-over-Y | 4.3 | 4.7 | 4.9 |
| Tue 29 | ES | Core Inflation Rate Year-o | 2.9 | - | 3.1 |
| Tue 29 | ES | Harmonised Inflation Rate | 0.70 | - | 0.60 |
| Tue 29 | ES | Harmonised Inflation Rate | 4.6 | - | 5.0 |
| Tue 29 | ES | Retail Sales Month-over-Mo | -1.0 | - | 0.30 |
| Date | Release | Prior | Cons. |
|---|---|---|---|
| 2026-10-05 | S&P Global Services PMI | 57.8 | 57.1 |
| 2026-10-05 | S&P Global Services PMI | 55.2 | - |
| 2026-10-06 | Factory Orders Month-over-Month | 2.5 | -0.90 |
| 2026-10-06 | Industrial Production Month-over-Mo | -0.40 | 0.20 |
| 2026-10-07 | Industrial Production Month-over-Mo | -1.1 | 1.4 |
| 2026-10-07 | Trade Balance | -6.7bn | -6.5bn |
| 2026-10-08 | Trade Balance | 21.3bn | 19.2bn |
| 2026-10-08 | Exports Month-over-Month | -0.80 | - |
| 2026-10-09 | Industrial Production Month-over-Mo | 0.70 | 0 |
Spain and Italy services PMI prints will provide the first post-inflation read on activity momentum. German and French industrial production data mid-week will test whether the retail sales rebound extends into manufacturing. Italian and Spanish unemployment figures later in the week carry medium impact and will update labor-market slack assessments. No European Central Bank speakers are scheduled in the immediate window, keeping focus on hard data. The Netherlands inflation year-over-year release will add to the HICP mosaic. These releases matter because they will either reinforce or moderate the upside inflation surprise from the prior week and shape the October policy-meeting narrative. Composite PMI updates across the euro area will also inform growth projections ahead of the next ECB staff forecast round.
The inflation overshoots shift the balance of risks toward a slower policy-rate trajectory, reducing the probability of an accelerated easing cycle. Upside inflation scenarios now carry higher weight given consecutive core-state beats, while downside growth risks remain contained by the German retail sales rebound. Market positioning appears to have underpriced the persistence of price pressures, as evidenced by the rise in the German 10-year yield. Volatility in EUR crosses may increase if subsequent PMI prints disappoint relative to the inflation signal. Flows into Bunds could stabilize if fiscal-spread concerns in France re-emerge, yet the dominant driver remains the inflation data sequence. The configuration leaves limited room for dovish repricing unless October activity data deteriorate sharply.
Euro Stoxx 50 closed the week lower. The DAX ended lower while the CAC 40 fell more sharply. German 10-year Bund yields rose modestly and the 2-year yield declined. EUR/USD fell, EUR/GBP declined and EUR/JPY dropped. Brent crude declined while gold moved lower. Equity weakness concentrated when French and Italian CPI prints exceeded forecasts. The euro’s net depreciation occurred steadily across the four trading sessions.
Dollar strength persisted through the week, with EUR/USD declining amid broad USD gains against multiple crosses. Brent crude fell, easing imported inflation pressure for the euro area yet failing to offset domestic CPI surprises. No major trade-policy shifts affecting euro-area exports emerged in the seven-day window. The combination of external dollar momentum and contained commodity prices leaves euro-area asset performance driven primarily by local inflation and demand prints rather than global spillovers.
| Asset | Level | WoW |
|---|---|---|
| Nikkei 225 | 68309.46 | +3.7% |
| USD/JPY | 157.83 | +0.2% |
| EUR/JPY | 177.21 | -1.1% |
| GBP/JPY | 208.39 | +0.1% |
| Gold | 4162.3 | -0.1% |
| Brent Crude | 102.25 | -2.9% |
| Bitcoin | 85430.02 | +1.1% |


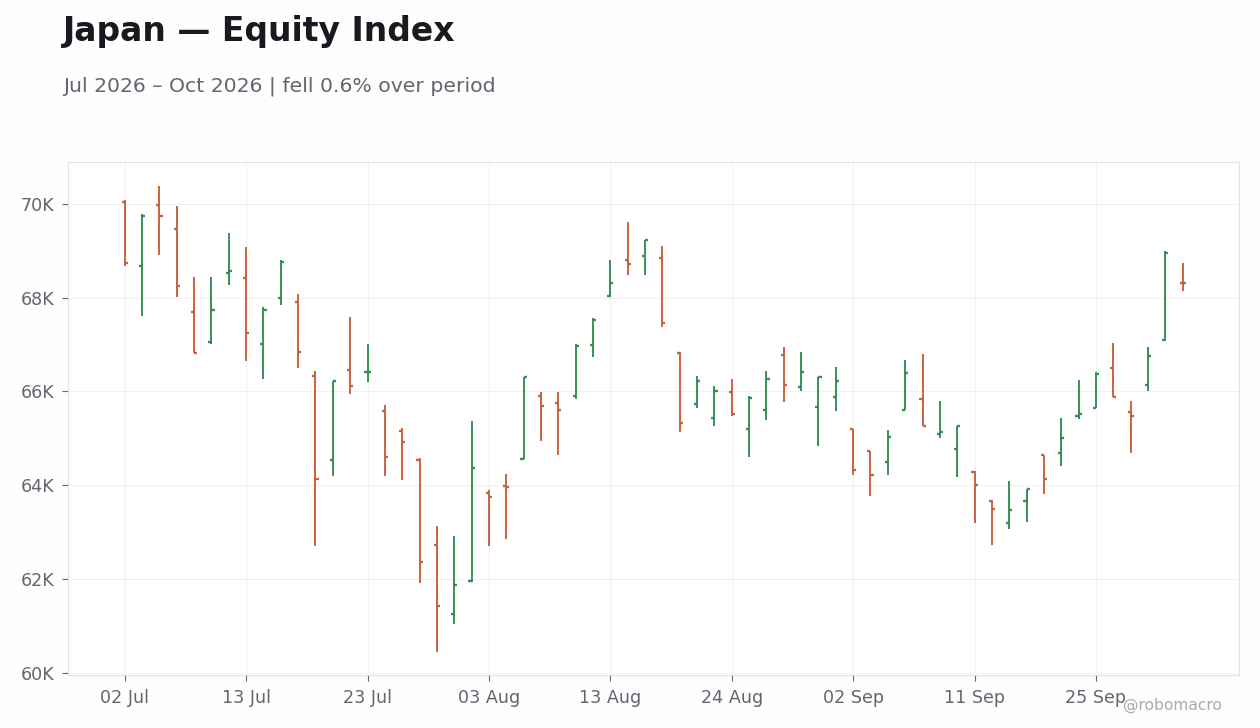
Activity data miss expectations sharply. Industrial production contracted month-over-month in the preliminary September reading, reversing the prior outcome and landing below consensus. Retail sales growth slowed year-over-year and undershot forecasts. Housing starts rose at a softer pace than both consensus and the prior figure. These releases collectively pointed to weaker domestic demand than anticipated.
Corporate surveys hold firmer. The Tankan Large Manufacturers Index advanced from the prior reading and nearly matched consensus, signalling steady business optimism. The Bank of Japan released its Summary of Opinions alongside the survey, with the minutes showing explicit discussion of faster hikes to secure the inflation target. Unemployment remained near historic lows.
Markets absorb mixed signals. The Nikkei 225 closed the week higher after intraday swings. USD/JPY finished little changed from the prior Friday. The 2-year JGB yield rose while the 10-year yield eased. Service inflation at multi-year highs continued to support the case for further policy normalisation despite the activity shortfall.
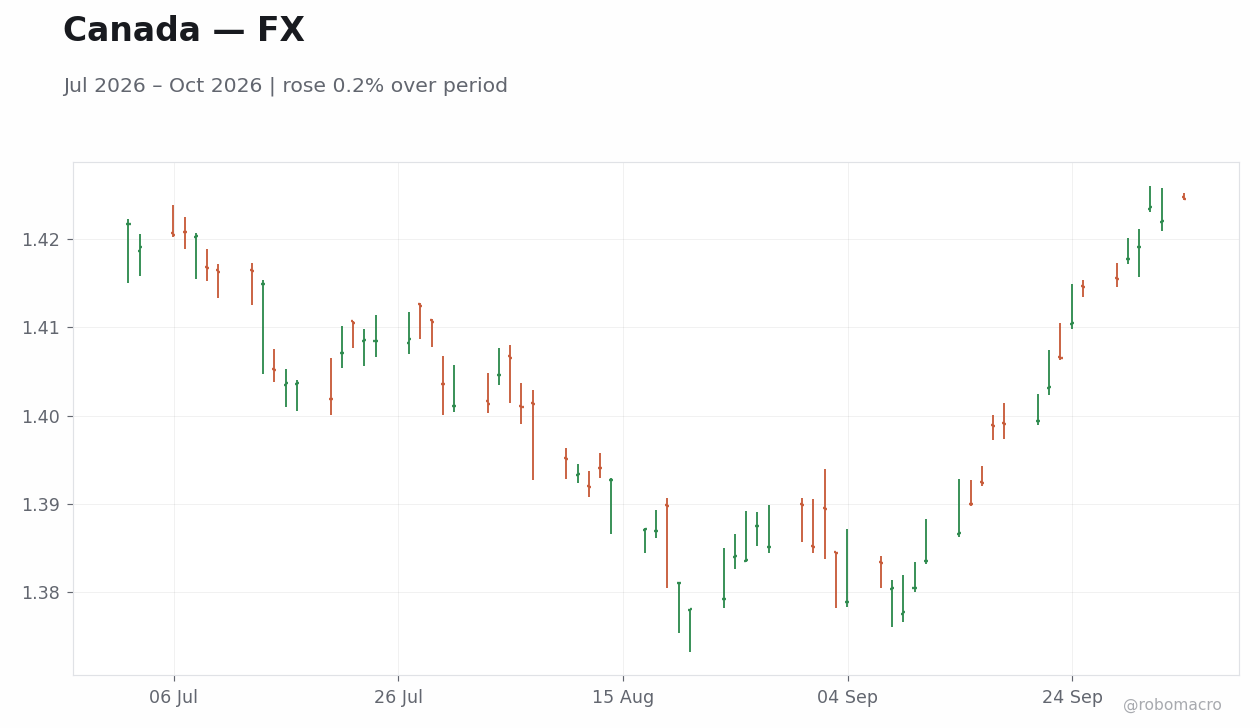
Policy communication reinforces data dependence. Officials repeatedly stressed Bank of Japan independence while noting the need for government coordination on yen stability. Verbal intervention warnings intensified early in the week before authorities paused after modest yen gains. The configuration leaves incoming prints as the dominant driver for the timing of upcoming decisions.
July minutes released over the weekend revealed policymakers debating the need for faster rate hikes to anchor 2% inflation rather than tolerating further undershoots. The Summary of Opinions published on 30 September provided additional colour on those views without altering the data-dependent framework. Soft industrial production and retail sales prints introduced downside risks to the growth backdrop that officials will weigh against still-elevated service inflation. The Tankan reading offered reassurance on corporate resilience but fell short of consensus, tempering any immediate acceleration signal. Overall, the week’s communications and releases kept the focus on sequential data confirming sustained price pressures before any further adjustment at the next meeting.
| Date | Ctry | Event | Prior | Cons. | Actual |
|---|---|---|---|---|---|
| Mon 28 | JP | 40-Year JGB Auction | 3.9 | - | 4.1 |
| Tue 29 | JP | Coincident Index Final | 119 | - | 121 |
| Tue 29 | JP | Leading Economic Index Fin | 116 | 118 | 118 |
| Tue 29 | JP | Industrial Production Mont | -0.20 | 1.7 | -1.7 |
| Tue 29 | JP | Retail Sales Year-over-Yea | 3.7 | 3.3 | 2.7 |
| Tue 29 | JP | Industrial Production Year | 3.9 | - | 3.4 |
| Tue 29 | JP | Retail Sales Month-over-Mo | 2.1 | - | -1.2 |
| Tue 29 | JP | 2-Year JGB Auction | 1.7 | - | 2.0 |
| Wed 30 | JP | Housing Starts Year-over-Y | 8.2 | 7.0 | 6.1 |
| Wed 30 | JP | Construction Orders Year-o | -13.4 | - | -3.6 |
| Wed 30 | JP | Tankan Large Manufacturers | 22.0 | 25.0 | 24.0 |
| Wed 30 | JP | BoJ Summary of Opinions | - | - | - |
| Wed 30 | JP | Foreign Bond Investment Le | 1091.0bn | - | -1904.9bn |
| Wed 30 | JP | Foreign Bond Investment Le | 1082.9bn | - | -684.5bn |
| Date | Release | Prior | Cons. |
|---|---|---|---|
| 2026-10-05 | Consumer Confidence Index | 35.5 | 35.3 |
| 2026-10-06 | BoJ Gov Ueda Speech | - | - |
| 2026-10-07 | Current Account Balance | 2989.0bn | - |
| 2026-10-08 | Household Spending Month-over-Month | 0.50 | - |
| 2026-10-08 | Household Spending Year-over-Year | -3.6 | -3.5 |


Consumer Confidence Index data will open the period with a high-impact read on household sentiment that feeds directly into domestic demand assessments. Limited additional Japanese releases follow, keeping attention on any follow-up comments from Bank of Japan speakers. The prior week’s weak production and sales figures will frame expectations for whether confidence holds or softens further. Officials will likely reiterate that upcoming decisions remain tied to evidence of 2% inflation being durably achieved. Any sustained yen weakness could prompt renewed coordination language with US counterparts. Markets will parse the data flow for signs that the recent activity shortfall alters the balance of risks around coming quarters. The unemployment print sets a steady baseline against which any labour-market softening would register clearly.
The pronounced misses in industrial production and retail sales shift the near-term growth outlook lower and raise the threshold for consecutive policy adjustments. Upside risks centre on the Tankan’s resilience and multi-year high service inflation sustaining the case for normalisation. Downside scenarios would materialise if further activity weakness feeds into lower corporate sentiment or delays the reflation end-state described by officials. Fiscal credibility concerns highlighted in commentary add a separate layer, as rising long-term rates could complicate debt dynamics if yields continue to climb. The data configuration suggests markets may be underweighting the persistence of domestic demand softness relative to external yen and coordination factors.
| Asset | Level | WoW |
|---|---|---|
| S&P/TSX | 35502.7 | +0.0% |
| USD/CAD | 1.42 | +0.6% |
| EUR/CAD | 1.6 | -0.4% |
| WTI Crude | 91.11 | -1.6% |
| Natural Gas | 3.04 | +1.2% |
| Gold | 4162.3 | -0.1% |
| Brent Crude | 102.25 | -2.9% |
| Bitcoin | 85430.02 | +1.1% |


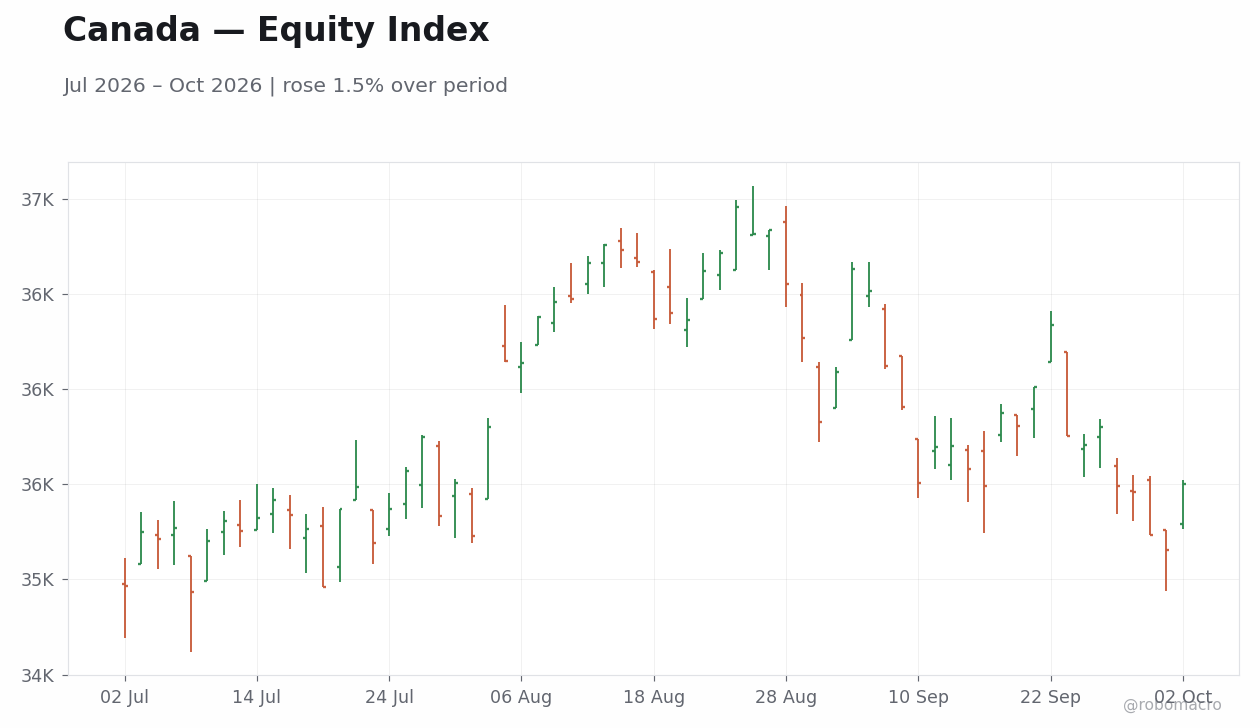
Equity and Currency Moves The S&P/TSX closed the week at 35502.7, up 0.04% week-over-week. USD/CAD finished at 1.42, up 0.64% over the five days as the Canadian dollar lagged broader USD strength.
Commodity and Yield Backdrop WTI crude ended at 91.11, down 1.61% week-over-week. Energy price movements provided mixed support to energy-linked names while external USD strength added pressure on CAD crosses.
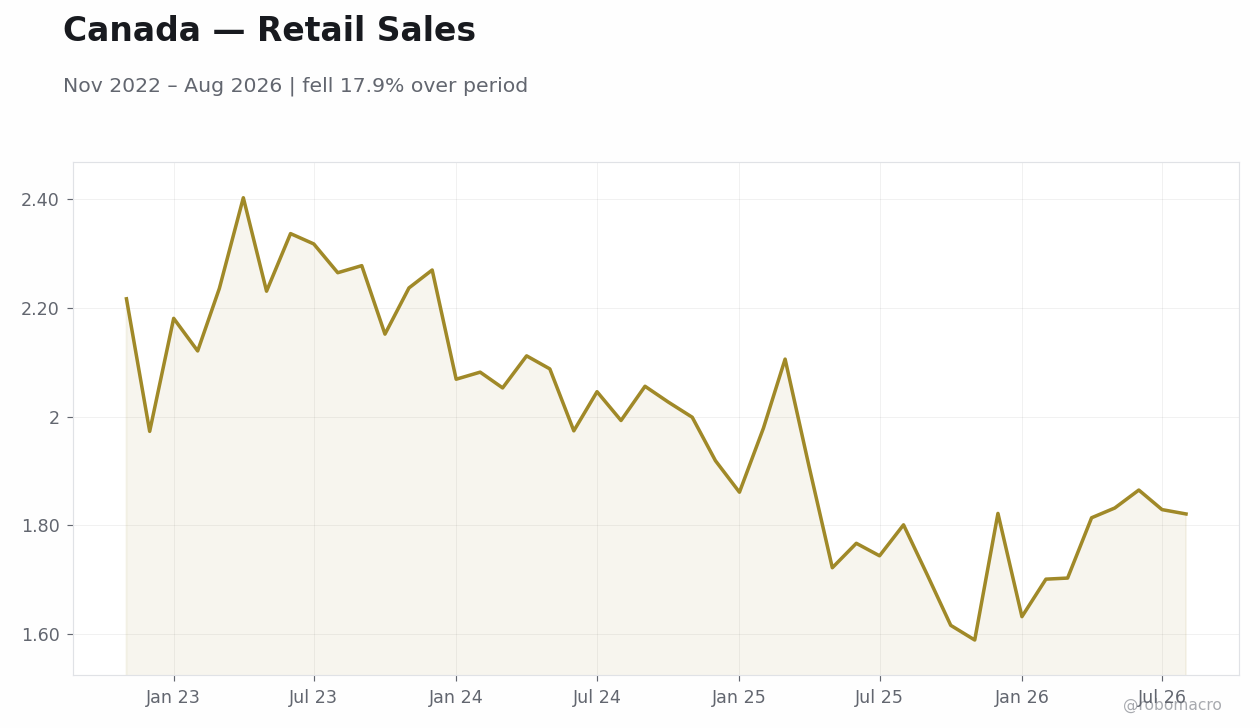
Broader Context Tariff risks and rising debt arrears added downside pressure to household spending forecasts. The week's arc showed resilience in equity closes alongside the moderation in growth momentum.
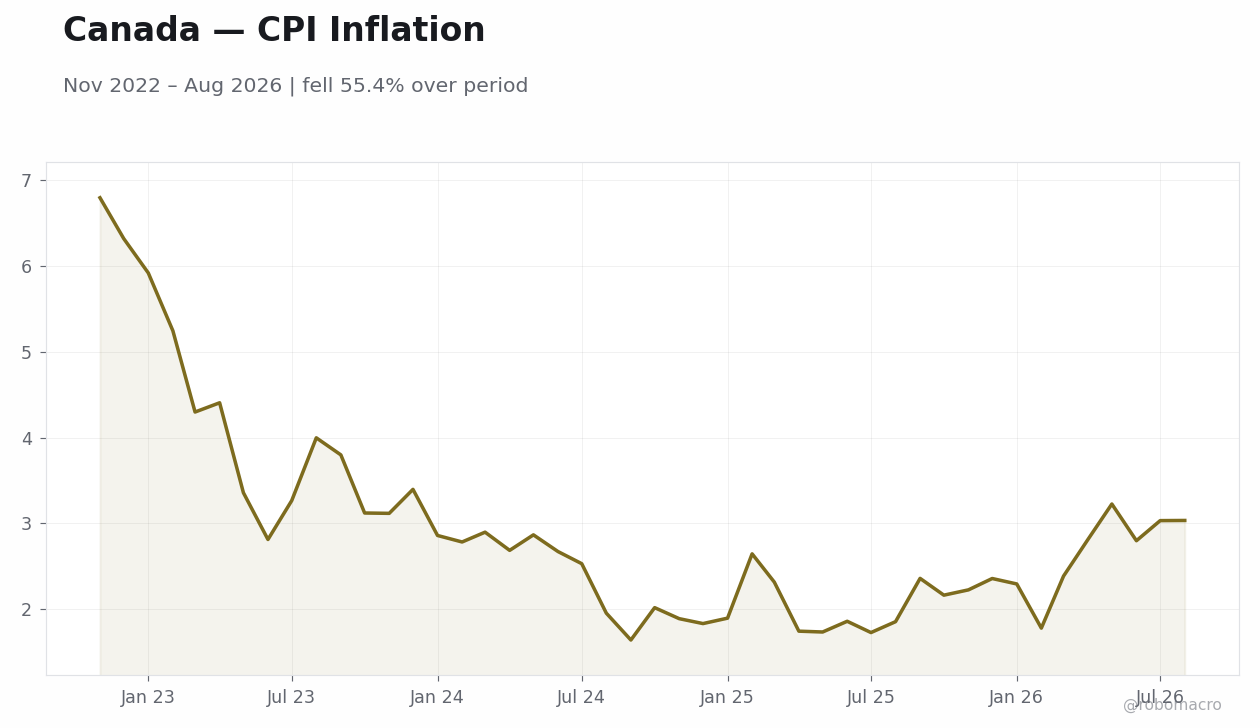
Incoming prints on activity and prices supplied fresh evidence of moderating expansion that aligns with the data-dependent approach. Officials have not altered communications on the rate path since the prior decision, leaving incoming prints on activity and prices as the primary inputs. The subsequent inflation reading reinforced the case for monitoring growth momentum ahead of upcoming decisions without immediate recalibration. Debt arrears data reaching post-2015 highs added a separate signal on household balance-sheet risks that could influence future assessments.
| Date | Ctry | Event | Prior | Cons. | Actual |
|---|---|---|---|---|---|
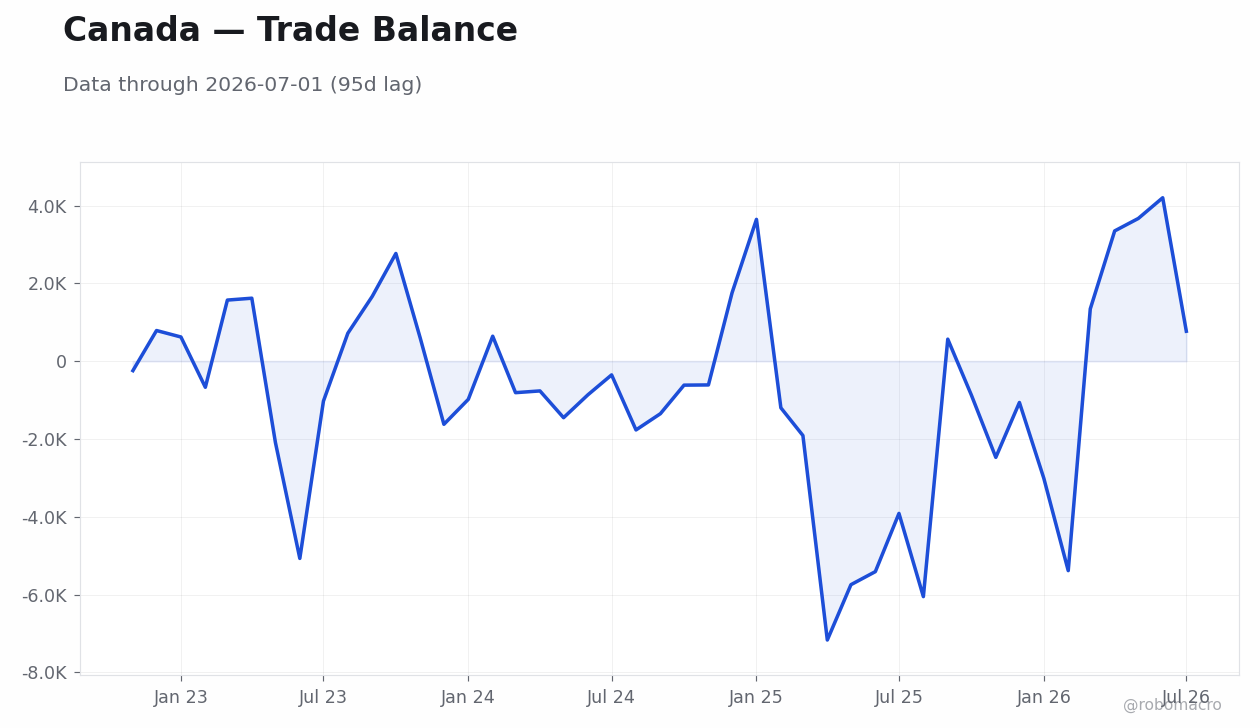
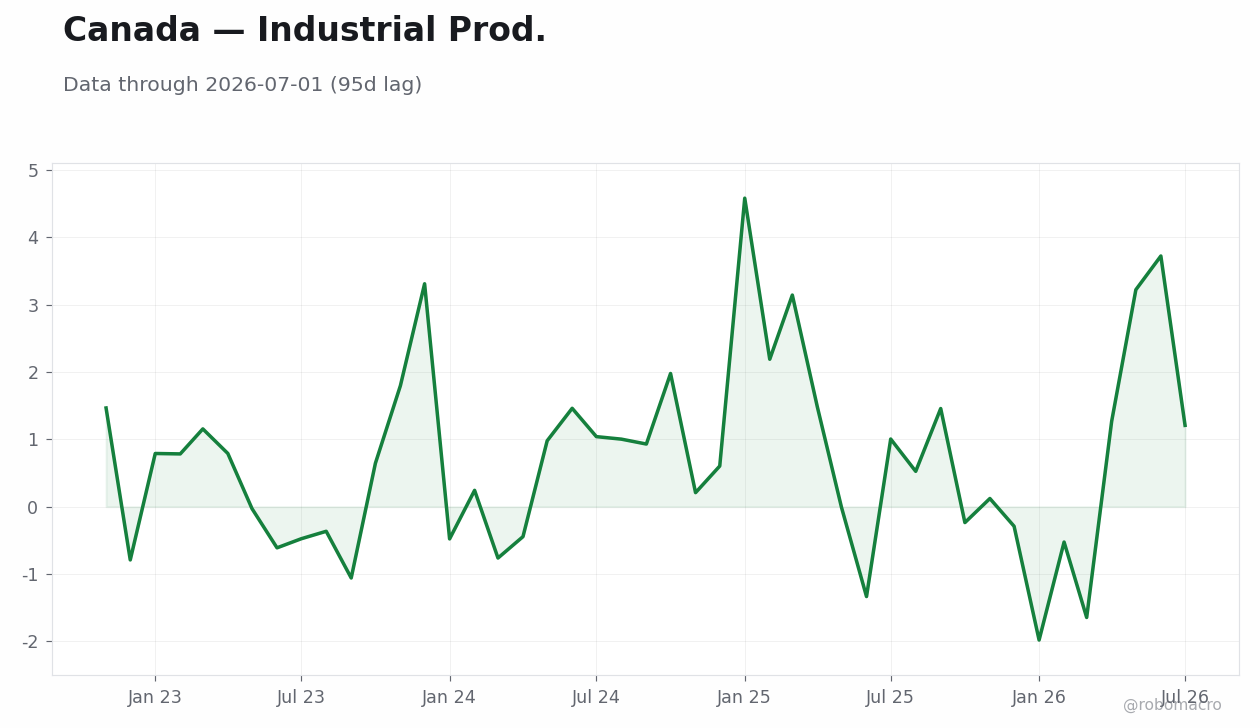
| Tue 29 | CA | GDP Month-over-Month | 0.40 | 0 | 0 |
| Tue 29 | CA | GDP Month-over-Month Prel | 0 | - | 0.20 |
| Thu 1 | CA | S&P Global Manufacturing P | 53.0 | - | 51.5 |
| Date | Release | Prior | Cons. |
|---|---|---|---|
| 2026-10-06 | Trade Balance | 770.0mn | 1.3bn |
| 2026-10-06 | Ivey PMI Seasonally Adjusted | 64.3 | 65.2 |
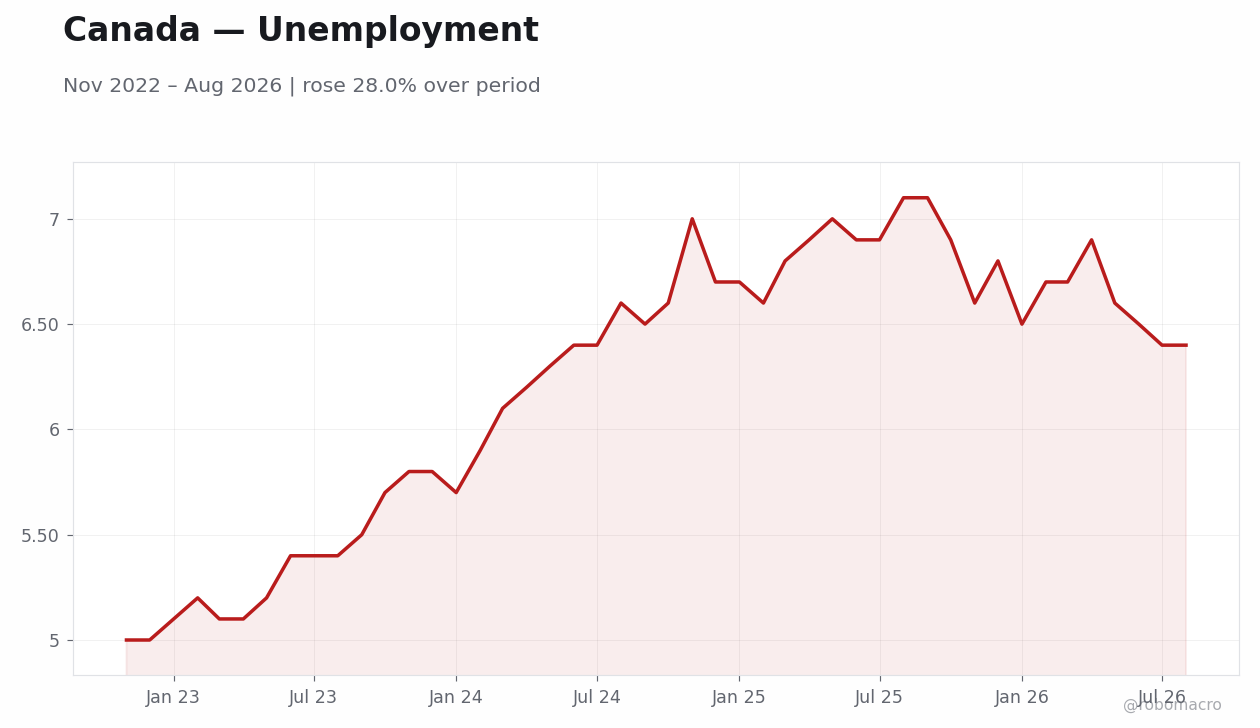
| 2026-10-09 | Headline Unemployment Rate | 6.4 | 6.5 |
| 2026-10-09 | Employment Change | -42K | 9500 |
| 2026-10-09 | Full-Time Employment Change | -36K | - |
| 2026-10-09 | Labor Force Participation | 65.0 | - |
| 2026-10-09 | Part-Time Employment Change | -5800 | - |


Canada jobs data is scheduled early in the period and will provide the first labor-market update since the most recent GDP reading. Consensus expectations center on modest employment gains that could clarify whether recent activity readings mark a temporary pause or sustained slowdown. The release carries direct implications for the Bank of Canada's assessment of domestic demand ahead of the next policy meeting. Manufacturing and services PMI prints later in the week will test whether expansion remains above the 50 threshold. Energy price volatility, with WTI at 91.11, will continue to influence inflation components and CAD crosses. Any downside surprise in employment could reinforce downside risks to growth forecasts for coming quarters. Market participants will also track tariff implementation effects on trade-sensitive sectors for signals on external demand resilience.
The recent growth readings shift the outlook toward greater data dependence, with downside scenarios centered on tariff drag and slower immigration weighing on activity. Upside risks hinge on energy price rebounds supporting CPI and prompting earlier policy adjustments. The market appears to underweight the persistence of cooling momentum shown in recent prints, particularly if debt arrears continue rising. External USD strength at USD/CAD 1.42 adds an additional transmission channel that could amplify imported price pressures without altering the Bank of Canada's domestic focus.
| Asset | Level | WoW |
|---|---|---|
| IPC Bolsa | 64531.68 | -0.6% |
| USD/MXN | 18.15 | +2.2% |
| EUR/MXN | 20.43 | +1.2% |
| WTI Crude | 91.11 | -1.6% |
| Silver | 60.42 | -1.3% |
| Gold | 4162.3 | -0.1% |
| Brent Crude | 102.25 | -2.9% |
| Bitcoin | 85452.99 | +1.2% |


Trade balance signals external softening Mexico recorded a narrower trade surplus than expected. The print coincided with USD/MXN advancing from lower levels to 18.15 by week-end.
Equity and yield divergence persists The IPC Bolsa posted a net decline despite intraday gains late in the period. The Mexico 10-year government yield rose, steepening the curve relative to the unchanged policy rate.
Hurricane Polo and nearshoring backdrop Hurricane Polo made landfall with limited financial-market disruption. Business confidence held broadly steady.
Peso depreciation outpaces regional peers USD/MXN’s weekly gain exceeded moves in USD/PEN and USD/COP, underscoring Mexico-specific sensitivity to external dollar strength. WTI crude closed at 91.11 after a 1.61 percent weekly decline.
Data dependence reinforced The absence of fresh Banxico guidance left markets reliant on the trade outcome and steady business confidence to assess growth momentum ahead of the next policy meeting. The week’s data showed external demand signals weakening without yet altering domestic inflation or activity prints.
Banco de Mexico maintained its policy rate with no speeches, minutes, or forward-guidance updates during the week. Recent inflation data remained the last official reference, keeping the target within reach but offering no new signal on the pace of any future adjustments. The narrower trade surplus and flat business confidence supplied no immediate impetus for recalibration. Officials have continued to tie decisions to incoming data on external demand and price pressures rather than any single release. The configuration leaves the rate path dependent on subsequent inflation and activity prints before the next meeting.
| Date | Ctry | Event | Prior | Cons. | Actual |
|---|---|---|---|---|---|
| Mon 28 | MX | Trade Balance | -848.0mn | 1.4bn | 605.0mn |
| Thu 1 | MX | Business Confidence Index | 48.1 | - | 48.0 |
| Thu 1 | MX | S&P Global Manufacturing P | 49.8 | - | 50.3 |
| Thu 1 | MX | Fiscal Balance | -731.7bn | - | - |
| Date | Release | Prior | Cons. |
|---|---|---|---|
| 2026-10-06 | Consumer Confidence Index | 46.1 | - |
| 2026-10-08 | Inflation Rate Month-over-Month | 0.20 | - |
| 2026-10-08 | Inflation Rate Year-over-Year | 3.3 | - |


No high-impact Mexican data releases are scheduled for the week of October 5–9. Markets will monitor any Banco de Mexico member remarks that could clarify the reaction function ahead of upcoming decisions. Global PMI prints from major trading partners may influence peso flows through external demand channels. Oil-price volatility will remain relevant given Mexico’s fiscal exposure to energy exports. Nearshoring investment announcements under the USMCA framework could surface as the primary domestic catalyst. The calendar leaves the rate outlook anchored to recent trade and inflation references until fresh prints arrive.
The trade-balance outcome highlights downside risk to external demand that could weigh on growth forecasts if sustained. Persistent USD/MXN strength risks amplifying imported inflation. Hurricane-related supply-chain effects remain a low-probability tail risk after limited market reaction. On the upside, continued nearshoring inflows could offset weaker goods trade and support industrial production. The rise in the 10-year yield signals term-premium pressure that may constrain fiscal flexibility if it persists. Markets appear to underweight the cumulative peso depreciation relative to the steady policy-rate signal from Banco de Mexico.
| Asset | Level | WoW |
|---|---|---|
| Bovespa | 192115.0 | +5.0% |
| USD/BRL | 5.22 | +0.7% |
| EUR/BRL | 5.87 | -0.4% |
| Vale | 13.76 | +1.2% |
| Petrobras | 21.65 | +4.8% |
| WTI Crude | 91.11 | -1.6% |
| Gold | 4162.3 | -0.1% |
| Bitcoin | 85453.0 | +1.2% |


Labor Market Strength Anchors Sentiment Brazil’s headline unemployment rate printed unchanged at a record low, matching consensus and the prior reading. Job creation data released alongside the print beat forecasts, reinforcing consumer resilience ahead of the October 4 presidential vote. The BRL posted a weekly gain that extended through October 1 and closed the week at 5.22.
Industrial Output Disappointment Emerges Late Industrial production month-over-month contracted in the August reading released October 2, missing consensus and reversing the prior gain. The surprise contraction arrived after three consecutive days of equity gains and yield compression, tempering the week’s earlier optimism.
Equity and Yield Compression Reflect Data Sequencing The Bovespa closed at 192,115 for a 4.99 percent weekly advance. Brazil’s 10-year government yield eased while the 5-year yield declined. Petrobras rose and Vale gained over the same period, consistent with WTI crude’s net weekly move.
Election and Fiscal Context Overlay Price Action Campaign developments between incumbent Luiz Inácio Lula da Silva and Flávio Bolsonaro shaped positioning, with fiscal-outlook concerns cited in market commentary as unresolved. The data sequence—steady labor followed by softer output—left the growth picture balanced rather than decisively stronger or weaker.
Commodity and External Flows Provide Secondary Support WTI crude’s weekly close finished 1.61 percent lower. Broader EM currency moves remained contained, allowing the BRL’s response to domestic prints to dominate price action.
The Banco Central do Brasil held the policy rate unchanged with no officials speaking publicly during the week. The record-low unemployment print reinforced the case for steady policy by confirming labor-market resilience without adding immediate wage-pressure signals. The subsequent industrial production outcome introduced a counterbalancing soft patch in manufacturing that will feed into the next decision’s growth assessment. Officials’ prior communications have emphasized data dependence, and the week’s releases supplied exactly the divergent inputs that keep forward guidance anchored to incoming prints rather than any shift in rhetoric. The configuration leaves the rate path dependent on whether subsequent activity and inflation releases sustain the labor-market strength or confirm the manufacturing slowdown.
| Date | Ctry | Event | Prior | Cons. | Actual |
|---|---|---|---|---|---|
| Mon 28 | BR | Current Account Balance | -9.4bn | -4.9bn | -5.1bn |
| Mon 28 | BR | Foreign Direct Investment | 7.0bn | 6.9bn | 7.4bn |
| Mon 28 | BR | BCB Focus Market Readout | - | - | "" |
| Tue 29 | BR | IGP-M Inflation Month-over | -0.22 | 1.6 | 1.6 |
| Tue 29 | BR | Bank Lending Month-over-Mo | 0.30 | - | 0.50 |
| Tue 29 | BR | Headline Unemployment Rate | 5.3 | 5.3 | 5.3 |
| Tue 29 | BR | Net Payrolls | 59K | 96K | 166K |
| Wed 30 | BR | Gross Debt to GDP | 82.5 | 83.1 | 82.9 |
| Wed 30 | BR | Nominal Budget Balance | -97.6bn | -109.4bn | -116.0bn |
| Wed 30 | BR | Producer Price Index Month | -0.83 | - | 0.36 |
| Wed 30 | BR | Producer Price Index Year- | 1.9 | - | 2.5 |
| Thu 1 | BR | S&P Global Manufacturing P | 46.3 | - | 44.8 |
| Fri 2 | BR | IPC-Fipe Inflation Month-o | 0.01 | - | 0.51 |
| Fri 2 | BR | Industrial Production Mont | 0.20 | 0.10 | -0.60 |
| Date | Release | Prior | Cons. |
|---|---|---|---|
| 2026-10-05 | S&P Global Services PMI | 50.5 | - |
| 2026-10-06 | Trade Balance | 7.4bn | - |
| 2026-10-09 | Inflation Rate Month-over-Month | -0.32 | - |
| 2026-10-09 | Inflation Rate Year-over-Year | 4.2 | - |


Attention centers on the first full week after the October 4 presidential vote, with no high-impact Brazilian data releases scheduled through October 9. Global PMI prints from major trading partners will provide indirect signals on external demand relevant to Brazil’s export sector and inflation trajectory. Any post-election fiscal commentary will be monitored for implications on the medium-term fiscal path that the Banco Central do Brasil has flagged as a risk to inflation expectations. Commodity price developments, particularly iron ore and crude, will continue to influence trade-balance and fiscal-subsidy calculations ahead of the next policy meeting. Broader emerging-market flows may transmit external yield signals that affect BRL volatility even in the absence of domestic releases. The data-dependent stance at the Banco Central do Brasil means these indirect inputs will shape expectations for upcoming decisions until the next round of local activity and price prints arrives in the following weeks.
The industrial production contraction raises the possibility that the growth impulse visible in labor data may prove narrower than initially assumed, tilting the balance toward downside risks for coming quarters if the weakness persists. Fiscal uncertainty ahead of the election outcome continues to overhang duration markets, with any post-vote policy announcements capable of shifting yield curves independently of the Banco Central do Brasil’s actions. Commodity price volatility remains a two-sided risk: further energy gains could ease imported inflation pressures while iron-ore weakness would pressure export revenues and related equities. The week’s sequencing—strong labor followed by soft output—suggests markets may be under-weighting the potential for divergent data to keep policy expectations fluid rather than anchored to any single narrative.
| Asset | Level | WoW |
|---|---|---|
| MERVAL | 2767663.0 | -1.1% |
| USD/ARS | 1524.25 | -0.5% |
| EUR/ARS | 1715.2 | -1.5% |
| Gold | 4162.3 | -0.1% |
| Brent Crude | 102.25 | -2.9% |
| Soybean | 1278.25 | -0.8% |
| Bitcoin | 85452.99 | +1.2% |


Quiet data calendar shapes sentiment. Markets operated without any Argentina-specific economic releases from September 28 through October 2, directing attention to the prior BCRA growth downgrade and the H1 poverty increase. Equity price action reflected this information vacuum, with the MERVAL index posting daily swings exceeding 3 percent.
Equity volatility without FX pressure. The index closed the full week lower, while USD/ARS moved only modestly lower and EUR/ARS declined. Commodity price swings provided the main external input, as Brent crude fell and soybeans eased, both relevant for export revenue and reserve accumulation under the IMF programme.
Political signals add noise. Bilateral and capital-flow considerations emerged without altering domestic data flow. The Revolut acquisition approval for Banco Cetelem Argentina stood as the sole regulatory development. Overall, the week confirmed a data-dependent equilibrium in which the absence of prints left fiscal consolidation progress and soybean export volumes as the dominant domestic anchors.
Inflation benchmark unchanged. The August CPI YoY reading continued to frame real-rate calculations, with Argentina 10-year yields attracting buyers despite the election-risk backdrop.
The Central Bank of Argentina supplied no new policy rate decision, minutes, or speaker commentary during the week. Its earlier downward revision to growth forecasts now sits alongside the H1 poverty rate and the August CPI YoY benchmark as the operative inputs for the rate path. Officials have offered no fresh forward guidance, so the restrictive stance implied by double-digit real rates remains the default setting ahead of the next meeting. The data flow supplies no basis for an imminent shift, as the lack of activity or inflation prints leaves the prior cautious outlook intact. External reserve accumulation via soybean exports and IMF programme compliance therefore continue to anchor expectations more than any domestic release.
| Date | Ctry | Event | Prior | Cons. | Actual |
|---|---|---|---|---|---|
| Tue 29 | AR | Current Account Balance | -1.7bn | - | 2.2bn |
| Thu 1 | AR | Tax Revenue | 20508.0bn | - | 21359.0bn |

The October 5–9 calendar contains no scheduled Argentina data releases or BCRA events, extending the pattern observed through the prior week. Attention will therefore remain on any unscheduled statements regarding liquidity management or reserve targets. Fiscal cash-flow updates and soybean export registration volumes will serve as the primary domestic indicators of IMF programme compliance. Global commodity price moves, particularly Brent crude and soybeans, will continue to influence peso liquidity conditions and reserve rebuilding. These factors will shape positioning ahead of the next Central Bank of Argentina decision without altering the current data-dependent stance.
The week’s empty calendar amplified sensitivity to political signals, introducing potential volatility in capital flows and energy-sector sentiment. Persistent CPI YoY leaves limited room for any policy easing even if growth forecasts continue to be revised lower. Commodity price weakness could pressure export revenues and reserve accumulation if the trend extends into coming quarters. Equity market swings of more than 3 percent on individual days highlight thin liquidity conditions that could transmit external shocks rapidly. The stable USD/ARS outcome suggests markets are not yet pricing acute FX stress, yet any slippage in fiscal consolidation or soybean inflows would quickly test that resilience.
| Asset | Level | WoW |
|---|---|---|
| MSCI Chile | 37.1 | -3.2% |
| MSCI Peru | 89.56 | +0.1% |
| USD/COP | 3263.3 | -1.2% |
| USD/CLP | 989.6 | +3.0% |
| USD/PEN | 3.43 | +4.3% |
| Copper | 6.55 | -0.3% |
| Gold | 4162.3 | -0.1% |
| Brent Crude | 102.25 | -2.9% |
| Bitcoin | 85452.99 | +1.2% |


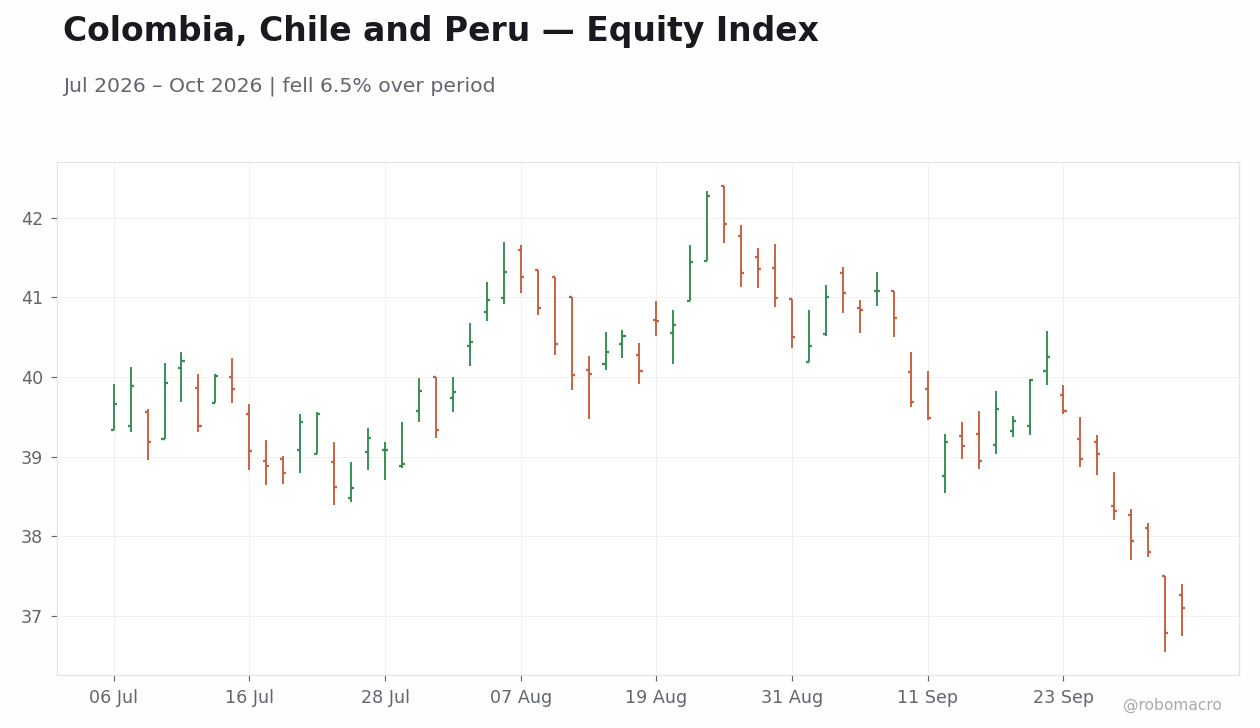
External signals shaped regional markets. No high-impact data releases or central-bank decisions emerged from Colombia, Chile or Peru, leaving commodity prices and global flows to drive price action. Equity indices reflected divergent commodity sensitivities, with MSCI Chile posting a 3.18% weekly decline to 37.1 while MSCI Peru rose 0.13% to 89.56.
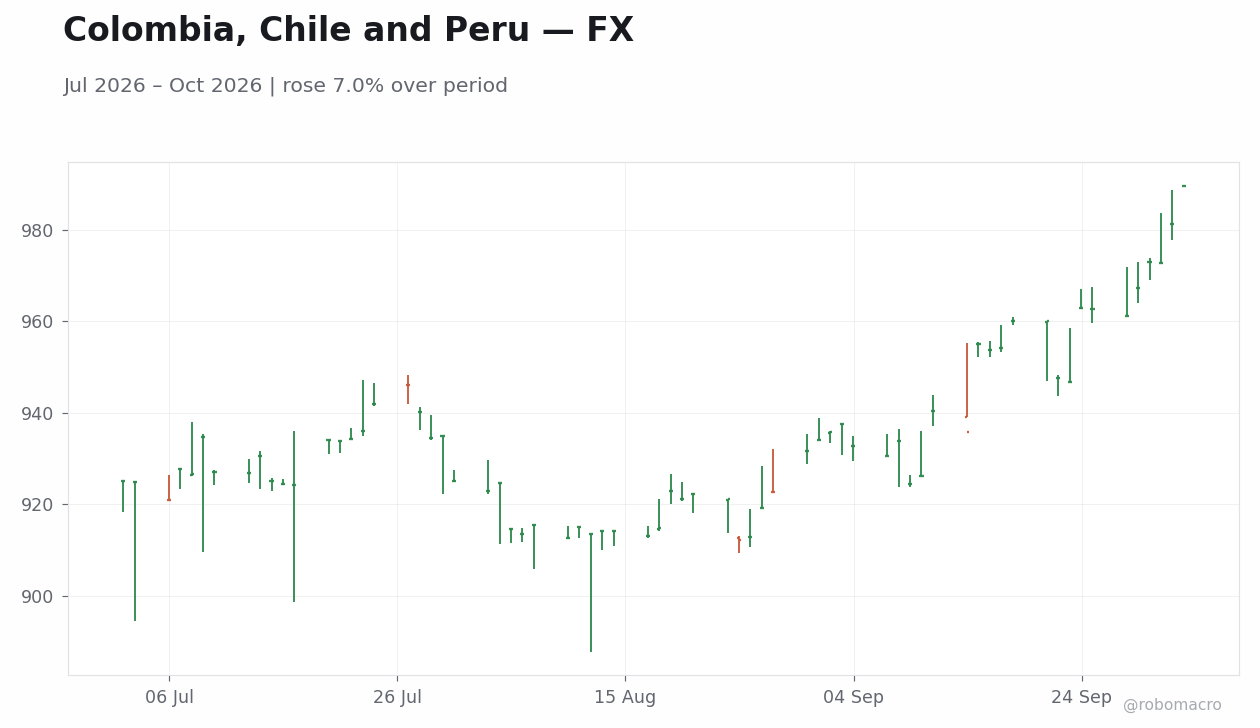
Currency moves diverged. USD/COP ended 1.2% lower at 3263.3, whereas USD/CLP advanced 2.97% to 989.6 and USD/PEN gained 4.27% to 3.43. These shifts aligned with copper holding near 6.55 and Brent crude settling at 102.25 after a 2.88% weekly drop. No sovereign yield data were available for the period.
Commodity linkages remained central. Copper’s limited 0.26% weekly decline provided modest support to Chile and Peru export revenues while Brent’s retreat added pressure to Colombia’s oil-linked fiscal accounts. The absence of activity or inflation releases kept attention fixed on external price signals.
Market positioning adjusted to commodity moves. Daily equity and FX swings tracked commodity volatility, with Chile and Peru remaining exposed to continued swings in copper and Brent. Colombia’s currency showed relative resilience against the broader dollar move.
No central-bank meetings, statements or minutes were released from BanRep, BCCh or BCRP during the week. The data flow offered no fresh inflation or activity prints. Officials at all three institutions therefore continue to anchor policy to external commodity and dollar developments rather than domestic releases.
| Date | Ctry | Event | Prior | Cons. | Actual |
|---|---|---|---|---|---|
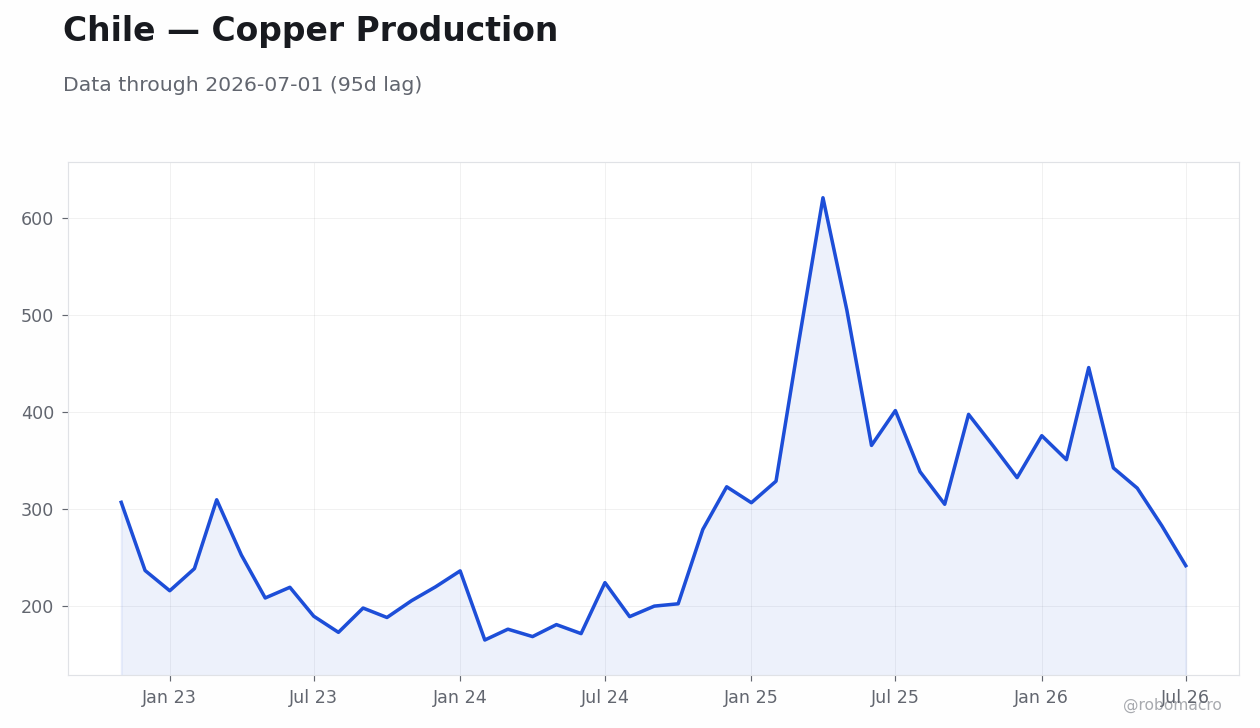
| Wed 30 | CL | Copper Production Year-ove | -9.4 | - | -12.8 |
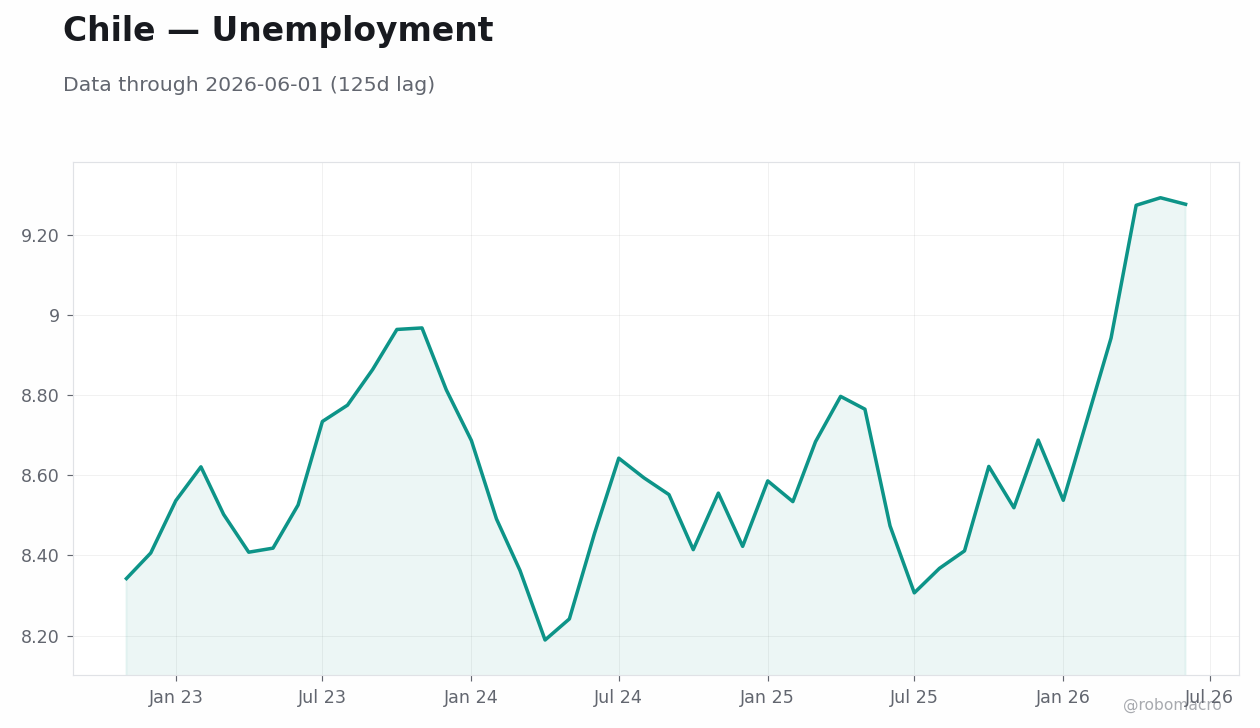
| Wed 30 | CL | Headline Unemployment Rate | 9.5 | - | 9.6 |
| Wed 30 | CL | Industrial Production Year | -5.1 | - | -5.7 |
| Wed 30 | CL | Manufacturing Production Y | -4.9 | - | -2.6 |
| Wed 30 | CL | Retail Sales Month-over-Mo | -2.9 | - | 1.2 |
| Wed 30 | CL | Retail Sales Year-over-Yea | 2.2 | - | 3.4 |
| Wed 30 | CO | Business Confidence Index | 6.1 | - | 5.8 |
| Wed 30 | CO | Headline Unemployment Rate | 8.1 | - | 9.4 |
| Wed 30 | CO | Central Bank Interest Rate | 12.0 | 12.0 | 12.2 |
| Wed 30 | CO | Cement Production Year-ove | -4.5 | - | 2.9 |
| Thu 1 | CL | IMACEC Economic Activity Y | -1.5 | - | -1.0 |
| Thu 1 | CO | Davivienda Manufacturing P | 54.3 | - | - |
| Thu 1 | PE | Inflation Rate Month-over- | 0.07 | - | 0.12 |
| Thu 1 | PE | Inflation Rate Year-over-Y | 4.4 | - | 4.5 |


No central-bank meetings or high-impact data releases are scheduled for Colombia, Chile or Peru in the coming sessions. Attention will therefore remain on external commodity prints. Copper and Brent trajectories will continue to shape fiscal and current-account assessments for all three economies.
Chile and Peru remain exposed to commodity downside while Colombia faces separate fiscal pressures from Brent weakness. Upside risks center on sustained copper strength near 6.55 supporting mining royalties and export revenues in Chile and Peru. Downside scenarios include further Brent weakness at 102.25 widening Colombia’s fiscal gap. External dollar strength continues to dominate regional currency drivers.
| Asset | Level | WoW |
|---|---|---|
| FTSE 100 | 10462.0 | -2.1% |
| FTSE 250 | 24194.2 | -0.6% |
| GBP/USD | 1.32 | +0.1% |
| GBP/EUR | 1.18 | +1.2% |
| GBP/JPY | 208.39 | +0.1% |
| Brent Crude | 102.25 | -2.9% |
| Gold | 4162.3 | -0.1% |
| UK Nat Gas | 3.04 | +1.2% |
| Bitcoin | 85452.99 | +1.2% |


Ramsden speech shifts near-term policy tone. Deputy Governor Ramsden’s late-September remarks flagged the possibility of rate increases should inflation pressures endure, directly lifting sterling and anchoring market focus on the Bank Rate. This hawkish signal contrasted with subsequent comments from Taylor, who indicated no immediate requirement for tightening. The week therefore opened with clearer differentiation among MPC voices than seen in prior periods.
Data releases reveal mixed household signals. Consumer credit expanded ahead of consensus and the prior print, while mortgage approvals slipped below expectations. Mortgage lending edged marginally above forecast. These prints together pointed to resilient borrowing capacity even as housing transaction momentum softened.
Current account improvement supports external balance. The deficit narrowed more than consensus, marking a meaningful beat that coincided with modest GBP/USD gains. Nationwide house prices posted a month-over-month decline against a flat consensus and a year-over-year reading that missed expectations. The combination reinforced a picture of cooling domestic demand without broad labour-market deterioration.
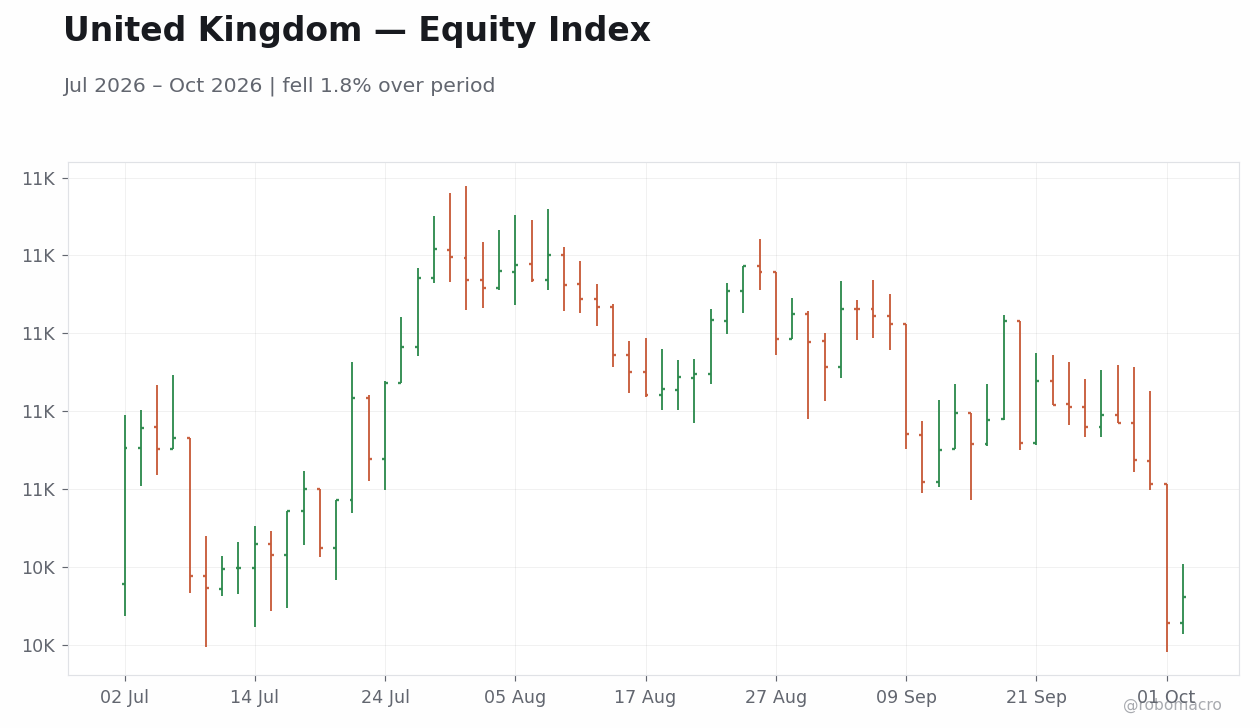
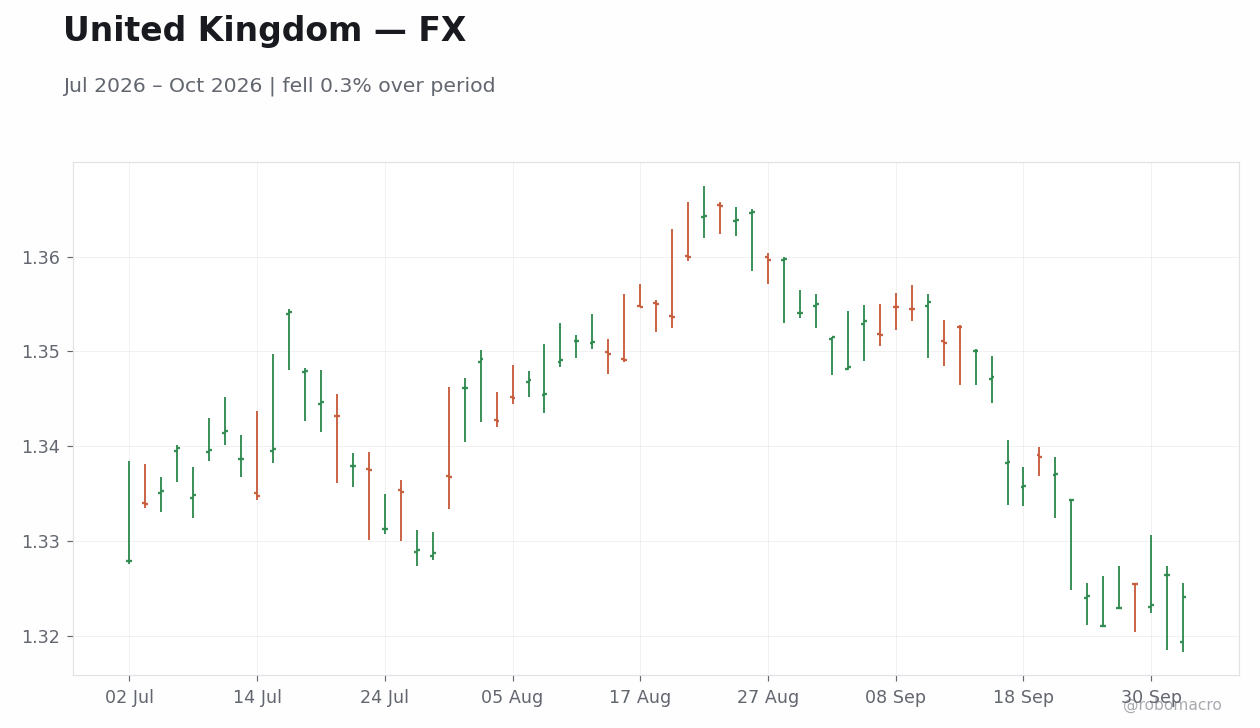
Equity and gilt markets price divergent signals. The FTSE 100 closed the week at 10462 after a 2.09% decline, while the 10-year gilt yield advanced. Brent crude’s 2.88% drop to 102.25 eased some imported inflation concerns yet failed to prevent the net equity retreat. Sterling’s weekly net change remained near flat at 1.32, reflecting the offsetting influences of policy rhetoric and data outcomes.
Deputy Governor Ramsden stated late last month that interest rates will need to rise if inflationary pressures persist, directly influencing sterling and gilt pricing. Taylor’s subsequent remarks indicated no immediate need for further tightening, producing a split tone within the committee. Mann and Mills speeches on October 1 added further commentary on inflation persistence and the energy price outlook without shifting the Bank Rate baseline.
The stronger consumer credit print and narrower current account deficit together suggest limited immediate pressure on the medium-term rate path from domestic demand weakness. Yet the mortgage approvals miss and housing price declines reinforce the data-dependent stance articulated by multiple speakers. Markets therefore continue to price policy settings around incoming releases rather than any single speech or data point.
Consumer credit printed ahead of consensus and the prior reading, delivering the clearest beat among the week’s releases and signalling sustained household access to credit. Mortgage approvals fell from the prior print and versus expectations, indicating a modest pullback in housing market activity. Mortgage lending edged higher, close to forecast and consistent with stable net flows.
The current account deficit narrowed sharply from the prior reading and against consensus, improving the external position and reducing immediate financing concerns. Nationwide housing prices declined month-over-month against a flat consensus while the year-over-year rate slowed from the prior reading and below expectations. These housing figures point to softening price momentum that could temper consumption-related inflation pressures ahead.
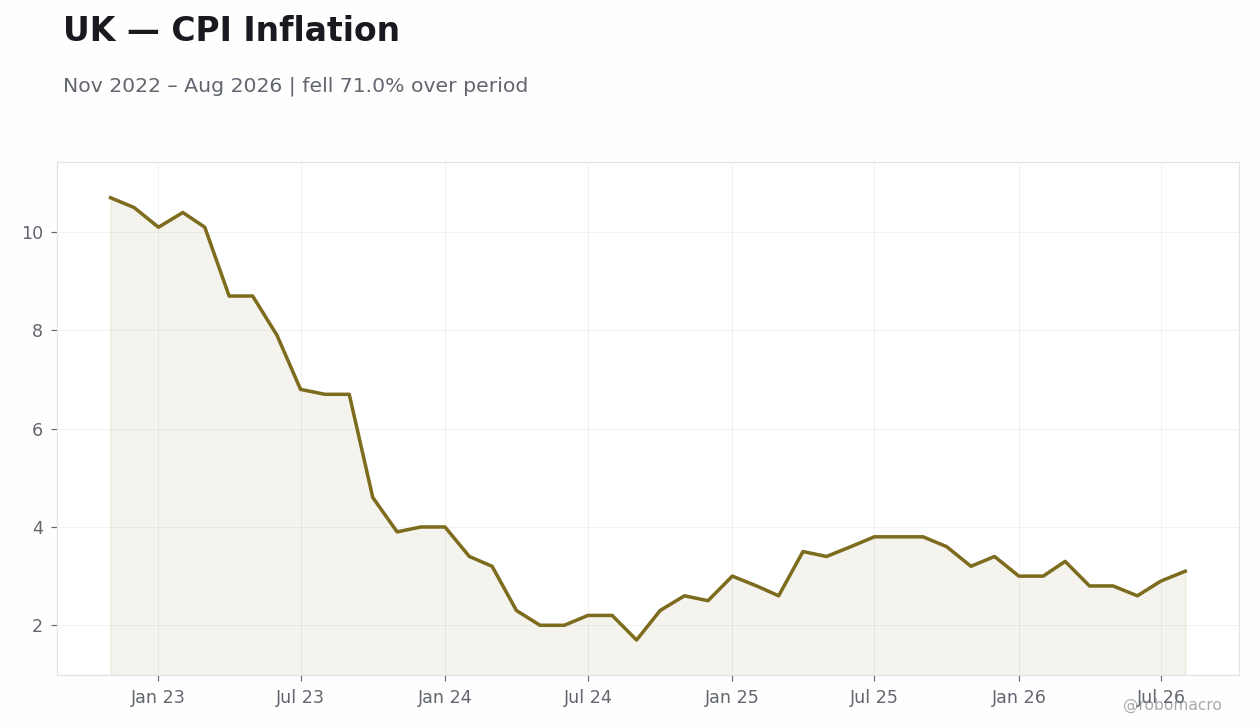
Taken together, the data releases suggest the UK economy remains in a mid-cycle phase where credit expansion coexists with softer housing indicators. The narrower current account deficit supports a constructive external balance view, yet the housing misses reinforce the case for monitoring domestic demand closely when assessing the medium-term inflation trajectory. The August CPI reading and unemployment rate continue to frame the backdrop against which these monthly prints are interpreted.
| Date | Ctry | Event | Prior | Cons. | Actual |
|---|---|---|---|---|---|
| Mon 28 | GB | BoE Ramsden Speech | - | - | - |
| Mon 28 | GB | Chancellor John Healey Spe | - | - | - |
| Mon 28 | GB | Chancellor John Healey Spe | - | - | - |
| Mon 28 | GB | BRC Shop Price Inflation | 1.5 | 1.5 | 1.4 |
| Tue 29 | GB | BoE Consumer Credit | 2.1bn | 1.9bn | 2.5bn |
| Tue 29 | GB | Mortgage Approvals | 56K | 56K | 55K |
| Tue 29 | GB | Mortgage Lending Level | 4.1bn | 4.4bn | 4.4bn |
| Tue 29 | GB | M4 Money Supply Month-over | -0.30 | 0.10 | 0.40 |
| Tue 29 | GB | Net Lending to Individuals | 6.2bn | 6.2bn | 6.9bn |
| Tue 29 | GB | Treasury Gilt 2036 Auction | 5.2 | - | 5.4 |
| Tue 29 | GB | BoE Taylor Speech | - | - | - |
| Tue 29 | GB | Car Production Year-over-Y | -10.6 | - | 6.1 |
| Wed 30 | GB | Current Account Balance | -21.1bn | -24.7bn | -19.9bn |
| Wed 30 | GB | Business Investment Quarte | 3.0 | - | 1.8 |
| Date | Release | Prior | Cons. |
|---|---|---|---|
| 2026-10-06 | S&P Global Construction PMI | 44.3 | 45.4 |
| 2026-10-07 | Lloyds House Price Index Month-over | -0.20 | 0.20 |
| 2026-10-07 | Lloyds House Price Index Year-over- | -0.40 | - |
| 2026-10-07 | RICS House Price Balance | -28.0 | -30.0 |


Monday opens with Japan consumer confidence data that may colour global risk sentiment ahead of European PMIs. Spain and Italy S&P Global services and composite PMI releases on Monday will provide early euro-area growth signals relevant to UK external demand. Russia PMI prints follow on the same day, offering additional context on energy-market dynamics.
Tuesday features further European manufacturing and services surveys that could influence sterling crosses. Wednesday brings UK-relevant euro-area inflation and retail sales figures that often spill into BoE thinking on imported price pressures. Thursday includes potential BoE speaker appearances that markets will parse for updates on the Bank Rate stance. Friday rounds out the period with any late-week data revisions or additional central-bank commentary that could alter positioning ahead of the following week’s releases.
The week’s credit beat versus housing misses creates a two-sided risk around domestic demand, with stronger borrowing potentially sustaining wage pressures while softer approvals could foreshadow consumption softening. Policy-speaker divergence raises the possibility of mispriced expectations should subsequent data surprise to the upside on inflation. Sterling’s limited net move despite Ramsden’s hawkish tone suggests markets may be underweighting near-term tightening risks.
Positioning appears balanced between equity underperformance and gilt yield rises, leaving room for volatility if energy prices reaccelerate. Upside scenarios centre on continued current-account improvement supporting GBP, while downside risks stem from any re-widening of fiscal spreads or renewed Brent advances above recent levels. Flow data indicate selective differentiation rather than broad directional conviction.
Equities closed lower with the FTSE 100 declining 2.09% to 10462 while the FTSE 250 fell 0.58% to 24194.2 over the week. Daily moves included a 1.68% drop on October 1 that marked the largest single-session decline. Gilt yields rose across the curve, with the 10-year advancing from the prior session and the 2-year fluctuating higher.
FX markets showed limited net movement, with GBP/USD ending at 1.32 after oscillating between 1.32 and 1.33. GBP/EUR gained 1.2% to 1.18 while GBP/JPY finished at 208.39. Commodities delivered mixed results as Brent crude declined 2.88% to 102.25 and gold fell 0.15% to 4162.3, with UK natural gas rising 1.17% to 3.04. The configuration reflected policy-speech volatility outweighing the energy-price relief in driving cross-asset price action.
Dollar strength observed in the prior week continued to transmit external price signals, with GBP/USD holding near 1.32 amid selective EM currency depreciation. Brent crude’s 2.88% weekly decline to 102.25 eased imported inflation risks for the UK as a net-energy importer. European PMI releases scheduled for next week will shape the growth backdrop against which UK external demand is assessed.
Geopolitical developments near Yemen added minor volatility to shipping costs, though the impact remained contained within the seven-day window. Overall, cross-border spillovers reinforced the data-dependent equilibrium at the Bank of England without altering the core domestic narrative.
| Asset | Level | WoW |
|---|---|---|
| OMX Stockholm 30 | 3260.51 | -0.6% |
| Oslo Bors | 2062.77 | -1.5% |
| OMX Copenhagen 25 | 1819.11 | -0.9% |
| OMX Helsinki 25 | 6416.21 | -1.2% |
| USD/SEK | 10.04 | +1.1% |
| USD/NOK | 9.61 | +1.0% |
| EUR/SEK | 11.3 | -0.1% |
| EUR/NOK | 10.82 | -0.1% |
| Brent Crude | 102.25 | -2.9% |
| Gold | 4162.3 | -0.1% |
| Bitcoin | 85452.99 | +1.2% |


Riksbank Policy Signals The Riksbank minutes released on 1 October revealed every governor moved hawkish, explicitly citing November rate-hike risk driven by demand and supply pressures. This stance persisted even though no fresh inflation data arrived during the week. Routine certificate sales and government-bond auctions produced no immediate market reaction beyond the Sweden 10-year yield easing on 1 October.
Currency and Equity Moves USD/SEK climbed steadily, posting a 1.1 percent weekly advance, while EUR/SEK settled after a 0.05 percent weekly decline. OMX Stockholm 30 fell 0.6 percent, Oslo Bors declined 1.51 percent with daily losses concentrated on 30 September and 1 October, OMX Copenhagen 25 posted a 0.87 percent weekly drop, and OMX Helsinki 25 ended after a 1.2 percent weekly decline.
Commodity and Fiscal Backdrop Brent crude declined 2.88 percent for the week, trimming near-term support for Norway’s fiscal revenue and prompting continued Norges Bank krone sales. USD/NOK rose 0.97 percent while Norway 10-year yields moved higher before closing the week up. Sweden’s political uncertainty intensified after coalition talks ended, adding fiscal-policy noise without altering the Riksbank’s communicated path.
Cross-Nordic Data Absence No high-impact releases occurred in Sweden, Norway, Denmark or Finland between 28 September and 2 October, leaving external drivers such as Brent and euro-area signals to dominate price action. Finland Business Confidence Index printed at 3 and Consumer Confidence Index at -4.9 on 28 September, both low-impact prints that aligned with the broader data-light week.
Riksbank minutes released on 1 October showed unanimous hawkish shifts among governors, directly flagging November rate-hike risk on the back of demand and supply pressures. The communication reinforced the bank’s earlier stance that a hike remains possible this year despite Sweden CPI YoY lagging. Norges Bank kept its policy rate unchanged with Norway CPI YoY at 3.30 percent, continuing monthly krone sales amid Brent’s weekly decline. Danmarks Nationalbank maintained its peg operations without new signals, while Bank of Finland remained aligned with ECB forward guidance. The week’s data absence left official communications as the primary input for assessing the timing of any upcoming decisions.
| Date | Ctry | Event | Prior | Cons. | Actual |
|---|---|---|---|---|---|
| Mon 28 | FI | Business Confidence Index | 6.0 | - | 3.0 |
| Mon 28 | FI | Consumer Confidence Index | -3.0 | - | -4.9 |
| Mon 28 | NO | Retail Sales Month-over-Mo | -0.70 | - | 0.60 |
| Mon 28 | SE | Trade Balance | 1.2bn | - | -11.9bn |
| Tue 29 | SE | Business Confidence Index | 107 | - | 109 |
| Tue 29 | SE | Consumer Confidence Index | 98.0 | - | 102 |
| Tue 29 | SE | Consumer Inflation Expecta | 6.8 | - | 6.3 |
| Tue 29 | SE | Economic Tendency Indicato | 105 | - | 107 |
| Tue 29 | SE | T-Bill Auction | - | - | - |
| Wed 30 | FI | GDP Year-over-Year | 1.4 | - | 2.3 |
| Wed 30 | DK | GDP Growth Quarter-over-Qu | 1.5 | 0.30 | 0.90 |
| Wed 30 | DK | GDP Growth Year-over-Year | 6.2 | 4.6 | 5.7 |
| Wed 30 | DK | Headline Unemployment Rate | 2.7 | - | 2.7 |
| Wed 30 | SE | Retail Sales Month-over-Mo | -0.20 | - | 0.80 |


Monday brings Japan Consumer Confidence Index and euro-area PMI prints that will feed into Bank of Finland’s ECB assessment. Tuesday features Spain and Italy services PMI releases whose outcomes may influence Danmarks Nationalbank’s peg-maintenance stance. Mid-week euro-area and UK data will provide indirect signals for Riksbank and Norges Bank officials ahead of their next meetings. Norway’s retail-sales and trade-balance follow-through will remain relevant for Norges Bank’s inflation and krone-sales outlook. No Nordic central-bank meetings or high-impact domestic releases are scheduled, keeping focus on external prints that shape the rate path. Markets will monitor any follow-up Riksbank commentary for confirmation of the November hike signal contained in the latest minutes. The configuration leaves all four central banks in data-dependent mode without immediate recalibration.
Sweden’s unresolved government-formation talks introduce fiscal-policy uncertainty that could affect Riksbank credibility if prolonged. Brent’s weekly drop raises downside risks for Norway’s revenue forecasts and Norges Bank’s krone-sales program. Persistent USD/SEK strength may transmit imported-price pressures that challenge the Riksbank’s inflation rebound narrative. Nordic equities posted net weekly declines across all four indices, highlighting downside scenarios if external growth signals weaken further. The data suggest the Riksbank’s hawkish minutes may be mispriced relative to the lagged CPI print, creating scope for volatility around the next decision.
| Asset | Level | WoW |
|---|---|---|
| BIST 100 | 12270.2 | -2.6% |
| iShares Poland | 43.03 | -3.6% |
| EUR/PLN | 4.38 | +0.2% |
| EUR/HUF | 368.12 | +1.0% |
| EUR/CZK | 24.39 | +0.1% |
| USD/TRY | 49.13 | +0.3% |
| Brent Crude | 102.25 | -2.9% |
| Gold | 4162.3 | -0.1% |
| Bitcoin | 85453.0 | +1.2% |


Markets reflect external drivers. Regional equity indices declined over the week. The BIST 100 fell while iShares Poland also declined. EUR/HUF rose and EUR/PLN advanced, reflecting forint underperformance. EUR/CZK gained modestly. USD/TRY climbed. Brent crude declined, providing relief to energy importers across the region.
Fiscal and policy signals remain steady. Hungary’s deputy governor reiterated that euro accession could support policy credibility, leaving MNB and BNR on hold. Poland’s draft budget assumed steady GDP growth without additional pre-election spending measures.
NBP and CBRT officials issued no new forward guidance during the week, maintaining a strictly data-dependent posture. Hungary’s deputy governor noted that a rate cut remains possible this year if euro adoption plans advance, yet offered no explicit MNB timeline. CNB and BNR communications were absent, consistent with the lack of scheduled meetings or minutes releases. We view the medium-term rate path for all five central banks as anchored to incoming prints rather than external commodity moves.
No high-impact releases emerged from the Czech Republic, Hungary, Romania or Turkey. Poland also recorded no scheduled prints. The absence of domestic data left the regional cycle assessment dependent on external factors. Energy import dependence remains a shared vulnerability, yet Brent’s weekly decline offered temporary current-account relief. Overall, the lack of new prints keeps the four EU members in a mid-cycle expansion with limited scope for near-term policy easing relative to the ECB benchmark.
| Date | Ctry | Event | Prior | Cons. | Actual |
|---|---|---|---|---|---|
| Tue 29 | HU | 3-Month Dtb Auction | 5.2 | - | 5.2 |
| Wed 30 | HU | Producer Price Index Year- | 1.0 | - | 4.8 |
| Wed 30 | HU | Trade Balance | 69.0mn | - | -481.0mn |
| Wed 30 | CZ | GDP Growth Quarter-over-Qu | 0.20 | 0.40 | 0.30 |
| Wed 30 | CZ | GDP Growth Year-over-Year | 2.2 | 1.9 | 1.8 |
| Wed 30 | PL | Inflation Rate Year-over-Y | 3.4 | 4.1 | 4.0 |
| Wed 30 | PL | Inflation Rate Month-over- | 0.30 | - | 0.70 |
| Wed 30 | CZ | M3 Money Supply Year-over- | 5.7 | - | 6.0 |
| Thu 1 | RO | Headline Unemployment Rate | 6.4 | - | 6.4 |
| Thu 1 | HU | HALPIM Manufacturing PMI | 51.3 | - | 53.2 |
| Thu 1 | PL | S&P Global Manufacturing P | 48.3 | - | 49.0 |
| Thu 1 | CZ | S&P Global Manufacturing P | 54.1 | - | 53.5 |
| Thu 1 | HU | 10-Year Bond Auction | 5.7 | - | 5.8 |
| Thu 1 | HU | 3-Year Bond Auction | 5.7 | - | 5.9 |

No high-impact releases are scheduled across Poland, Czech Republic, Hungary, Romania or Turkey for the week of 5–9 October. Attention will therefore turn to any NBP or CBRT speaker comments. Markets will also monitor follow-through from recent external-balance trends. Energy-price volatility remains the dominant external variable for the four EU members, with Brent’s recent decline offering a temporary buffer to current-account balances. Overall, the calendar leaves policy expectations data-dependent.
Forint and lira depreciation signals selective positioning pressure that could intensify if dollar strength persists. Fiscal restraint in Poland’s budget draft lowers downside growth risks but may cap near-term equity upside. Energy-import dependence across the region creates a shared sensitivity to any reversal in Brent’s weekly decline. We see limited scope for volatility compression until the next inflation prints.
BIST 100 closed the week at 12,270.2 after a 2.56% net decline. iShares Poland fell 3.65% to 43.03. EUR/PLN rose 0.24% to 4.38 while EUR/HUF advanced 1.0% to 368.12, marking the forint’s clearest weekly depreciation. EUR/CZK gained 0.1% to 24.39 and USD/TRY climbed 0.33% to 49.13. Brent crude declined 2.88% to 102.25, providing a modest tailwind for regional importers, while gold edged 0.15% lower to 4,162.3. No sovereign yield prints were recorded.
Dollar strength continued to transmit external price signals to the region, with USD/TRY rising in line with broader EM currency moves. Brent crude’s decline eased imported inflation pressure for net-energy importers without altering domestic growth trajectories. US labor-market data released on 3 October showed only modest jobs growth in September, keeping global yield differentials supportive of dollar resilience. No new trade or geopolitical developments directly affecting the five markets emerged in the last seven days.
| Asset | Level | WoW |
|---|---|---|
| JSE Top 40 | 100779.6 | -0.6% |
| USD/ZAR | 16.67 | +2.0% |
| EUR/ZAR | 18.76 | +0.9% |
| Platinum | 1700.0 | -1.2% |
| Gold | 4162.3 | -0.1% |
| Brent Crude | 102.25 | -2.9% |
| Naspers | 69551.0 | -3.2% |
| Bitcoin | 85461.99 | +1.2% |


Trade balance resilience amid external pressure South Africa’s trade balance delivered a modest positive surprise that briefly steadied USD/ZAR near mid-week. The print arrived against a 2.04 percent weekly advance in USD/ZAR to 16.67, underscoring that external dollar strength outweighed the local data beat.
Equity and yield repricing after the SARB hike The JSE Top 40 closed the week at 100,779.6, down 0.55 percent from the prior Friday. These moves extended the post-hike adjustment. Platinum declined 1.23 percent while Brent crude fell 2.88 percent, illustrating divergent commodity effects on local asset prices.
Limited domestic catalysts and rand volatility No high-impact data releases occurred on September 28 or 29, leaving markets to digest the SARB’s recent tightening and Governor Kganyago’s comments on rate prospects. USD/ZAR traded in a narrow range before the Friday close at 16.67, while EUR/ZAR ended at 18.76 after a 0.9 percent weekly increase. Foreign direct investment inflows reached a high level in Q2, though the figure was driven largely by a single telecom-sector transaction.
Broader sentiment and structural backdrop Reports of stagnant wages and higher living costs weighed on household sentiment without producing immediate market moves. The week’s price action therefore reflected continued absorption of the SARB’s hawkish signal rather than fresh domestic surprises.
The South African Reserve Bank left its policy rate unchanged this week following the prior tightening decision that reinforced the 3 percent inflation target. Governor Kganyago delivered positive remarks on interest-rate prospects, noting the durability of the inflation anchor amid external pressures. No MPC minutes or additional speeches were released, leaving the forward guidance from the last decision as the operative signal. The August trade surplus beat offered no immediate read-through for the inflation trajectory, while the modest rise in long-term yields aligned with the post-hike repricing already under way. Data dependence therefore remains the dominant stance ahead of the next meeting, with officials continuing to emphasize the 3 percent target over short-term commodity or currency fluctuations.
| Date | Ctry | Event | Prior | Cons. | Actual |
|---|---|---|---|---|---|
| Mon 28 | ZA | 182-Day T-Bill Auction | 7.7 | - | 7.8 |
| Mon 28 | ZA | 273-Day T-Bill Auction | 7.9 | - | 8.0 |
| Mon 28 | ZA | 364-Day T-Bill Auction | 8.0 | - | 8.1 |
| Mon 28 | ZA | 91-Day T-Bill Auction | 7.0 | - | 7.0 |
| Tue 29 | ZA | 2038 Bond Auction | 8.9 | - | 9.2 |
| Tue 29 | ZA | 2039 Bond Auction | 9.0 | - | 9.3 |
| Tue 29 | ZA | 2042 Bond Auction | 9.2 | - | 9.5 |
| Wed 30 | ZA | M3 Money Supply Year-over- | 8.6 | - | 8.9 |
| Wed 30 | ZA | Private Sector Credit Year | 7.4 | - | 7.5 |
| Wed 30 | ZA | Producer Price Index Month | -1.0 | - | -0.40 |
| Wed 30 | ZA | Producer Price Index Year- | 5.7 | - | 5.0 |
| Wed 30 | ZA | Trade Balance | 20.1bn | - | 20.5bn |
| Wed 30 | ZA | Government Budget Balance | -161.6bn | - | 19.9bn |
| Thu 1 | ZA | ABSA Manufacturing PMI | 45.8 | - | 50.7 |


No high-impact South African data releases are scheduled for the opening days of the coming week. Attention will therefore turn to global commodity prices and any follow-through from the recent trade print that could influence rand flows. The absence of domestic indicators leaves the SARB’s prior guidance as the primary domestic anchor for rate-path expectations. Markets will monitor any updates on mining output or energy supply that could affect industrial production readings later in the quarter. Broader external developments, including commodity and dollar moves, are likely to set the tone for USD/ZAR positioning ahead of the next SARB decision. The data dependence signaled by officials suggests that upcoming inflation and activity prints will be assessed for their implications on the 3 percent target rather than for immediate policy shifts.
The trade surplus beat reduced near-term downside risks to the current account but did not offset the broader USD strength that lifted USD/ZAR 2.04 percent on the week. Upside scenarios hinge on sustained commodity support for platinum and gold that could ease terms-of-trade pressure, while downside risks center on renewed load-shedding or fiscal slippage that could widen yield spreads further. The market appears to be pricing continued data dependence from the SARB without immediate recalibration, consistent with the hawkish signal delivered at the last decision. Any material deviation in the next inflation or growth prints could therefore shift the balance between the 3 percent target and external volatility.
| Asset | Level | WoW |
|---|---|---|
| ASX 200 | 8682.1 | +0.0% |
| NZX 50 | 13680.49 | -1.1% |
| AUD/USD | 0.7 | -0.7% |
| NZD/USD | 0.56 | -0.5% |
| AUD/NZD | 1.24 | -0.4% |
| BHP | 61.21 | +2.4% |
| Gold | 4162.3 | -0.1% |
| Brent Crude | 102.25 | -2.9% |
| Bitcoin | 85461.99 | +1.2% |


Equity and currency moves remain contained. The ASX 200 closed the week at 8682.1. The NZX 50 finished at 13680.49. AUD/USD ended at 0.70 after a 0.73 percent weekly decline, while AUD/NZD finished at 1.24. BHP closed at 61.21 after a 2.36 percent weekly gain. Brent crude finished at 102.25.
Policy signal points to a potential pause. No RBA or RBNZ decisions occurred during the week.
No RBA or RBNZ decisions or speeches occurred during the week. The data flow leaves both central banks in a holding pattern ahead of their next meetings, with incoming inflation and activity prints serving as the primary inputs for any future adjustments.
| Date | Ctry | Event | Prior | Cons. | Actual |
|---|---|---|---|---|---|
| Mon 28 | AU | Household Spending Month-o | 1.1 | - | 0 |
| Mon 28 | AU | Household Spending Year-ov | 7.0 | - | 6.8 |
| Mon 28 | NZ | 1-Year Bill Auction | 3.6 | - | 3.7 |
| Mon 28 | NZ | 3-Month Treasury Bill Auct | 2.9 | - | 3.1 |
| Mon 28 | NZ | 6-Month Treasury Bill Auct | 3.1 | - | 3.2 |
| Tue 29 | AU | RBA Interest Rate Decision | 4.3 | 4.6 | 4.6 |
| Tue 29 | AU | RBA Press Conference | - | - | - |
| Tue 29 | NZ | ANZ Business Confidence | 53.7 | - | 51.9 |
| Tue 29 | AU | Building Permits Month-ove | -1.9 | -2.0 | -6.1 |
| Tue 29 | AU | Inflation Rate Month-over- | 1.0 | 0.50 | 0.40 |
| Tue 29 | AU | Inflation Rate Year-over-Y | 3.5 | 4.1 | 4.0 |
| Tue 29 | AU | RBA Trimmed Mean CPI Month | 0.50 | 0.30 | 0.20 |
| Tue 29 | AU | RBA Trimmed Mean CPI Year- | 3.6 | 3.6 | 3.6 |
| Tue 29 | AU | Building Permits Year-over | 10.9 | - | 10.3 |
| Date | Release | Prior | Cons. |
|---|---|---|---|
| 2026-10-05 | Westpac Consumer Confidence Change | -5.2 | - |
| 2026-10-05 | Westpac Consumer Confidence Index | 84.4 | - |
| 2026-10-06 | Ai Group Industry Index | -3.5 | - |


Monday brings Japan consumer confidence and several European PMI releases that will set the tone for global risk sentiment and commodity demand. Tuesday features additional services and composite PMI prints across Europe that could influence AUD and NZD through risk channels. Wednesday includes UK and US data that may affect broader yield differentials. Thursday offers further labor-market and inflation indicators that will feed directly into assessments of external demand for Australian exports. Friday closes the week with potential China trade and activity figures that matter for commodity revenue and the RBA’s inflation outlook. The releases will help gauge whether recent policy settings have sufficiently addressed price pressures or whether additional tightening remains necessary at upcoming decisions. Markets will watch for any signs that softer domestic data could alter the pace of policy normalization in coming quarters.
Persistent US dollar strength observed in prior weeks continues to weigh on AUD and NZD. Energy-price volatility remains a two-sided risk, with Brent’s weekly move capable of shifting near-term inflation trajectories for both economies. Equity resilience in the ASX 200 suggests markets may be underpricing the cumulative impact of higher borrowing costs on household spending and housing turnover. A sustained decline in New Zealand equities could foreshadow weaker activity that keeps the RBNZ on hold longer than currently anticipated.
| Asset | Level | WoW |
|---|---|---|
| Shanghai Composite | 3842.2 | +0.5% |
| Hang Seng | 23972.29 | -2.7% |
| TAIEX | 48475.74 | +1.8% |
| USD/CNY | 6.7 | -0.1% |
| USD/HKD | 7.85 | +0.0% |
| Copper | 6.55 | -0.3% |
| Brent Crude | 102.25 | -2.9% |
| Gold | 4162.3 | -0.1% |
| Bitcoin | 85461.99 | +1.2% |


Policy signals override soft prior prints. China’s government delivered simultaneous tariff relief, mortgage subsidies and a policy-rate cut during the final week of September, shifting the domestic narrative from data dependence to explicit support. The measures followed the Trump-Xi summit and coincided with canceled fuel-export cargoes that tightened domestic supply. Equity markets reacted unevenly: the Shanghai Composite advanced 0.49 percent to 3,842.20 while the CSI 300 posted a net 0.29 percent gain to 4,357.62. Hong Kong’s Hang Seng declined 2.72 percent to 23,972.29 as investors weighed the scope of property measures against external tariff exclusions. Taiwan’s TAIEX rose 1.77 percent to 48,475.74, supported by semiconductor demand resilience. USD/CNY eased 0.13 percent to 6.70. Copper, a key China demand proxy, finished at 6.55 after a 0.26 percent weekly decline. Brent crude fell 2.88 percent to 102.25, reducing imported inflation pressure for the region. The configuration leaves Greater China activity in a stabilization phase rather than outright acceleration.
PMI prints confirm momentum shift. Official and private gauges both surprised to the upside. The NBS Manufacturing PMI crossed into expansion territory for the first time since June. Non-Manufacturing PMI printed above forecast. RatingDog Manufacturing PMI advanced while Services PMI also rose. These readings followed August CPI, confirming subdued price pressures that accommodate further easing. Market participants interpreted the diffusion between official and private indices as evidence of broad-based stabilization rather than sector-specific noise. No high-impact data releases occurred late in the week, allowing policy announcements to dominate price action.
Regional differentiation persists. Hong Kong equities underperformed despite the mainland policy impulse, reflecting concerns over the pace of property stabilization and the exclusion of strategic sectors from tariff cuts. Taiwan indices advanced on export strength. Currency moves remained contained: USD/HKD held at 7.85 with a 0.03 percent weekly increase, while USD/CNY traded in a narrow range. Commodity proxies for Chinese demand showed modest net declines, consistent with the broader energy-price retreat observed globally. The week therefore closed with clearer domestic policy support but continued external differentiation across Greater China assets.
The PBoC delivered a policy-rate cut alongside mortgage subsidies for first-time buyers and cheap-loan facilities to clear local-government arrears. The central bank also fixed the USD/CNY reference rate each day, anchoring the spot rate at 6.70. No open-market operation surprises occurred, and liquidity conditions remained consistent with prior-week settings. HKMA maintained the currency peg without intervention, with USD/HKD closing at 7.85. The CBC held its policy rate unchanged, tracking semiconductor export data and cross-strait investment flows. The week’s PMI beats and subdued August CPI reinforce expectations for a continued easing bias through year-end. Forward guidance from Beijing emphasized further property-market stabilization measures without specifying timing. The configuration leaves the PBoC, HKMA and CBC all in data-dependent but accommodative postures, with domestic activity stabilization reducing the urgency for aggressive additional cuts.
China’s September PMI releases delivered broad-based beats that shifted the growth narrative. NBS Manufacturing PMI printed in line with consensus and above the prior, marking the first expansion reading in four months. NBS Non-Manufacturing PMI reached a level above consensus and higher than the August print, indicating services momentum exceeded expectations. RatingDog Manufacturing PMI advanced versus consensus and prior, while RatingDog Services PMI rose against expected and prior. These outcomes followed August CPI, leaving room for further policy accommodation. The data point to a mid-cycle stabilization rather than reacceleration, with the manufacturing diffusion index now above the 50 threshold for the first time since June. Subdued price pressures and the absence of labor-market overheating signals keep the PBoC on an easing bias into the fourth quarter. The combination of official and private gauge improvement reduces the probability of further downside revisions to Q3 GDP estimates. Overall, the releases confirm that policy support announced late in the month is arriving against a backdrop of genuine activity stabilization rather than continued contraction.
| Date | Ctry | Event | Prior | Cons. | Actual |
|---|---|---|---|---|---|
| Tue 29 | CN | Current Account Final | 184.3bn | - | 193.7bn |
| Tue 29 | CN | NBS Manufacturing PMI | 49.8 | 50.1 | 50.1 |
| Tue 29 | CN | NBS Non-Manufacturing PMI | 49.0 | 49.3 | 50.2 |
| Tue 29 | CN | NBS General PMI | 49.5 | - | 50.7 |
| Tue 29 | CN | RatingDog Manufacturing PM | 51.5 | 51.6 | 52.1 |
| Tue 29 | CN | RatingDog Services PMI | 51.4 | 51.1 | 51.6 |
| Tue 29 | CN | RatingDog Composite PMI | 52.1 | - | 52.4 |
| Wed 30 | TW | Consumer Confidence Index | 65.0 | - | - |
| Wed 30 | TW | S&P Global Manufacturing P | 54.7 | - | - |
| Fri 2 | HK | Retail Sales Year-over-Yea | 2.3 | - | 2.9 |
No high-impact China, Hong Kong or Taiwan data releases are scheduled for October 5–9. Markets will monitor follow-through from the mortgage-subsidy and policy-rate announcements, particularly any additional local-government financing facilities. PBoC daily open-market operations and the USD/CNY reference rate will remain the primary domestic anchors. HKMA will continue to manage USD/HKD peg mechanics and aggregate balance flows. CBC speakers are expected to comment on semiconductor export trends and cross-strait investment without an immediate rate decision. Global PMI prints from Japan, euro area and the United States will provide external context for regional risk sentiment. Copper and Brent crude price action will continue to serve as proxies for Chinese demand expectations. Any follow-up tariff implementation details from the Trump-Xi summit will also warrant attention.
The week’s PMI beats reduce downside growth risks but leave upside limited by the exclusion of strategic sectors from tariff relief. Property-market stabilization measures may take several weeks to translate into transaction volumes, creating a window for sentiment volatility. USD/CNY at 6.70 leaves limited room for further appreciation without PBoC intervention, while any renewed dollar strength could pressure regional equities. Hong Kong’s 2.72 percent weekly decline signals potential positioning overhang that could amplify moves on negative news. Copper’s 0.26 percent weekly decline despite policy support highlights external demand concerns. Volatility remains contained, with daily equity moves under 1 percent outside the Hang Seng’s later drop. Flows into mainland equities may accelerate if additional property measures materialize, while Taiwan’s semiconductor exposure offers relative insulation from domestic policy outcomes.
Equities posted mixed net changes after policy announcements. Shanghai Composite rose 0.49 percent to 3,842.20 while CSI 300 gained 0.29 percent to 4,357.62; Hang Seng declined 2.72 percent to 23,972.29 and TAIEX advanced 1.77 percent to 48,475.74. Fixed-income markets saw limited movement with China 10-year government yields remaining stable near prior-week levels and no new benchmark prints released. USD/CNY closed at 6.70 after a 0.13 percent weekly decline. USD/HKD finished at 7.85, up 0.03 percent, consistent with HKMA peg maintenance. Copper ended at 6.55 after a 0.26 percent weekly decline, while Brent crude fell 2.88 percent to 102.25 and gold declined 0.15 percent to 4,162.30. Bitcoin rose 1.19 percent to 85,461.99. Daily equity moves were most pronounced when initial policy optimism emerged, before profit-taking set in later.
Dollar strength observed in prior weeks continued to influence regional currency and commodity pricing, with USD/CNY declining only modestly despite domestic policy support. Brent crude’s 2.88 percent weekly decline to 102.25 eased imported inflation pressure for net-energy importers across Greater China. US September jobs data reinforced external yield-support narratives without immediate spillover to regional policy expectations. Trade dynamics improved modestly after reciprocal tariff cuts, though exclusion of soybeans and strategic sectors limited the direct growth impulse. Geopolitical risk around rare-earth supply chains remained elevated, with China maintaining dominant processing capacity. Cross-border spillovers from euro-area fiscal-spread widening and Japanese yield increases stayed secondary to domestic policy signals during the week.
| Asset | Level | WoW |
|---|---|---|
| KOSPI | 7003.74 | +1.6% |
| KOSDAQ | 893.29 | +5.5% |
| USD/KRW | 1342.51 | -0.9% |
| Samsung | 276000.0 | +2.2% |
| SK Hynix | 1841000.0 | +4.1% |
| Brent Crude | 102.25 | -2.9% |
| Gold | 4162.3 | -0.1% |
| Bitcoin | 85461.99 | +1.2% |


Export momentum supported equities. Semiconductor demand lifted KOSPI and KOSDAQ, with Samsung and SK Hynix shares advancing. Business sentiment indicators softened. The Business Confidence Index declined, yet equity and FX markets focused on trade resilience. Inflation eased modestly. The year-over-year rate moved lower, aligning with reduced immediate price pressure. Yields declined. The 3-year and 10-year government yields both fell. Currency intervention supported the won. Reported Bank of Korea sales coincided with USD/KRW moving lower week-over-week. Equity performance showed rotation. KOSPI rose 1.65 percent to 7003.74 while KOSDAQ advanced 5.52 percent to 893.29, with semiconductor names accounting for most of the net gain. Commodity prices eased. Brent Crude declined 2.88 percent to 102.25, providing a secondary tailwind for manufacturers. Policy communication remained steady. Bank of Korea statements emphasized sound fundamentals despite global uncertainty. Data arc confirmed external resilience. Strong trade prints, contained inflation, and a firmer won aligned with semiconductor-driven outperformance. Overall narrative centered on divergence. Domestic confidence indicators softened while trade and price data supported a constructive growth-inflation mix ahead of the next policy decision.
Bank of Korea commentary during the week highlighted that domestic fundamentals remain sound even as external risks have heightened. Officials disclosed net foreign-exchange intervention in the second quarter. The export beat and the inflation decline together reinforced the view that external demand continues to outpace domestic softening. No Monetary Policy Committee members spoke publicly, leaving the data prints as the primary inputs for assessing the rate path. The combination of resilient manufacturing PMI and contained inflation suggests officials will maintain a data-dependent stance at upcoming decisions without immediate recalibration.
| Date | Ctry | Event | Prior | Cons. | Actual |
|---|---|---|---|---|---|
| Mon 28 | KR | Business Confidence Index | 81.0 | - | 79.0 |
| Tue 29 | KR | Industrial Production Mont | 0.20 | 0.50 | -4.8 |
| Tue 29 | KR | Industrial Production Year | 4.0 | 4.0 | -2.2 |
| Tue 29 | KR | Retail Sales Month-over-Mo | -2.6 | - | -1.8 |
| Wed 30 | KR | Exports Year-over-Year | 68.7 | 61.7 | 83.5 |
| Wed 30 | KR | Imports Year-over-Year | 22.4 | 21.5 | 26.0 |
| Wed 30 | KR | Trade Balance | 34.8bn | 38.2bn | 49.9bn |
| Wed 30 | KR | S&P Global Manufacturing P | 52.3 | - | 53.9 |
| Thu 1 | KR | Inflation Rate Year-over-Y | 3.1 | 2.9 | 2.9 |
| Thu 1 | KR | Inflation Rate Month-over- | 0.20 | 0.40 | 0.30 |

Monday brings the Japan Consumer Confidence Index, offering an early read on regional sentiment that often influences Korean export expectations. Mid-week S&P Global PMI releases for several European economies will provide context on external demand conditions relevant to Korean manufacturers. No high-impact Korean data are scheduled, shifting attention to any follow-up Bank of Korea statements on intervention. The inflation outcome will likely frame discussions around price stability ahead of the next meeting. Markets will monitor whether export strength sustains or moderates, given its direct bearing on growth assessments for coming quarters. Any further fiscal measures on bond supply or mortgage rules could interact with the rate outlook. Officials’ emphasis on sound fundamentals suggests the data flow will be weighed against external volatility rather than triggering immediate shifts. The absence of new domestic releases keeps the focus on how global PMI prints feed into the Bank of Korea’s assessment of the growth-inflation balance.
The export beat reduces downside risks to near-term growth but leaves open the possibility that semiconductor concentration limits broader spillovers, as noted in recent Bank of Korea observations. Persistent high-rate mortgage demand despite earlier policy adjustments could amplify financial-stability concerns if yields remain elevated. Upside scenarios center on continued PMI improvement feeding into stronger second-half activity, while downside risks hinge on any reversal in global chip demand. The data suggest markets may be underweighting the resilience of Korean trade relative to softer domestic confidence prints. Coordinated bond-buyback facilities announced this week mitigate tail risks of sharp yield spikes but do not alter the underlying growth-inflation configuration.
| Asset | Level | WoW |
|---|---|---|
| JCI | 6036.89 | -1.8% |
| KLCI | 1630.87 | -2.3% |
| STI | 5634.82 | -1.6% |
| USD/IDR | 17893.0 | -0.3% |
| USD/THB | 33.53 | +0.3% |
| USD/MYR | 4.08 | +0.2% |
| USD/PHP | 62.49 | +0.2% |
| USD/SGD | 1.28 | +0.0% |
| Brent Crude | 102.25 | -2.9% |
| Gold | 4162.3 | -0.1% |
| Bitcoin | 85432.79 | +1.1% |


Rupiah pressure dominates regional price action USD/IDR rose early in the week before Bank Indonesia intervention narrowed the advance. By the close on 2 October the cross settled 0.32% weaker on the week. Equity markets reflected the strain: JCI fell 1.81%, KLCI dropped 2.34% and STI declined 1.64%.
Trade data surprise offsets inflation print Indonesia’s August trade surplus exceeded both consensus and the prior reading, driven by commodity exports. September inflation printed slightly below consensus yet above the August outcome. The combination left BI’s assessment of price pressures largely unchanged.
Regional currencies and commodities diverge USD/THB rose 0.30% while USD/MYR advanced 0.21% and USD/PHP gained 0.20%. Brent crude fell 2.88%, offering modest relief to import-dependent ASEAN economies but failing to reverse the broader USD bid. No high-impact data releases occurred in Thailand, Malaysia, the Philippines, Singapore or Vietnam.
Policy coordination replaces rate speculation Bank Indonesia increased bond purchases in September while adjusting spot intervention, signalling a shift toward domestic liquidity support. Thailand’s cabinet approved a larger FY2027 borrowing plan, adding a fiscal dimension to regional flows. The data suggest external USD strength and portfolio outflows remain the dominant drivers rather than any domestic growth surprise.
Bank Indonesia left its policy rate unchanged and stepped up bond purchases while coordinating stabilisation measures with the Finance Ministry to address capital outflows. Officials publicly emphasised that rupiah stability now takes precedence, with spot intervention volumes adjusted dynamically near recent highs. No other central bank in the six economies—BoT, BNM, BSP, MAS or SBV—held meetings or released new forward guidance during the week. The stronger-than-expected August trade surplus and contained September inflation print reinforced BI’s data-dependent stance without altering the near-term rate path signal. Thailand’s FY2027 borrowing approval highlights fiscal expansion but carries no direct implication for BoT policy settings. Overall, the week’s data and statements point to continued emphasis on external stability across the region rather than any shift in domestic rate trajectories.
| Date | Ctry | Event | Prior | Cons. | Actual |
|---|---|---|---|---|---|
| Mon 28 | MY | Producer Price Index Year- | 9.7 | - | 10.7 |
| Mon 28 | SG | 15-Year Bond Auction | - | - | - |
| Mon 28 | SG | Export Prices Year-over-Ye | 13.1 | - | - |
| Mon 28 | SG | Import Prices Year-over-Ye | 13.5 | - | - |
| Mon 28 | SG | Producer Price Index Year- | 33.4 | - | - |
| Tue 29 | SG | MAS 12-Week Bill Auction | 1.8 | - | 1.9 |
| Tue 29 | SG | MAS 4-Week Bill Auction | 1.7 | - | 1.8 |
| Tue 29 | SG | Mas 36-Week Bill Auction | 1.8 | - | 2.0 |
| Tue 29 | PH | Exports Year-over-Year | 10.8 | - | - |
| Tue 29 | PH | Imports Year-over-Year | 19.8 | - | - |
| Tue 29 | PH | Producer Price Index Year- | 3.0 | - | - |
| Tue 29 | PH | Trade Balance | -6.0bn | - | - |
| Tue 29 | SG | Bank Lending | 939.1bn | - | - |
| Wed 30 | TH | Industrial Production Year | 0.46 | - | 4.4 |

The ASEAN calendar remains light, with no central-bank meetings or high-impact data releases scheduled for Indonesia, Thailand, Malaysia, the Philippines, Singapore or Vietnam. External prints will therefore set the tone for currency and yield movements that feed into the next BI, BoT, BNM, BSP, MAS and SBV decisions. Japan’s Consumer Confidence Index and Spain’s S&P Global Services PMI on Monday will provide early signals on global demand that matter for ASEAN export orders. Mid-week euro-area and UK PMI updates will further shape the external backdrop against which regional central banks assess imported inflation risks. Later in the week, any follow-through from China’s latest activity data will be scrutinised for implications on regional supply chains and tourism revenues. Absent domestic catalysts, officials are expected to maintain the data-dependent posture already articulated, with BI’s ongoing FX operations remaining the most visible policy lever.
Persistent foreign outflows from Indonesia continue to test the limits of BI’s intervention capacity even after the stronger trade print. A further leg higher in US yields could widen the external pressure on USD/IDR and force additional bond purchases that crowd out private credit. Thailand’s elevated public-debt trajectory introduces a medium-term fiscal risk that could constrain BoT room for manoeuvre if growth disappoints. On the upside, lower Brent prices would ease imported inflation across the net-energy importers and support a more dovish tilt at upcoming decisions. Markets appear to underweight the possibility that coordinated fiscal-monetary responses in Indonesia could stabilise the rupiah faster than current pricing suggests, leaving scope for positive surprise in regional risk assets if outflows moderate.
| Asset | Level | WoW |
|---|---|---|
| Nifty 50 | 22421.95 | -1.6% |
| Sensex | 71909.7 | -1.2% |
| USD/INR | 96.3 | +0.5% |
| EUR/INR | 108.35 | +2.3% |
| Reliance | 1167.7 | -2.5% |
| HDFC Bank | 721.2 | +0.3% |
| Brent Crude | 102.25 | -2.9% |
| Gold | 4162.3 | -0.1% |
| Bitcoin | 85427.18 | +1.1% |


Industrial strength confirmed Industrial Production exceeded consensus in the latest reading, while Manufacturing Production accelerated from the prior month. The releases lifted near-term growth assessments and prompted corporate debt issuance plans in anticipation of higher borrowing costs.
Equity and currency divergence Nifty 50 declined to 22,421.95 by 4 October, a 1.57% weekly drop, while Sensex fell 1.18% to 71,909.70. USD/INR climbed to 96.30 despite RBI intervention that restored the rate after it touched two-month lows.
Liquidity and external sector updates RBI foreign-exchange operations drained liquidity from surplus conditions, tightening domestic conditions even as forex reserves declined. External debt rose in the June quarter, highlighting ongoing financing needs amid global volatility.
Policy signal from data The industrial outperformance offset softer equity sentiment and reinforced evidence of resilient domestic demand, consistent with the RBI bulletin’s emphasis on financial-sector strength. Brent crude’s weekly decline of 2.88% to 102.25 eased imported inflation concerns without altering the growth narrative.
The Reserve Bank of India responded to the industrial production print by maintaining active foreign-exchange intervention that capped USD/INR at 96.30. Liquidity absorption through dollar sales, bond operations and reverse repos tightened surplus conditions and aligned with the central bank’s focus on domestic resilience. Governor Sanjay Malhotra highlighted risks of complacency amid global and geopolitical headwinds while reiterating support for crypto technology alongside caution on cryptocurrencies themselves. The August data beat shifted internal assessments toward firmer activity momentum, leaving the policy rate path anchored to incoming prints rather than any single external factor. RBI bulletins continued to stress that external-sector buffers remain supported by resilient domestic demand even as external debt rose.
| Date | Ctry | Event | Prior | Cons. | Actual |
|---|---|---|---|---|---|
| Mon 28 | IN | Industrial Production Year | 6.7 | 6.5 | 8.0 |
| Mon 28 | IN | Manufacturing Production Y | 7.3 | - | 9.0 |
| Wed 30 | IN | Government Budget Value | -4551.4bn | - | -7102.5bn |
| Wed 30 | IN | External Debt | 762.8bn | - | 778.2bn |
| Thu 1 | IN | HSBC Manufacturing PMI Fin | 52.8 | - | 55.1 |
| Fri 2 | IN | Bank Loan Growth Year-over | 19.1 | - | 18.1 |
| Fri 2 | IN | Deposit Growth Year-over-Y | 17.8 | - | 17.3 |
| Fri 2 | IN | Foreign Exchange Reserves | 765.9bn | - | 747.6bn |
| Date | Release | Prior | Cons. |
|---|---|---|---|
| 2026-10-07 | RBI Interest Rate Decision | 5.2 | 5.5 |

No high-impact Indian data releases are scheduled for the week of 5–9 October. Markets will monitor any follow-through commentary from RBI officials on liquidity management and external-sector developments. Attention will center on whether the industrial print alters the central bank’s assessment of capacity pressures ahead of upcoming decisions. Global oil-price movements and US Treasury yield shifts will remain key external variables for rupee stability and capital-flow trends. Private capex and credit-growth indicators flagged by analysts will stay in focus as stronger factory data supports the growth narrative. Participants will also track any updates on trade-remedy actions and external debt management that could influence RBI forward guidance.
The strong industrial print reduces downside risks to near-term growth but keeps upside pressure on inflation assessments if momentum broadens beyond manufacturing. The rise in external debt and the drop in forex reserves highlight vulnerability to sustained dollar strength observed in prior weeks. Equity-market underperformance despite the data beat suggests investor caution that could amplify any reversal in global risk appetite. RBI liquidity drainage tightens conditions faster than many participants anticipated, raising the possibility that policy remains tighter for longer than previously embedded. The configuration leaves the outlook balanced between resilient domestic activity and external financing pressures that could challenge the current policy stance if commodity volatility reaccelerates.
| Asset | Level | WoW |
|---|---|---|
| BIST 100 | 12270.2 | -2.6% |
| USD/TRY | 49.13 | +0.3% |
| EUR/TRY | 55.29 | -0.8% |
| GBP/TRY | 65.03 | +0.4% |
| Gold (TRY) | 4162.3 | -0.1% |
| Brent Crude | 102.25 | -2.9% |
| EUR/USD | 1.13 | -1.1% |
| Bitcoin | 85435.61 | +1.2% |


Labor market and external balance alignment Turkey’s unemployment rate improved in the latest reading while the trade balance matched consensus. These prints arrived on September 30 and provided the week’s clearest domestic data points.
Equity and currency price action The BIST 100 posted a net 2.56 percent decline to 12,270.20, with daily moves including a drop on September 30 followed by a rebound on October 1. USD/TRY rose 0.33 percent over the week to 49.13, while EUR/TRY eased 0.80 percent to 55.29. Gold (TRY) finished 0.15 percent lower at 4,162.30.
Global context transmission Dollar strength observed across emerging-market crosses in prior weeks continued to exert selective pressure, yet Turkey’s currency moves remained contained relative to larger regional depreciations. Brent Crude’s 2.88 percent weekly decline to 102.25 offered modest relief on the import bill without altering the immediate growth signal.
Data confirmation versus expectations The unemployment improvement exceeded the lack of consensus while the trade balance aligned precisely, suggesting no major surprise on the external side. Equity volatility tracked the broader mid-cycle environment rather than any single domestic release. The configuration leaves the growth-inflation mix stable but still data-dependent for the Central Bank of the Republic of Turkey ahead of upcoming decisions.
No Central Bank of the Republic of Turkey speakers, minutes, or policy announcements were released during the week. The September 30 labor-market and trade prints therefore constitute the primary new inputs for the rate path. An improved unemployment reading alongside an on-consensus trade deficit supports the view that domestic demand and external balances remain consistent with the current policy stance. Officials have previously emphasized data dependence, and these releases reinforce that approach without introducing new forward guidance. The absence of fresh communication leaves the policy rate unchanged and the next meeting’s decision anchored to subsequent inflation and activity releases.
| Date | Ctry | Event | Prior | Cons. | Actual |
|---|---|---|---|---|---|
| Tue 29 | TR | Economic Confidence Index | 101 | - | 101 |
| Wed 30 | TR | Balance of Trade Final | -7.3bn | -5.2bn | -5.2bn |
| Wed 30 | TR | Headline Unemployment Rate | 8.1 | - | 7.8 |
| Wed 30 | TR | Exports Final | 25.6bn | 23.5bn | 23.5bn |
| Wed 30 | TR | Imports Final | 32.9bn | 28.7bn | 28.7bn |
| Wed 30 | TR | Labor Force Participation | 52.5 | - | 52.5 |
| Thu 1 | TR | Istanbul Chamber of Indust | 48.1 | - | 47.9 |
| Thu 1 | TR | Foreign Exchange Reserves | 62.8bn | - | 61.6bn |
| Fri 2 | TR | Balance of Trade Prel | -5.2bn | - | - |
| Fri 2 | TR | Exports Prel | 23.5bn | - | - |
| Fri 2 | TR | Imports Prel | 28.7bn | - | - |
Monday brings Japan Consumer Confidence and several euro-area PMI prints that will shape global risk sentiment. Russia and Spain services PMIs follow on the same day, feeding into broader growth assessments relevant for commodity and capital-flow channels. Mid-week euro-area and UK inflation data will influence external yield differentials that transmit to TRY crosses. No high-impact Turkey-specific releases appear on the calendar, so attention will center on how global prints affect imported inflation and external demand. The Central Bank of the Republic of Turkey will monitor these external signals for any shift in the inflation outlook ahead of upcoming decisions. Officials have stressed reliance on incoming data, making the next round of activity and price prints the key variables for the policy-rate trajectory in coming quarters.
The week’s contained TRY moves occurred against a backdrop of prior dollar breadth, suggesting limited immediate repricing of external pressure. An upside scenario would see further unemployment improvement and stable trade balances supporting a steady policy rate through the next meeting. A downside scenario centers on renewed energy-price volatility or weaker global PMIs that could widen the current-account gap. Markets appear to price steady external conditions, yet any deviation in euro-area or US data could alter capital-flow dynamics faster than domestic prints alone would indicate.
| Asset | Level | WoW |
|---|---|---|
| Saudi Aramco | 25.42 | -1.6% |
| MSCI Saudi | 36.22 | -2.0% |
| MSCI UAE | 19.55 | -3.2% |
| MSCI Qatar | 16.29 | -1.8% |
| MSCI Kuwait | 36.34 | -1.4% |
| Brent Crude | 102.25 | -2.9% |
| WTI Crude | 91.11 | -1.6% |
| Gold | 4162.3 | -0.1% |
| USD/SAR | 3.75 | +3.1% |
| USD/AED | 3.67 | +0.0% |
| USD/KWD | 0.31 | -0.1% |
| Bitcoin | 85427.18 | +1.1% |


Geopolitical supply shocks and equity response Supply concerns lifted Saudi Aramco, which closed the week at 25.42 after a 1.55% decline, while MSCI Saudi ended at 36.22 after a 1.98% drop. MSCI UAE finished at 19.55 after a 3.22% decline. Equity markets priced net supply relief rather than sustained risk premia.
Fiscal guidance and oil price path Saudi Arabia released 2027 budget parameters that included higher spending and a wider deficit after an expected GDP contraction in 2026. Brent crude closed the week at 102.25 after a 2.88% decline from the prior Friday, while WTI finished at 91.11. The data confirm that fiscal balance projections remain tightly linked to realized oil export volumes. No PMI, CPI, or trade figures were published in any GCC market during the period, leaving the fiscal signal as the sole domestic macro release.
Currency and cross-asset stability USD/SAR held at 3.75 after a 3.12% weekly increase while USD/AED remained at 3.67. Gold moved 0.15% lower to 4162.3. The absence of domestic data prints meant that regional asset performance tracked external oil and security developments exclusively.
No GCC central bank governor speeches, minutes, or policy decisions were released during the week. Saudi, UAE, Qatar, and Kuwait policy rates therefore remained unchanged and continued to track the USD policy rate through the currency pegs. The 2027 budget guidance supplies no new information on near-term spending that would alter the inflation or growth backdrop facing the central banks. The data therefore leave the policy signal unchanged: authorities will continue to set rates in lockstep with the Federal Reserve absent any domestic inflation or activity release that challenges the peg framework. Officials' public commentary focused exclusively on regional security coordination rather than monetary conditions.
| Date | Ctry | Event | Prior | Cons. | Actual |
|---|---|---|---|---|---|
| Wed 30 | SA | Headline Unemployment Rate | 3.1 | - | - |
| Wed 30 | SA | M3 Money Supply Year-over- | 8.2 | - | 5.6 |
| Wed 30 | SA | Private Bank Lending Year- | 5.6 | - | 6.0 |
Monday brings Japan Consumer Confidence and Spain S&P Global Services PMI, both of which feed into global growth assessments that indirectly shape oil demand expectations for GCC exporters. Tuesday features Italy and France S&P Global Services PMI prints that will update euro-area activity momentum ahead of any upcoming ECB decision. Wednesday includes Germany CPI and US ADP employment data that will inform the inflation and labor backdrop relevant to the USD rate path. Thursday delivers US Initial Jobless Claims and ISM Services PMI, releases that historically influence dollar strength and therefore the GCC pegged policy rates. Friday closes the period with US Nonfarm Payrolls, the single highest-impact print for the coming quarters' rate outlook. The continued absence of any scheduled GCC data or central bank meetings means the rate path will be determined solely by these external releases and their implications for the USD. Markets will also monitor any follow-up commentary on the Saudi 2027 budget parameters for signals on fiscal impulse in the quarters ahead.
Geopolitical tail risks remain elevated. Saudi fiscal guidance signals that lower oil revenues are already being incorporated into spending plans, limiting upside surprises to non-oil growth. The lack of any domestic inflation or activity data leaves the GCC central banks with no new inputs to deviate from the USD peg, so any mispricing would stem from external dollar or oil volatility rather than local surprises. Upside scenarios center on faster pipeline throughput supporting Aramco earnings and equity indices, while downside cases involve renewed incidents that could reprice Brent higher and widen fiscal gaps.
| Time | Country | Event | Our Est. | Consensus | Prior | Impact |
|---|---|---|---|---|---|---|
| MONDAY, OCTOBER 5 | ||||||
| 01:00 | 🇯🇵 | Consumer Confidence Index | — | 35.3 | 35.5 | ●●● |
| 03:15 | 🇪🇸 | S&P Global Services PMI | — | 57.1 | 57.8 | ●●○ |
| 03:45 | 🇮🇹 | S&P Global Services PMI | — | — | 55.2 | ●●○ |
| 09:00 | 🇧🇷 | S&P Global Services PMI | — | — | 50.5 | ●●○ |
| 10:00 | 🇺🇸 | Services Sector PMI | — | 55.7 | 55.4 | ●●● |
| 19:30 | 🇦🇺 | Westpac Consumer Confidence Change | — | — | -5.2 | ●●● |
| 19:30 | 🇦🇺 | Westpac Consumer Confidence Index | — | — | 84.4 | ●●○ |
| TUESDAY, OCTOBER 6 | ||||||
| 02:00 | 🇩🇪 | Factory Orders Month-over-Month | — | -0.90 | 2.5 | ●●○ |
| 02:35 | 🇯🇵 | BoJ Gov Ueda Speech CB | — | — | — | ●●● |
| 02:45 | 🇫🇷 | Industrial Production Month-over-Month | — | 0.20 | -0.40 | ●●○ |
| 04:30 | 🇬🇧 | S&P Global Construction PMI | — | 45.4 | 44.3 | ●●○ |
| 08:00 | 🇲🇽 | Consumer Confidence Index | — | — | 46.1 | ●●○ |
| 08:15 | 🇺🇸 | ADP Employment Change Weekly | — | — | 20,000 | ●●○ |
| 08:30 | 🇨🇦 | Trade Balance | — | 1.3B | 770.0M | ●●○ |
| 08:30 | 🇺🇸 | Exports Level | — | — | 310.7B | ●●○ |
| 08:30 | 🇺🇸 | Imports Level | — | — | 399.3B | ●●○ |
| 08:30 | 🇺🇸 | Trade Balance | — | -89.8B | -88.6B | ●●○ |
| 09:05 | 🇺🇸 | Speech by Fed's Williams | — | — | — | ●●○ |
| 10:00 | 🇨🇦 | Ivey PMI Seasonally Adjusted | — | 65.2 | 64.3 | ●●● |
| 10:45 | 🇺🇸 | Speech by Fed's Bowman | — | — | — | ●●○ |
| 14:00 | 🇧🇷 | Trade Balance | — | — | 7.4B | ●●○ |
| 16:30 | 🇺🇸 | API Weekly Crude Oil Stocks | — | — | 1.0M | ●●○ |
| 18:00 | 🇦🇺 | Ai Group Industry Index | — | — | -3.5 | ●●○ |
| 19:00 | 🇺🇸 | Speech by Fed's Logan | — | — | — | ●●○ |
| WEDNESDAY, OCTOBER 7 | ||||||
| 00:30 | 🇮🇳 | RBI Interest Rate Decision CB | — | 5.5 | 5.2 | ●●● |
| 02:00 | 🇩🇪 | Industrial Production Month-over-Month | — | 1.4 | -1.1 | ●●○ |
| 02:00 | 🇬🇧 | Lloyds House Price Index Month-over-Month | — | 0.20 | -0.20 | ●●○ |
| 02:00 | 🇬🇧 | Lloyds House Price Index Year-over-Year | — | — | -0.40 | ●●○ |
| 02:45 | 🇫🇷 | Trade Balance | — | -6.5B | -6.7B | ●●○ |
| 07:00 | 🇺🇸 | MBA 30-Year Mortgage Rate | — | — | 7.3 | ●●○ |
| 10:30 | 🇺🇸 | EIA Weekly Crude Oil Inventory | — | — | 922,000 | ●●○ |
| 10:30 | 🇺🇸 | EIA Weekly Gasoline Inventory | — | — | -1.7M | ●●○ |
| 14:00 | 🇺🇸 | FOMC Meeting Minutes | — | — | — | ●●● |
| 19:01 | 🇬🇧 | RICS House Price Balance | — | -30 | -28 | ●●○ |
| 19:50 | 🇯🇵 | Current Account Balance | — | — | 2989.0B | ●●○ |
| Time | Country | Event | Our Est. | Consensus | Prior | Impact |
|---|---|---|---|---|---|---|
| THURSDAY, OCTOBER 8 | ||||||
| 02:00 | 🇩🇪 | Trade Balance | — | 19.2B | 21.3B | ●●● |
| 02:00 | 🇩🇪 | Exports Month-over-Month | — | — | -0.80 | ●●○ |
| 08:00 | 🇲🇽 | Inflation Rate Month-over-Month | — | — | 0.20 | ●●○ |
| 08:00 | 🇲🇽 | Inflation Rate Year-over-Year | — | — | 3.3 | ●●○ |
| 08:30 | 🇺🇸 | Weekly Jobless Claims | — | 195,000 | 197,000 | ●●○ |
| 13:40 | 🇺🇸 | Speech by Fed's Musalem | — | — | — | ●●○ |
| 19:30 | 🇯🇵 | Household Spending Month-over-Month | — | — | 0.50 | ●●○ |
| 19:30 | 🇯🇵 | Household Spending Year-over-Year | — | -3.5 | -3.6 | ●●○ |
| FRIDAY, OCTOBER 9 | ||||||
| 04:00 | 🇮🇹 | Industrial Production Month-over-Month | — | 0 | 0.70 | ●●○ |
| 08:00 | 🇧🇷 | Inflation Rate Month-over-Month | — | — | -0.32 | ●●○ |
| 08:00 | 🇧🇷 | Inflation Rate Year-over-Year | — | — | 4.2 | ●●○ |
| 08:30 | 🇨🇦 | Headline Unemployment Rate | — | 6.5 | 6.4 | ●●● |
| 08:30 | 🇨🇦 | Employment Change | — | 9,500 | -41,700 | ●●○ |
| 08:30 | 🇨🇦 | Full-Time Employment Change | — | — | -35,900 | ●●○ |
| 08:30 | 🇨🇦 | Labor Force Participation | — | — | 65 | ●●○ |
| 08:30 | 🇨🇦 | Part-Time Employment Change | — | — | -5,800 | ●●○ |
| 10:00 | 🇺🇸 | Michigan Consumer Sentiment Prel | — | 48.1 | 48.1 | ●●● |
| 12:00 | 🇷🇺 | Inflation Rate Month-over-Month | — | — | -0.10 | ●●○ |
| 12:00 | 🇷🇺 | Inflation Rate Year-over-Year | — | — | 6.3 | ●●○ |
| 16:00 | 🇺🇸 | Speech by Fed's Collins | — | — | — | ●●○ |
AI-Generated Content: This publication is 100% generated by artificial intelligence systems and should not be considered as financial advice, investment recommendation, or professional research. All analysis, forecasts, and commentary are algorithmically produced.
Data Sources: Market data from public exchange and market-data providers. US Treasury yields from the Federal Reserve (FRED constant-maturity series). Macroeconomic data from central banks and national statistics offices. Economic calendar data from RoboMacro Economic Calendar. All data subject to revision and may be delayed.
No Warranty: RoboMacro makes no warranty, express or implied, regarding the accuracy, completeness, or reliability of the information contained in this publication. Data may be delayed, incomplete, or contain errors. Past performance is not indicative of future results.
Not Financial Advice: Nothing in this publication constitutes investment advice, tax advice, legal advice, or any other form of professional advice. Any opinions expressed are AI-generated and do not represent the views of any individual or organisation. Readers should consult qualified professionals before making investment decisions.
Nowcasts and Model Output: The US labour nowcast is the median of a ten-model ensemble. Activity indices are composite z-scores of weekly public high-frequency indicators, seasonally adjusted, published only for weeks meeting a minimum indicator-coverage threshold; the as-of date and coverage are shown on every row. All model output carries significant uncertainty.
Contact: [email protected] | robomacro.com
Publication: Global Macro Watch is published weekly on Sundays, covering the preceding Monday-to-Friday week. © 2026 RoboMacro. All rights reserved.