
Same Bet, Different Engine: Chib & Tan's DSGE Transformer Next to Our Multi-Country Sims

Our engine is the Global Macro Model v6.4 solver. You give it a shock, say Korea hikes 200bp while China and Korea slap 20% tariffs on each other, and it solves the response across 30 countries. There are 12 shock types it understands (policy rates, oil, metals, housing, fiscal, productivity, tariffs, risk premia and so on), and they can be stacked. Every solve gets written out three ways: machine-readable training records with 20 quarters of paths, QA rows that ask questions about the result, and tool-use rows that show an agent how to call for it. There's also a human-readable report for each sim, which averages about 11,000 words. The free 10-simulation sample sits on Hugging Face, GitHub and our sample page, under CC BY 4.0, so you're free to train on it.
A few weeks ago I wrote a short post saying Chib and Tan had put an academic stamp on synthetic macro data. That post was mostly "look, someone serious agrees with us". This time I went through their paper, co-written with Zhixun Zhang, line by line, v2 on arXiv, Learning the Macroeconomic Language, and set it next to what we've built. The thesis is the same. The product is very different, and the differences are exactly why ours exists.
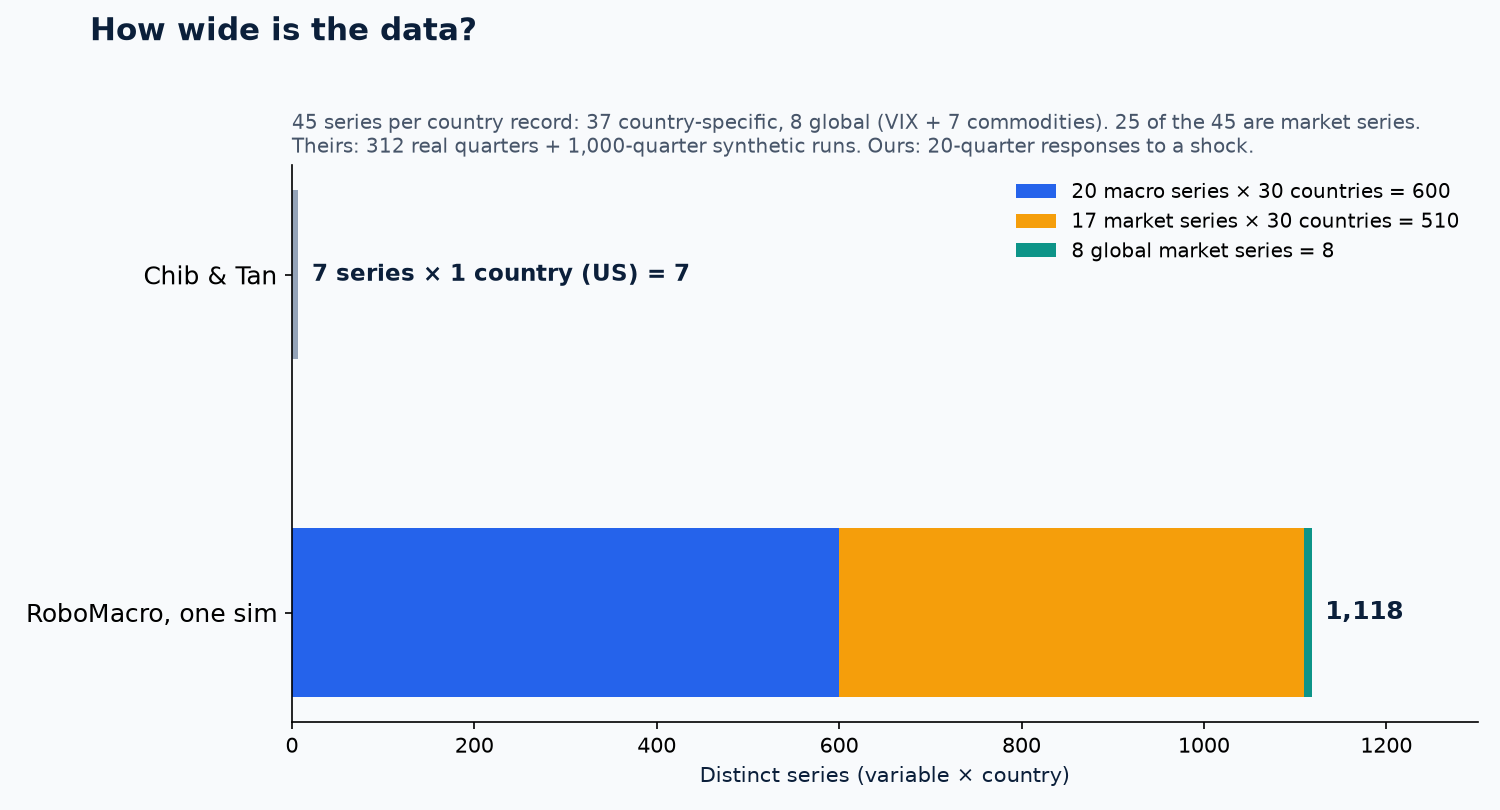
The gap that jumps out first is width. Chib and Tan work with seven series for one country, the US: output, consumption, investment and wage growth, hours worked, inflation and the nominal interest rate. Every one of our records carries 45 series, for each of 30 countries. 37 of those are country-specific and 8 are global (VIX and seven commodity prices), so a single sim gives you 1,118 distinct paths. And 25 of the 45 are financial-market series: three FX measures, government yields from 3 months out to 30 years, six bond prices, equities, bank equity, house prices, VIX and the commodities from oil and gas to copper, wheat and gold. The trade-off is length. Their series are long, 312 real quarters plus 1,000-quarter synthetic runs, while ours are 20-quarter responses to a shock. Narrow and long against wide and short.
What Chib and Tan actually built
They start with US quarterly data from 1947:Q3 to 2025:Q2, which is 312 observations of those seven Smets-Wouters series. That's the whole real dataset. Anyone who has tried to fit anything fancy to quarterly macro knows the feeling.
They cut it into three pieces that never overlap. The first 50 quarters, 1947:Q3 to 1959:Q4, are used only to estimate a DSGE model. The next 231, 1960:Q1 to 2017:Q3, are the real data the transformer trains on. The last 31, 2017:Q4 to 2025:Q2, are locked away for testing, and that window conveniently contains COVID and the 2021-23 inflation surge.
The DSGE is a Smets-Wouters (2007) style medium-scale model with seven structural shocks, extended with stochastic volatility and Student-t innovations so it can produce fat tails and calm-then-violent periods. They estimate it with Bayesian methods following the procedure in their earlier DSGE-SVt toolkit paper and keep 10,000 posterior draws after burn-in. Then the clever bit. They don't simulate at the posterior mean. Each synthetic trajectory gets its own parameter draw, so trajectory one might have sticky prices and persistent shocks while trajectory two is much looser. They run 10,000 of these, each 1,000 quarters long, which gives 10 million synthetic observations. Each trajectory takes milliseconds.
The thing that strikes me is how humble that prior is. The DSGE only ever saw the 1950s. Everything it knows about the economy comes from 50 quarters of postwar data, and that is enough to give a network something to lean on.
The forecaster is tiny. Each variable is cut into 10 percentile bins, so a reading becomes a token from 0 to 9, with the bin edges computed on the training data. Each variable gets its own 8-dimensional embedding, the seven embeddings are glued together into a 56-dimensional state, and the model looks at the last four quarters, like a VAR with four lags. It has two layers, two attention heads and about 52,000 parameters. There are seven of these, one per target variable. Training is cross-entropy on next-token prediction with Adam, in batches of 256 where 10% of the rows are real and 90% are synthetic. They say it trains in minutes on an Apple M2.
That 10/90 mix is the bit I like most. They argue, convincingly, that pretraining on simulations and then fine-tuning on 231 real quarters would just wash the real data out, so they mix from the first step. They treat the mixing ratio like prior strength in a Bayesian setup. All synthetic means you've imposed the DSGE dogmatically, all real means you overfit.
Results-wise, the paper shows a heatmap of predicted token distributions against actuals over 2017:Q4 to 2025:Q2. The model does better on the persistent level series (hours, inflation, the interest rate) than on the noisy growth rates, and when it misses it tends to pick the neighbouring bin rather than something wild. They're explicit that the contribution is methodological, and they deliberately don't compare against VAR or DSGE forecasts. I'd keep that in mind before anyone quotes this paper as "transformers beat VARs". In v2, at least, it doesn't say that.
Where our approach differs
Calibrated structural sims vs posterior sampling
Their uncertainty lives in the parameters. Every trajectory is a different plausible US economy drawn from the posterior, and the randomness inside each run comes from the shocks.
Ours works the other way round. The model is one calibrated, multi-country structure, the solver is deterministic (re-solving the public sims reproduces them bit for bit), and the variety comes from the scenario. We decide the shock, its size, where it lands and what it's combined with. So a sim is an impulse response against a model baseline, Q1 to Q20, across 30 countries and 45 series including yields, FX, equities and house prices. It isn't a draw of what the economy might do next.
That makes their data better at one thing and ours better at another. Theirs exposes a forecaster to parameter uncertainty and tail risk in one economy. Ours exposes a model to cause and effect across countries and asset classes, the "if oil goes to $130 and the US and Mexico put 25% tariffs on each other, who gets hurt most" kind of question. One structure, one deterministic answer per shock, which is what makes every record reproducible and every label exact.
Text and tool-use records vs a time-series transformer
Their model eats tokens that are percentile bins of seven numbers. It never sees a word. Ours is built for language models, so a training row looks like a question and a structured answer. Given this shock and this country, return the GDP peak and its quarter, the three-year CPI effect, the equity peak, and the paths for eight series at Q4, Q8 and Q12, all as one JSON object. The QA rows ask things like which country takes the biggest GDP hit. The tool-use rows teach the model to request the simulation instead of guessing it.
Their tokenisation argument actually helps us here. They say a central bank cares whether inflation is low, moderate or high, not whether it's 2.3% or 2.35%. Our scoring follows a similar instinct. Direction only counts on material moves above a threshold, and magnitude is judged by a normalised error, so a model isn't punished for the fourth decimal.
Shock-family holdouts vs a time split
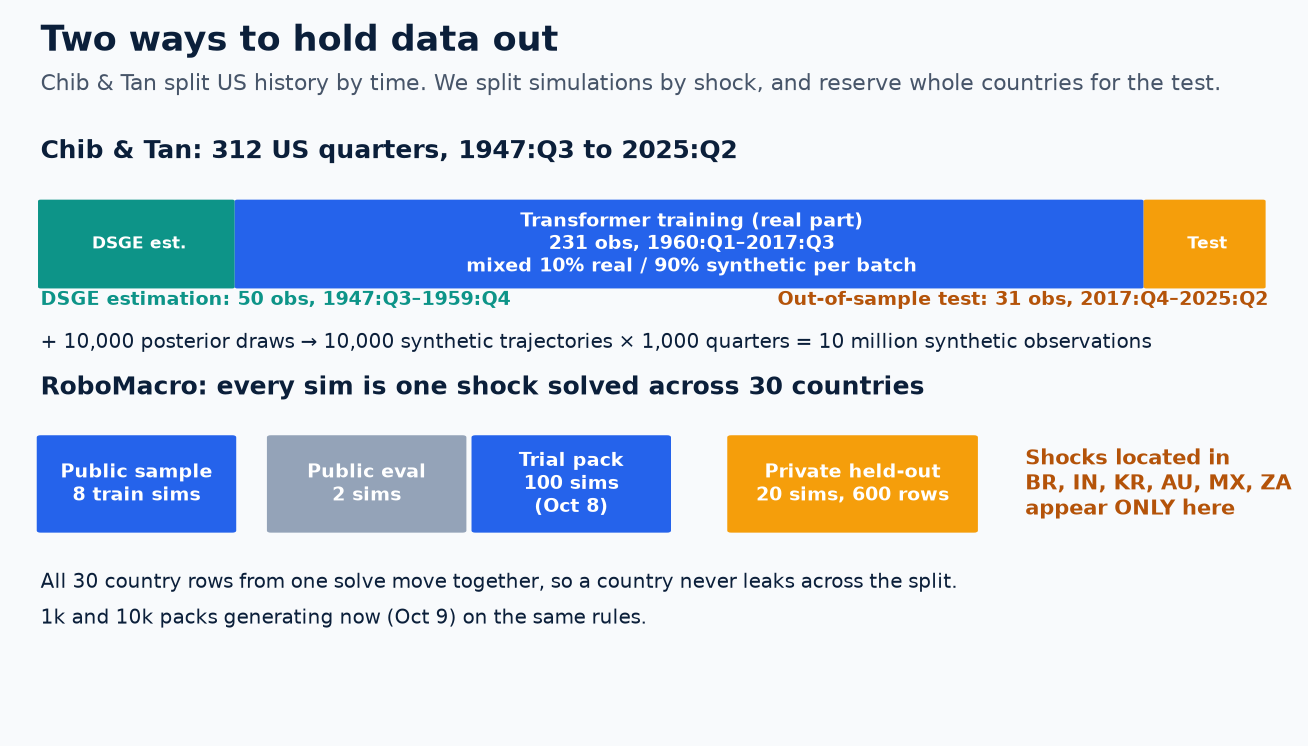
Their test is clean in the obvious way. The transformer never sees anything after 2017:Q3, the DSGE never sees anything after 1959, and all standardisation is computed from the training window only. With one country and one timeline, a time split is the honest choice.
We have no timeline to cut. What we have is 30 country rows that all come out of the same solve, so if Nigeria's response to a shock is in training, Turkey's response to the same shock is basically an open-book exam. So we split by shock and never by country. Then we went further.
How we made the eval leak-proof
We froze an eval spec on Oct 7. It covers the task format, metrics, thresholds, decoding (temperature 0, same settings for every arm) and SHA-256 hashes of the scoring code, all tagged proof-eval-v1. If anything changes after a model has been scored, the version gets bumped and every arm reruns. The public eval set was two sims from the free sample, an oil $180 plus US +150bp combination and a US-China tariff, scored across all 30 countries.
Before pointing any model at it, we ran dumb baselines to check the scorer worked. One of them takes the training sims, scales them and adds them together. On the public eval, scaling and mixing two training sims scored 86.0% on direction with a cross-country rank correlation of 0.497. No model involved. That's what you get when the "unseen" combined shock is close to a linear sum of two shocks you've already seen.
So on Oct 8 we built a proper private held-out set of 20 sims, 600 country rows. The rule is simple and enforced in code. Shocks located in Brazil, India, Korea, Australia, Mexico and South Africa appear only in the held-out set. They never appear in anything a model trains on.
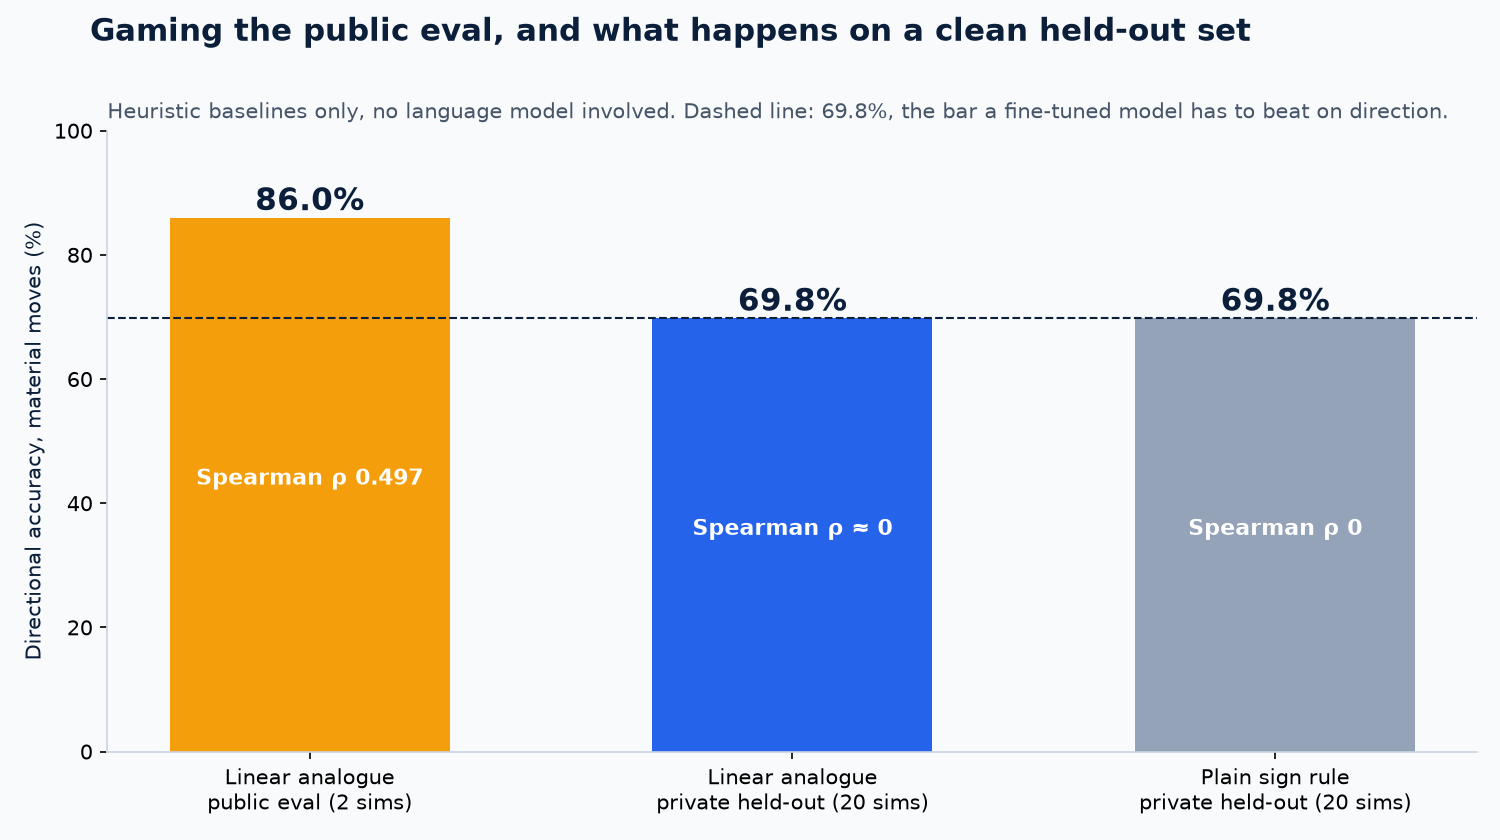
On the held-out set the same scale-and-mix baseline drops to 69.8% on direction, and the rank correlation goes to about zero. A plain sign rule, which applies the textbook direction for each shock type and gives every country the same answer, also scores about 70%. In fact the two baselines tie, because on the held-out set there's nothing in training to rebuild from, so scale-and-mix has nothing to work with. So the bar is set at roughly 70% on direction, and the eval also scores magnitude error, cross-country ranking, peak timing and QA accuracy. That is a hard, honest test, and it's the one our trained models are measured on.
Chib and Tan's test is 31 quarters, one path of history through COVID and an inflation surge. Ours is 600 held-out country rows across shocks the model has never seen, in countries it has never seen shocked.
Side by side
| Chib & Tan (v2) | RoboMacro | |
|---|---|---|
| Variables | 7 US series, one country | 45 series per country record across 30 countries (37 country-specific, 8 global); 25 are market series (FX, yields, bond prices, equities, house prices, VIX, commodities) |
| Engine | Smets-Wouters style DSGE with SV and Student-t, estimated on 1947:Q3-1959:Q4 | Global Macro Model v6.4, calibrated, 30 countries, 12 shock types |
| Synthetic variety | 10,000 posterior draws, one 1,000-quarter path each (10M obs) | Designed shocks and combinations; 1,000- and 10,000-sim packs |
| Learner | ~52k-parameter time-series transformer, 7 models | Language models trained on JSON answers, QA and tool-use rows |
| Real data in training | Yes, 10% of every batch | No |
| Test | 31 quarters, 2017:Q4-2025:Q2 | 20 held-out sims with reserved countries |
| Evaluation | Qualitative out-of-sample forecasts | Frozen, hashed eval spec; 20-sim held-out set with reserved countries |
Chib and Tan can claim that a small transformer, regularised by DSGE simulations and anchored by real data, produces sensible out-of-sample forecasts of seven US series through 2025. They chose not to test against standard benchmarks, and the scope is one country.
Our records are built to teach something wider: how a shock travels across 30 economies and through FX, rates, equities, housing and commodities. And the eval is built to be hard. Models are scored on shocks and countries they have never seen, against the base model, few-shot prompting and a sign rule, under a frozen, hashed spec.
Where this leaves us
Chib and Tan showed that theory-generated data teaches a learner what scarce real data can't. We take the same idea further: 30 countries instead of one, 45 series instead of seven, markets as well as macro, combined shocks, and records written for the language models labs actually train. They built a forecaster for one economy. We built training data for language models that have to reason about the whole global economy.
The 1,000- and 10,000-sim packs are for exclusive sale to one AI lab, so if that might be you, email me at chris@robomacro.com. If you're building macro or multi-asset agents and just want to poke at this yourself, the 10-sim sample is free under CC BY 4.0, training included, on Hugging Face, GitHub and the sample page.
