v6 · IRF · evaluation
A -25% United Kingdom housing shock. Every path is a model impulse response versus baseline, not a forecast and not financial advice.
This note traces the model response to a -25% United Kingdom housing shock. Every path is an impulse response versus an unchanged baseline — not a forecast of what will happen in the world and not a reading of market data. The chapters that follow are already sorted by the size of the GDP response.
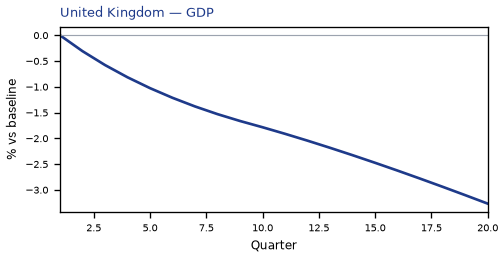
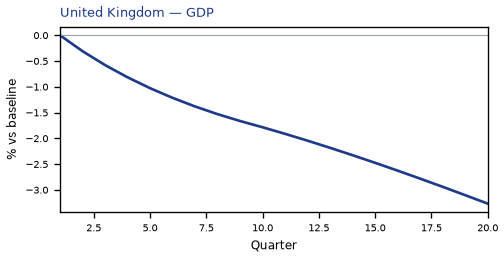
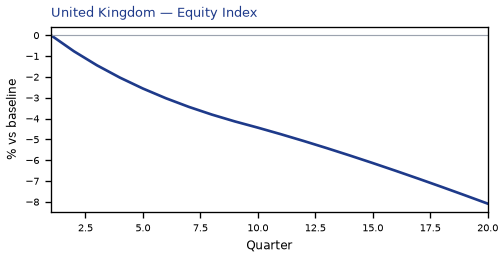
United Kingdom is where the shock lands. GDP contracts by 3.27% by Q20, a first-order GDP response for a -25% United Kingdom housing shock. Equities soften 8.09%, and the three-year CPI impulse is -0.71 percentage points. The move shows up first in private investment, then in household consumption and government spending. That is the main adjustment: a change in financial conditions and real income, then the usual lag into activity and prices. It is the conditional elasticity to the shock that was switched on, not a prediction that this path will be realised.
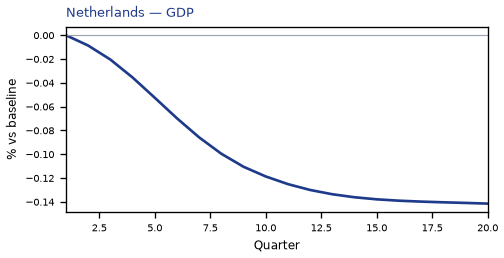
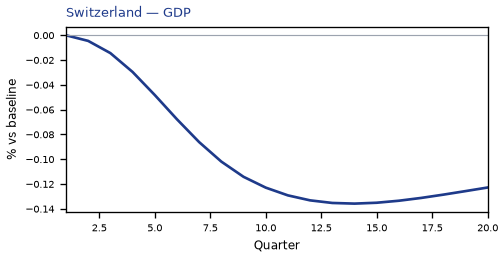
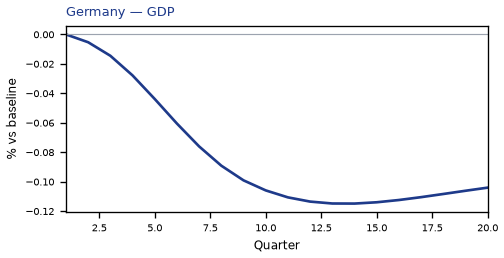
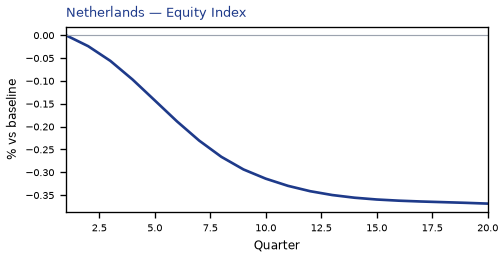
Spillovers are not a carbon copy of that first path. Netherlands contracts by 0.14% versus baseline by Q20 — a moderate GDP response. Equities soften 0.37%. The move shows up first in private investment, then in household consumption and employment. Switzerland contracts by 0.14% versus baseline by Q14 — a moderate GDP response. Equities soften 0.52%, and the three-year CPI impulse is -0.06 percentage points. The move shows up first in private investment, then in household consumption and employment. Germany contracts by 0.11% versus baseline by Q14 — a moderate GDP response. Equities soften 0.21%. The move shows up first in private investment, then in real wages and employment. The contrast is the point: neighbours feel a fraction of the housing-country hit, not a copy of it.
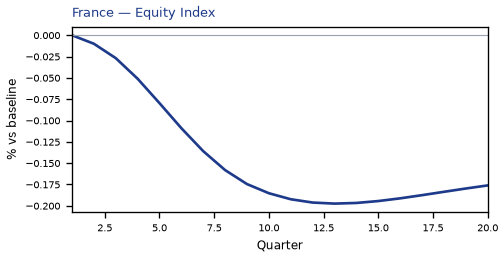
France contracts by 0.10% versus baseline by Q14 — only a small GDP response. Equities soften 0.20%. The move shows up first in private investment, then in government debt and employment.
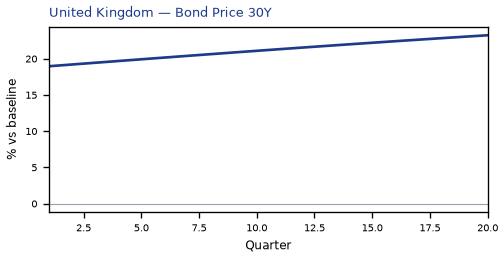
For the lead economy, United Kingdom, the financial backdrop looks like this. On the government curve, 30-year bond prices rally 23.23% by Q20, and unused tenors stay in the background rather than getting a sentence each; the NEER prints a trade-weighted depreciation (-0.25% in Q20). Treat those as the financial backdrop, not as extra shocks, unless they appear in the active treatment.
Read GDP as percent of baseline GDP: −0.52 is minus half a percent, never −52%. A 200 basis-point move is 2.00 percentage points on the policy rate. CPI over three years is the sum of twelve quarterly impulses, not an annualised rate. A rising real exchange rate is a real depreciation — a weaker, more competitive home currency.
The remaining economies are smaller spillovers, written in the same order in the chapters that follow. Each chapter is a desk note, not a catalog of every series. This material is a model-based summary and is not financial advice.
27,000 numbers (30 countries × 45 series × Q1–Q20) · impulse responses · not financial advice
The main impact of a -25% United Kingdom housing shock on the United Kingdom is a large drop in GDP of 3.27% by Q20. This is a model impulse response versus baseline, not a forecast. Equities soften 8.09% by Q20. The three-year CPI impulse is -0.71 percentage points.
Demand and trade. Private investment falls 8.84% by Q20; household consumption falls 2.08% by Q20; government spending rises 0.67% by Q20; government debt falls 0.28% by Q20; related moves also show up in the trade balance.
Labour. Employment falls 3.38% by Q20; unemployment rises by +2.06 percentage points in Q20; real wages fall 1.97% by Q20.
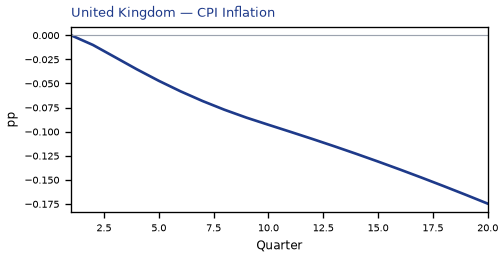
Prices. Firms' marginal cost falls 1.96% by Q20; CPI inflation falls 0.17 percentage points by Q20; domestic inflation falls 0.12 percentage points by Q20.
Policy rates and the government curve. 30-year bond prices rally 23.23% by Q20; 10-year bond prices rally 6.92% by Q20; 5-year bond prices rally 2.70% by Q20; benchmark bond prices rally 2.22% by Q20; related moves also show up in 30-year government yields, 10-year government yields, 2-year bond prices; the rest of the government curve moves less.
Exchange rates. The NEER prints a trade-weighted depreciation (-0.25% in Q20); the real exchange rate shows a real depreciation (a weaker, more competitive home currency), peaking at +0.24% in Q20; the home currency is weaker versus the dollar (+0.22% in Q20).
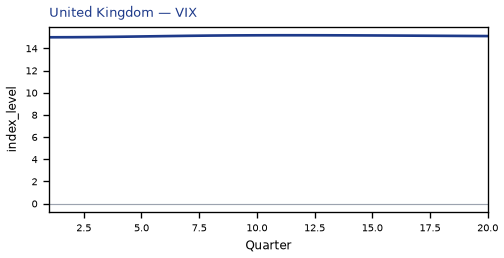
Equities and risk. Equity prices fall 8.09% by Q20; Tobin's Q (the value of installed capital) falls 6.19% by Q20; the VIX (global equity-implied volatility) stays close to baseline.
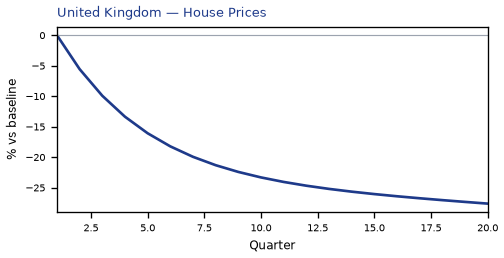
Housing and credit. House prices fall 27.63% by Q20; bank equity falls 12.01% by Q20; bank credit supply falls 9.55% by Q20; lending spreads rise 0.12 percentage points by Q20.
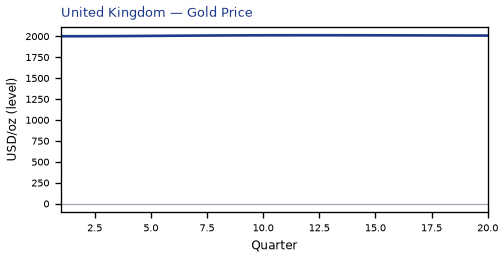
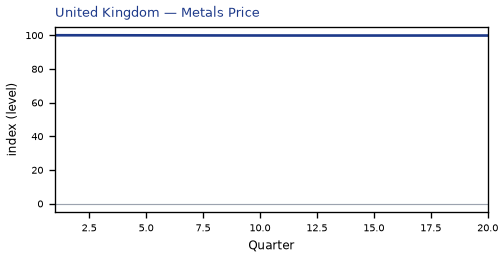
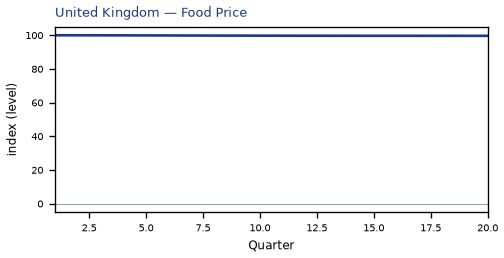
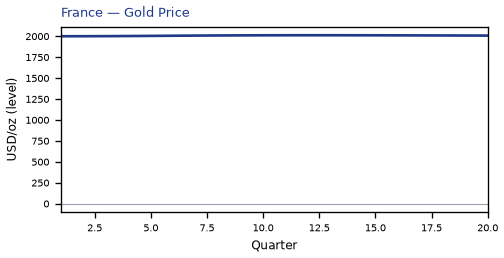
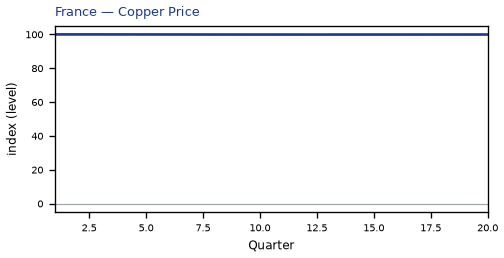
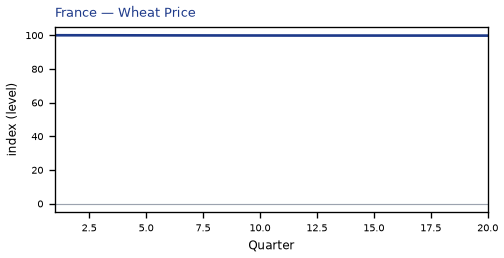
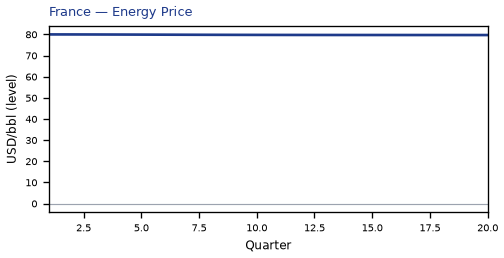
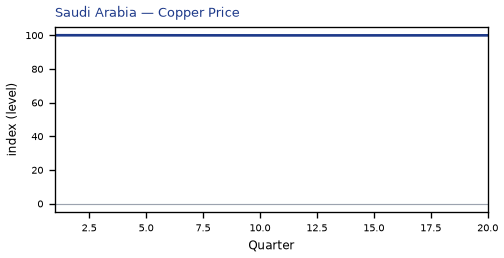
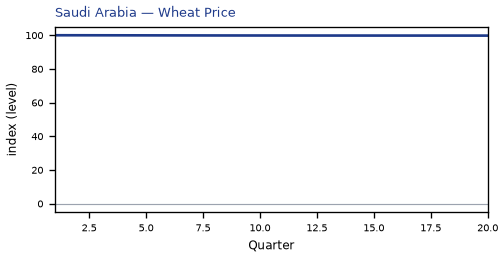
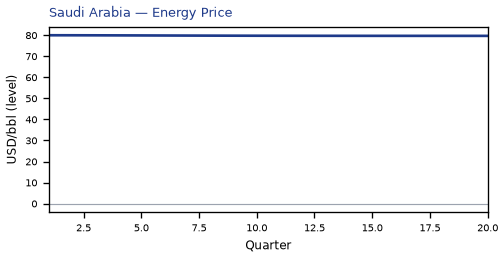
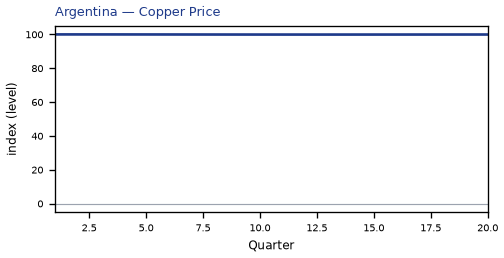
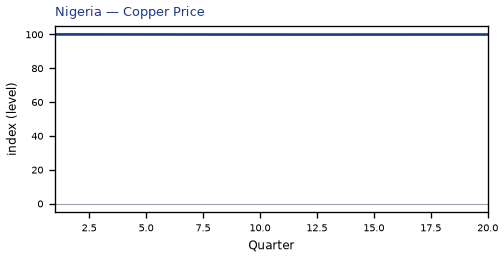
Commodities. Other published commodity prices stay within 3% of their baselines.
Sectors and capital. Services output falls 2.59% by Q20; manufacturing output falls 0.62% by Q20; the capital stock falls 0.50% by Q20.
By Q20, GDP is still -3.27% from baseline.
These figures are model IRFs versus baseline, not forecasts and not financial advice.
global_macro_v64 · contract v6.4 · Q1–Q20 JSON · not financial advice
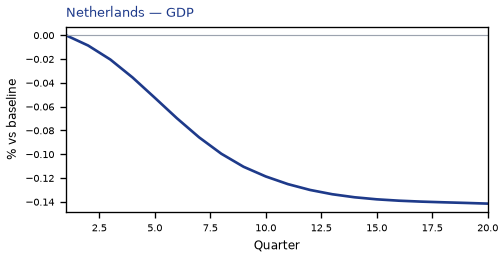
The main impact of a -25% United Kingdom housing shock on the Netherlands is a moderate drop in GDP of 0.14% by Q20. This is a model impulse response versus baseline, not a forecast. Equities soften 0.37% by Q20.
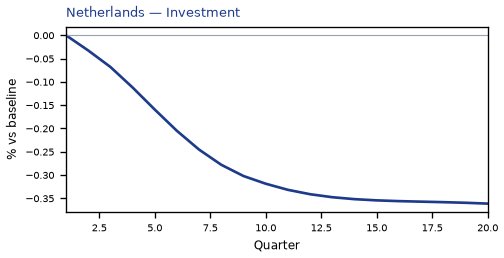
Demand and trade. Private investment falls 0.36% by Q20; household consumption falls 0.09% by Q20; the trade balance, government spending, government debt stay close to baseline.
Labour. Employment falls 0.14% by Q20; real wages fall 0.13% by Q20; unemployment rises by +0.10 percentage points in Q20.
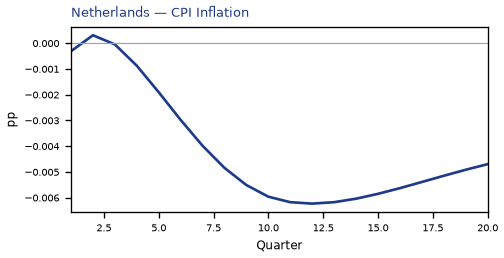
Prices. Firms' marginal cost falls 0.08% by Q20; CPI inflation, domestic inflation stay close to baseline.
Policy rates and the government curve. 30-year bond prices rally 0.28% by Q10; benchmark bond prices rally 0.16% by Q19; 10-year bond prices rally 0.15% by Q11; 5-year bond prices rally 0.10% by Q13; the rest of the government curve barely moves.
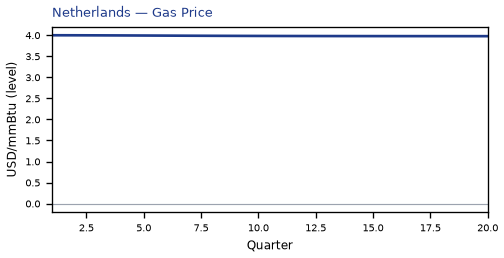
Exchange rates. The real exchange rate, the nominal effective exchange rate (increase = trade-weighted appreciation), the exchange rate versus the dollar (increase = home weaker vs USD) stay close to baseline.
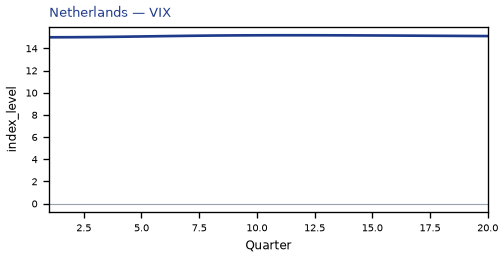
Equities and risk. Equity prices fall 0.37% by Q20; Tobin's Q (the value of installed capital) falls 0.25% by Q20; the VIX (global equity-implied volatility) stays close to baseline.
Housing and credit. Bank equity falls 0.34% by Q20; bank credit supply falls 0.27% by Q20; house prices fall 0.18% by Q20.
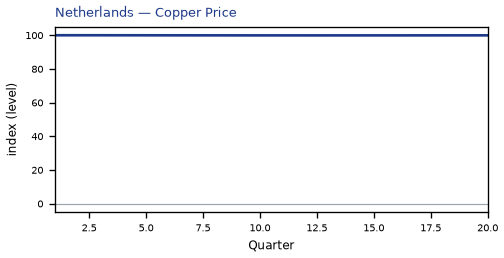
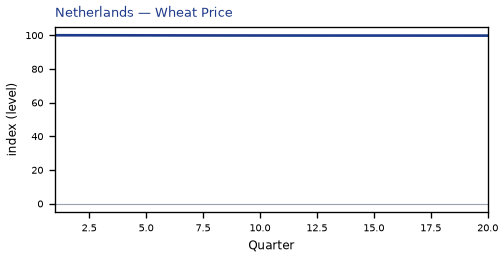
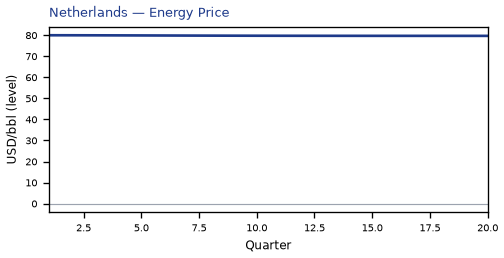
Commodities. Other published commodity prices stay within 3% of their baselines.
Sectors and capital. Services output falls 0.11% by Q20; manufacturing output, the capital stock stay close to baseline.
By Q20, GDP is still -0.14% from baseline.
These figures are model IRFs versus baseline, not forecasts and not financial advice.
global_macro_v64 · contract v6.4 · Q1–Q20 JSON · not financial advice
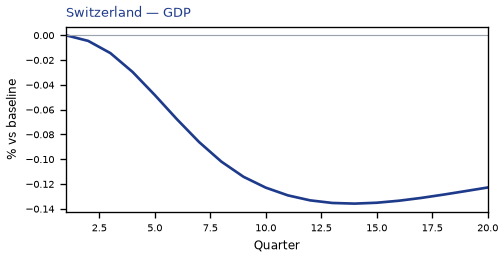
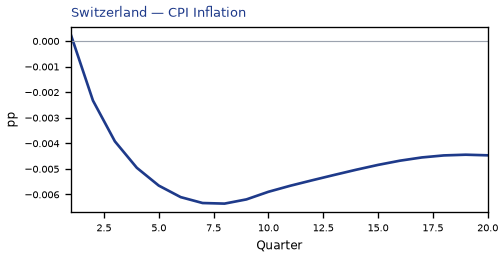
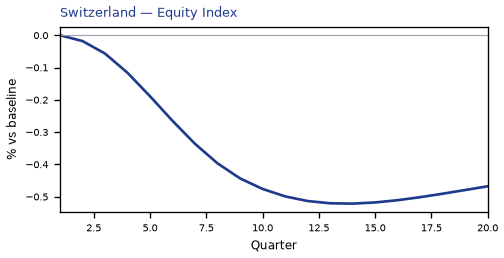
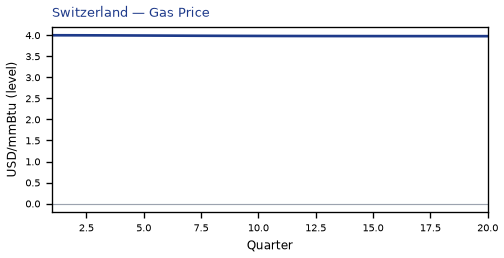
The main impact of a -25% United Kingdom housing shock on Switzerland is a moderate drop in GDP of 0.14% by Q14. This is a model impulse response versus baseline, not a forecast. Equities soften 0.52% by Q14. The three-year CPI impulse is -0.06 percentage points.
Demand and trade. Private investment falls 0.33% by Q12; household consumption falls 0.10% by Q14; the trade balance, government spending, government debt stay close to baseline.
Labour. Employment falls 0.14% by Q18; real wages fall 0.10% by Q20; unemployment rises by +0.10 percentage points in Q19.
Prices. Firms' marginal cost falls 0.08% by Q14; CPI inflation, domestic inflation stay close to baseline.
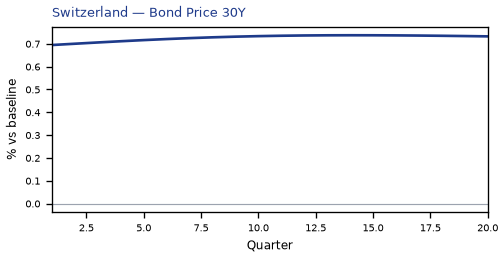
Policy rates and the government curve. 30-year bond prices rally 0.74% by Q14; 10-year bond prices rally 0.37% by Q16; benchmark bond prices rally 0.33% by Q20; 5-year bond prices rally 0.21% by Q18; related moves also show up in 2-year bond prices; the rest of the government curve barely moves.
Exchange rates. The home currency is stronger versus the dollar (-0.16% in Q15); the real exchange rate shows a real appreciation (a stronger home currency), peaking at -0.12% in Q20; the NEER prints a trade-weighted appreciation (+0.10% in Q20).
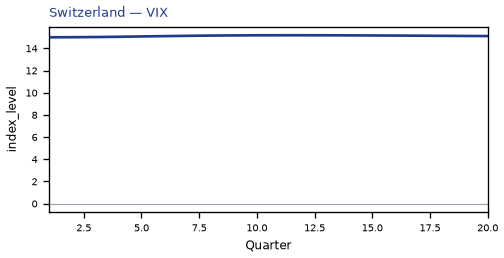
Equities and risk. Equity prices fall 0.52% by Q14; Tobin's Q (the value of installed capital) falls 0.23% by Q12; the VIX (global equity-implied volatility) stays close to baseline.
Housing and credit. Bank equity falls 0.45% by Q20; bank credit supply falls 0.35% by Q20; house prices fall 0.16% by Q20.
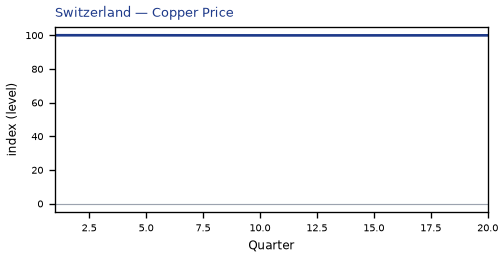
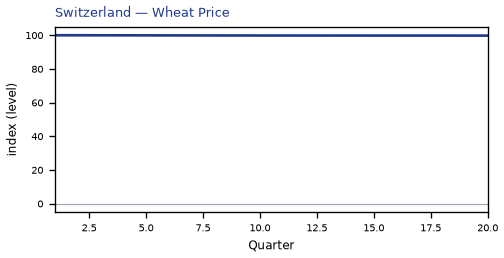
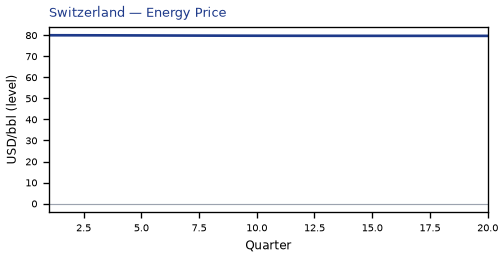
Commodities. Other published commodity prices stay within 3% of their baselines.
Sectors and capital. Services output falls 0.11% by Q14; manufacturing output, the capital stock stay close to baseline.
By Q20, GDP is still -0.12% from baseline.
These figures are model IRFs versus baseline, not forecasts and not financial advice.
global_macro_v64 · contract v6.4 · Q1–Q20 JSON · not financial advice
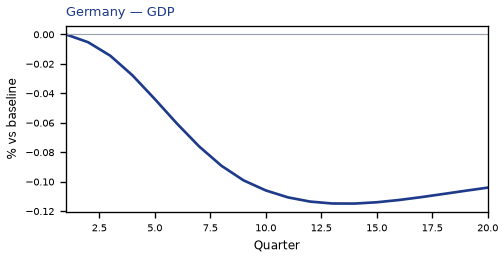
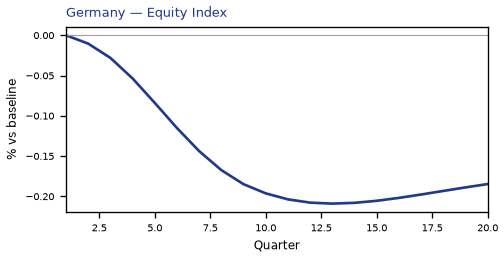
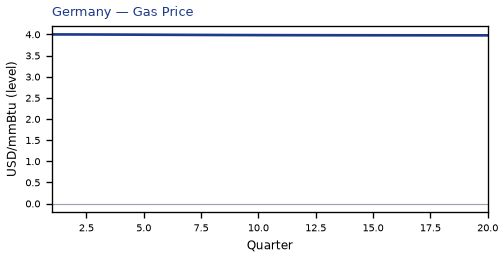
The main impact of a -25% United Kingdom housing shock on Germany is a moderate drop in GDP of 0.11% by Q14. This is a model impulse response versus baseline, not a forecast. Equities soften 0.21% by Q13.
Demand and trade. Private investment falls 0.29% by Q12; household consumption, the trade balance, government spending, government debt stay close to baseline.
Labour. Real wages fall 0.12% by Q20; employment falls 0.12% by Q20; unemployment rises by +0.08 percentage points in Q19.
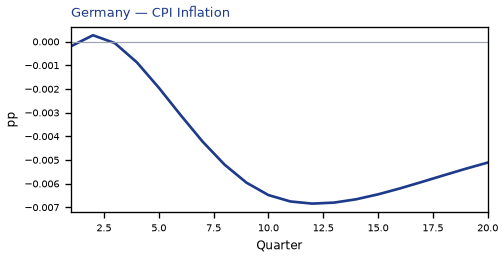
Prices. CPI inflation, domestic inflation, firms' marginal cost stay close to baseline.
Policy rates and the government curve. 30-year bond prices rally 0.28% by Q10; benchmark bond prices rally 0.16% by Q19; 10-year bond prices rally 0.15% by Q11; 5-year bond prices rally 0.10% by Q13; the rest of the government curve barely moves.
Exchange rates. The real exchange rate, the nominal effective exchange rate (increase = trade-weighted appreciation), the exchange rate versus the dollar (increase = home weaker vs USD) stay close to baseline.
Equities and risk. Equity prices fall 0.21% by Q13; Tobin's Q (the value of installed capital) falls 0.20% by Q12; the VIX (global equity-implied volatility) stays close to baseline.
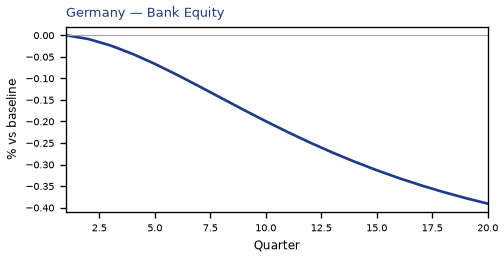
Housing and credit. Bank equity falls 0.39% by Q20; bank credit supply falls 0.32% by Q20; house prices fall 0.13% by Q20.
Commodities. Other published commodity prices stay within 3% of their baselines.
Sectors and capital. Manufacturing output, services output, the capital stock stay close to baseline.
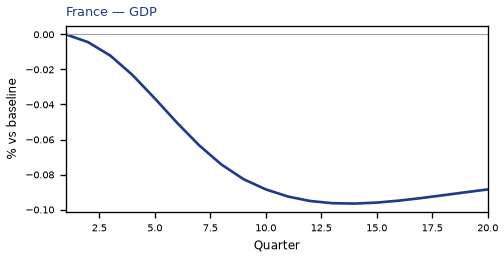
By Q20, GDP is still -0.10% from baseline.
These figures are model IRFs versus baseline, not forecasts and not financial advice.
global_macro_v64 · contract v6.4 · Q1–Q20 JSON · not financial advice
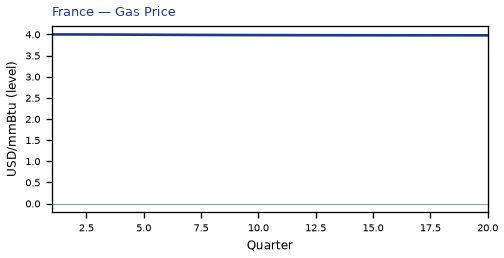
The main impact of a -25% United Kingdom housing shock on France is only a small drop in GDP of 0.10% by Q14. This is a model impulse response versus baseline, not a forecast. Equities soften 0.20% by Q13.
Demand and trade. Private investment falls 0.24% by Q12; government debt rises 0.08% by Q20; household consumption, the trade balance, government spending stay close to baseline.
Labour. Employment falls 0.10% by Q20; real wages fall 0.08% by Q20; unemployment rises by +0.07 percentage points in Q20.
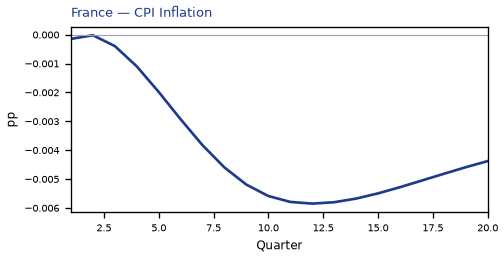
Prices. CPI inflation, domestic inflation, firms' marginal cost stay close to baseline.
Policy rates and the government curve. 30-year bond prices rally 0.28% by Q10; benchmark bond prices rally 0.16% by Q19; 10-year bond prices rally 0.15% by Q11; 5-year bond prices rally 0.10% by Q13; the rest of the government curve barely moves.
Exchange rates. The home currency is stronger versus the dollar (-0.08% in Q15); the real exchange rate, the nominal effective exchange rate (increase = trade-weighted appreciation) stay close to baseline.
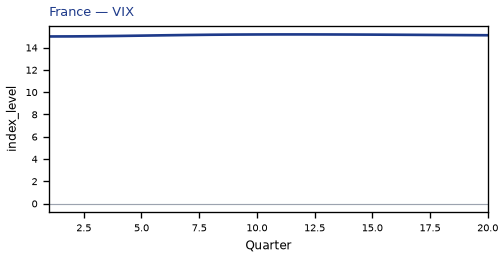
Equities and risk. Equity prices fall 0.20% by Q13; Tobin's Q (the value of installed capital) falls 0.17% by Q12; the VIX (global equity-implied volatility) stays close to baseline.
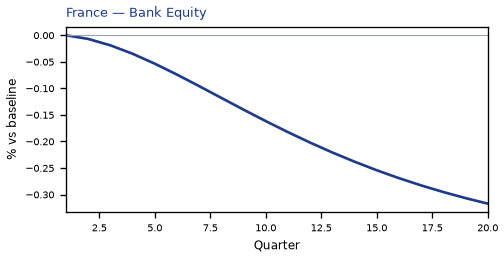
Housing and credit. Bank equity falls 0.32% by Q20; bank credit supply falls 0.25% by Q20; house prices fall 0.11% by Q20.
Commodities. Other published commodity prices stay within 3% of their baselines.
Sectors and capital. Manufacturing output, services output, the capital stock stay close to baseline.
By Q20, GDP is still -0.09% from baseline.
These figures are model IRFs versus baseline, not forecasts and not financial advice.
global_macro_v64 · contract v6.4 · Q1–Q20 JSON · not financial advice
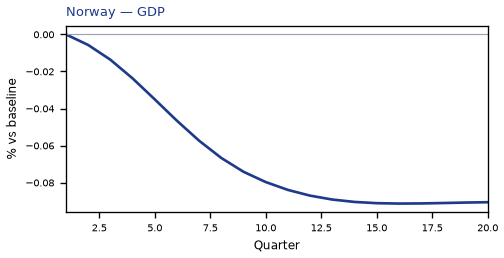
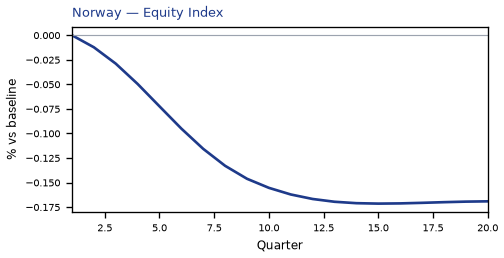
The main impact of a -25% United Kingdom housing shock on Norway is only a small drop in GDP of 0.09% by Q16. This is a model impulse response versus baseline, not a forecast. Equities soften 0.17% by Q15.
Demand and trade. Private investment falls 0.19% by Q12; household consumption, the trade balance, government spending, government debt stay close to baseline.
Labour. Employment falls 0.10% by Q20; real wages fall 0.08% by Q20; unemployment rises by +0.07 percentage points in Q20.
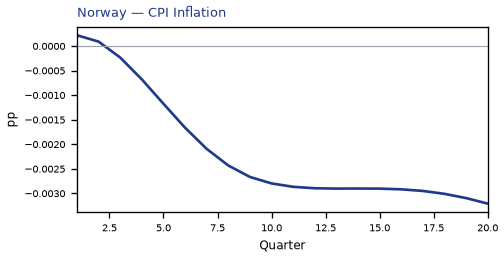
Prices. CPI inflation, domestic inflation, firms' marginal cost stay close to baseline.
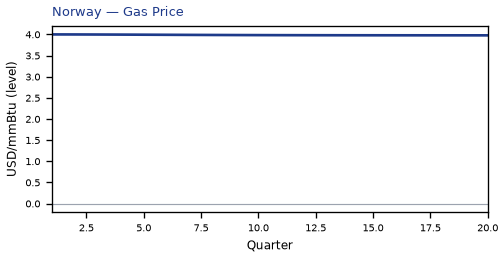
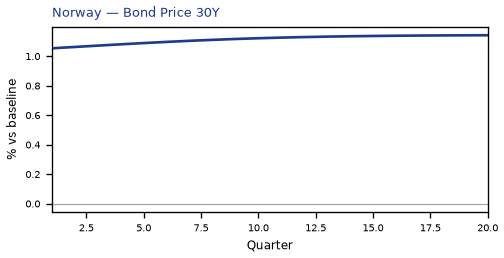
Policy rates and the government curve. 30-year bond prices rally 1.14% by Q20; 10-year bond prices rally 0.54% by Q20; benchmark bond prices rally 0.36% by Q20; 5-year bond prices rally 0.29% by Q20; related moves also show up in 2-year bond prices, 10-year government yields, 5-year government yields; the rest of the government curve barely moves.
Exchange rates. The NEER prints a trade-weighted depreciation (-0.18% in Q20); the real exchange rate shows a real depreciation (a weaker, more competitive home currency), peaking at +0.17% in Q20; the home currency is weaker versus the dollar (+0.15% in Q20).
Equities and risk. Equity prices fall 0.17% by Q15; Tobin's Q (the value of installed capital) falls 0.13% by Q12; the VIX (global equity-implied volatility) stays close to baseline.
Housing and credit. Bank equity falls 0.17% by Q20; bank credit supply falls 0.14% by Q20; house prices fall 0.10% by Q20.
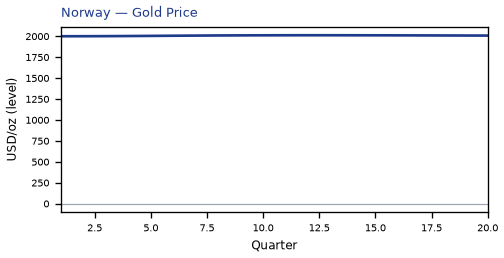
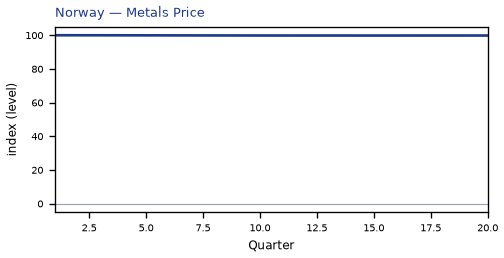
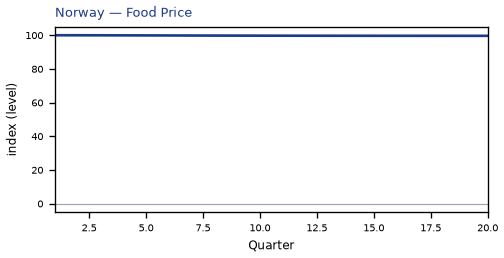
Commodities. Other published commodity prices stay within 3% of their baselines.
Sectors and capital. Manufacturing output, services output, the capital stock stay close to baseline.
By Q20, GDP is still -0.09% from baseline.
These figures are model IRFs versus baseline, not forecasts and not financial advice.
global_macro_v64 · contract v6.4 · Q1–Q20 JSON · not financial advice
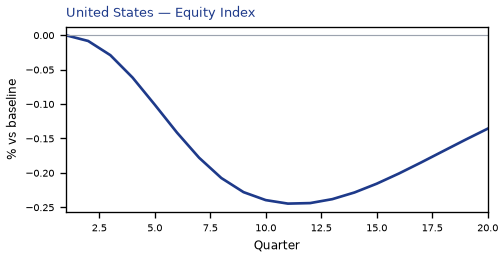
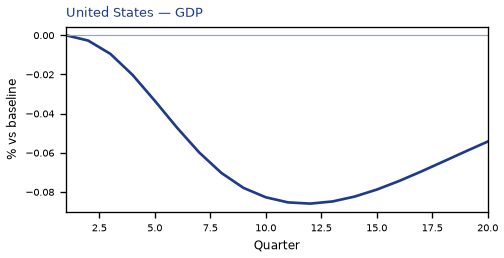
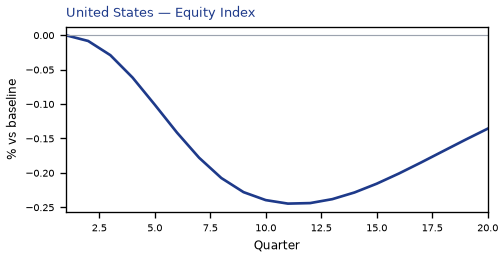
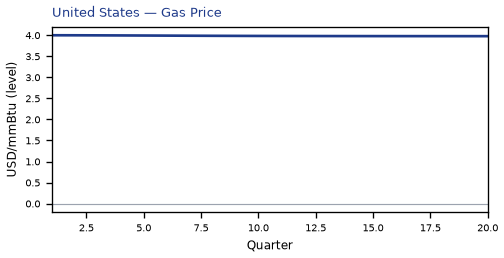
The main impact of a -25% United Kingdom housing shock on the United States is only a small drop in GDP of 0.09% by Q12. This is a model impulse response versus baseline, not a forecast. Equities soften 0.24% by Q11.
Demand and trade. Private investment falls 0.16% by Q9; household consumption, the trade balance, government spending, government debt stay close to baseline.
Labour. Real wages fall 0.10% by Q20; employment falls 0.09% by Q15; unemployment rises by +0.06 percentage points in Q16.
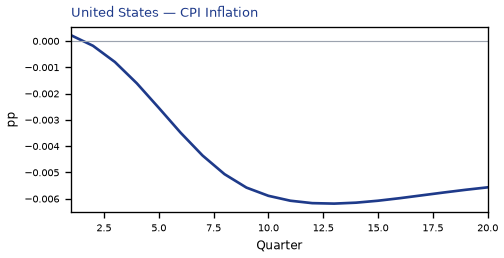
Prices. CPI inflation, domestic inflation, firms' marginal cost stay close to baseline.
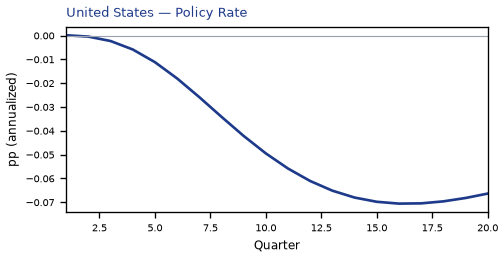
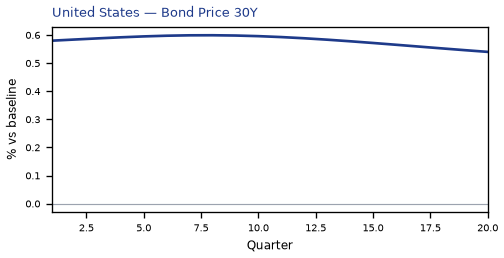
Policy rates and the government curve. 30-year bond prices rally 0.60% by Q8; benchmark bond prices rally 0.46% by Q16; 10-year bond prices rally 0.37% by Q8; 5-year bond prices rally 0.27% by Q10; related moves also show up in 2-year bond prices, the local policy rate, 3-month government yields; the rest of the government curve barely moves.
Exchange rates. The real exchange rate, the nominal effective exchange rate (increase = trade-weighted appreciation) stay close to baseline.
Equities and risk. Equity prices fall 0.24% by Q11; Tobin's Q (the value of installed capital) falls 0.11% by Q9; the VIX (global equity-implied volatility) stays close to baseline.
Housing and credit. Bank equity falls 0.34% by Q20; bank credit supply falls 0.28% by Q20; house prices are close to unchanged.
Commodities. Other published commodity prices stay within 3% of their baselines.
Sectors and capital. Manufacturing output, services output, the capital stock stay close to baseline.
By Q20, GDP is still -0.05% from baseline.
These figures are model IRFs versus baseline, not forecasts and not financial advice.
global_macro_v64 · contract v6.4 · Q1–Q20 JSON · not financial advice
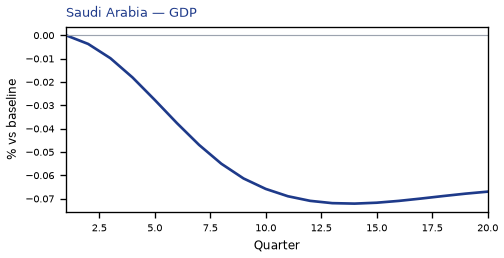
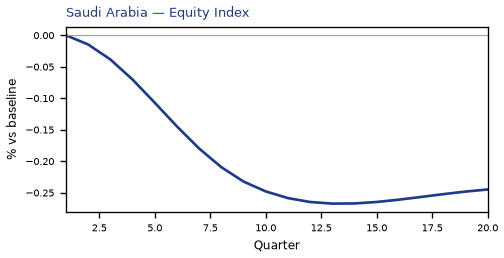
The main impact of a -25% United Kingdom housing shock on Saudi Arabia is only a small drop in GDP of 0.07% by Q14. This is a model impulse response versus baseline, not a forecast. Equities soften 0.27% by Q13.
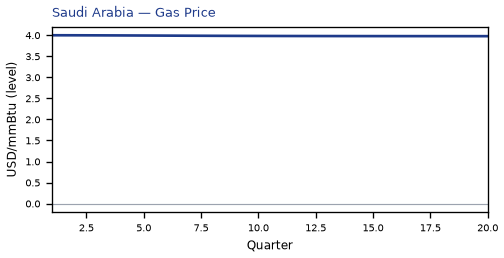
Demand and trade. Government debt falls 0.14% by Q20; private investment falls 0.11% by Q9; household consumption, the trade balance, government spending stay close to baseline.
Labour. Employment falls 0.08% by Q20; unemployment, real wages stay close to baseline.
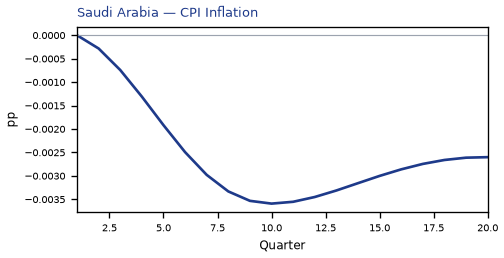
Prices. CPI inflation, domestic inflation, firms' marginal cost stay close to baseline.
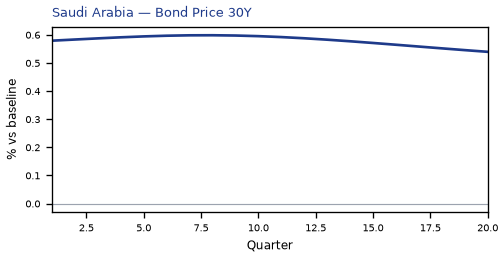
Policy rates and the government curve. 30-year bond prices rally 0.60% by Q8; 10-year bond prices rally 0.37% by Q8; benchmark bond prices rally 0.35% by Q16; 5-year bond prices rally 0.27% by Q10; related moves also show up in 2-year bond prices, the local policy rate, 3-month government yields; the rest of the government curve barely moves.
Exchange rates. The real exchange rate, the nominal effective exchange rate (increase = trade-weighted appreciation), the exchange rate versus the dollar (increase = home weaker vs USD) stay close to baseline.
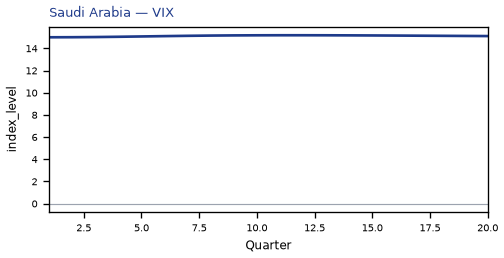
Equities and risk. Equity prices fall 0.27% by Q13; Tobin's Q (the value of installed capital) falls 0.08% by Q9; the VIX (global equity-implied volatility) stays close to baseline.
Housing and credit. Bank equity falls 0.09% by Q20; house prices fall 0.09% by Q20; bank credit is close to unchanged.
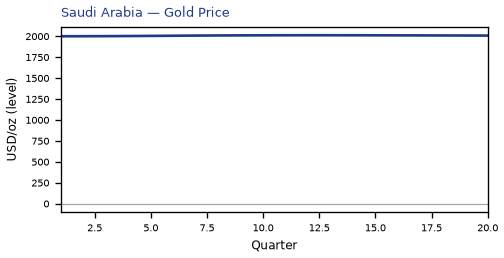
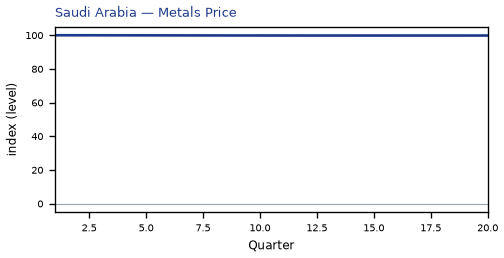
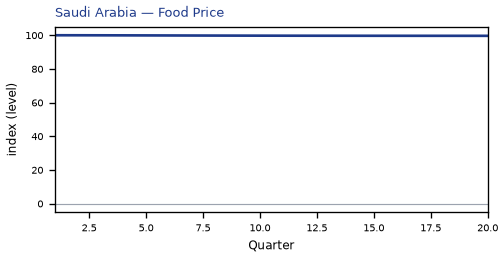
Commodities. Other published commodity prices stay within 3% of their baselines.
Sectors and capital. Manufacturing output, services output, the capital stock stay close to baseline.
By Q20, GDP is still -0.07% from baseline.
These figures are model IRFs versus baseline, not forecasts and not financial advice.
global_macro_v64 · contract v6.4 · Q1–Q20 JSON · not financial advice
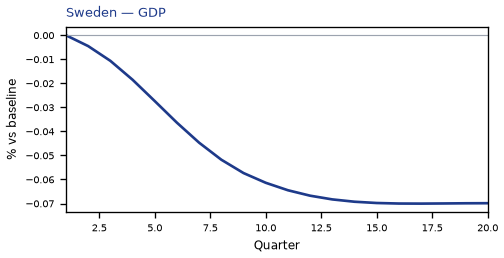
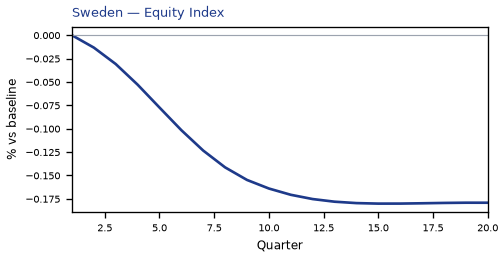
The main impact of a -25% United Kingdom housing shock on Sweden is only a small drop in GDP of 0.07% by Q17. This is a model impulse response versus baseline, not a forecast. Equities soften 0.18% by Q15.
Demand and trade. Private investment falls 0.16% by Q14; household consumption, the trade balance, government spending, government debt stay close to baseline.
Labour. Real wages fall 0.09% by Q20; unemployment rises by +0.05 percentage points in Q20; employment stays close to baseline.
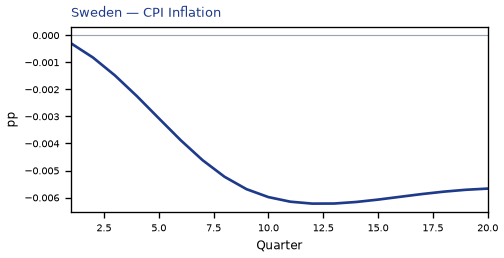
Prices. CPI inflation, domestic inflation, firms' marginal cost stay close to baseline.
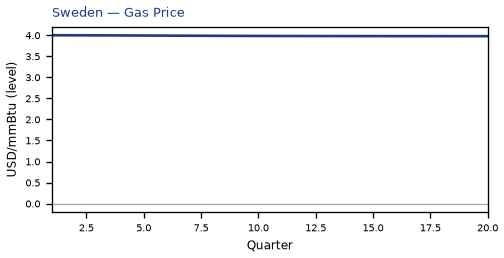
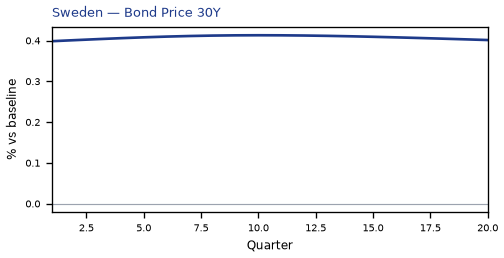
Policy rates and the government curve. 30-year bond prices rally 0.41% by Q10; 10-year bond prices rally 0.23% by Q16; benchmark bond prices rally 0.18% by Q20; 5-year bond prices rally 0.13% by Q18; the rest of the government curve barely moves.
Exchange rates. The home currency is stronger versus the dollar (-0.12% in Q17); the NEER prints a trade-weighted appreciation (+0.10% in Q20); the real exchange rate shows a real appreciation (a stronger home currency), peaking at -0.09% in Q20.
Equities and risk. Equity prices fall 0.18% by Q15; Tobin's Q (the value of installed capital) falls 0.11% by Q14; the VIX (global equity-implied volatility) stays close to baseline.
Housing and credit. Bank equity falls 0.16% by Q20; bank credit supply falls 0.13% by Q20; house prices fall 0.08% by Q20.
Commodities. Other published commodity prices stay within 3% of their baselines.
Sectors and capital. Manufacturing output, services output, the capital stock stay close to baseline.
By Q20, GDP is still -0.07% from baseline.
These figures are model IRFs versus baseline, not forecasts and not financial advice.
global_macro_v64 · contract v6.4 · Q1–Q20 JSON · not financial advice
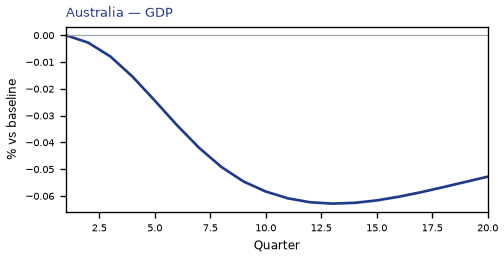
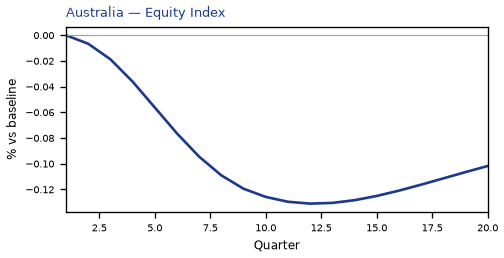
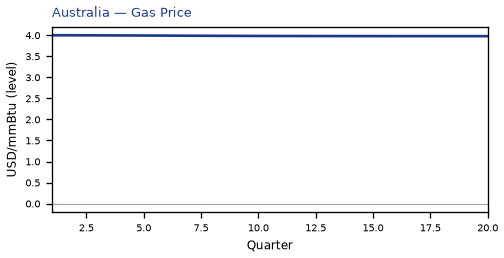
The main impact of a -25% United Kingdom housing shock on Australia is only a small drop in GDP of 0.06% by Q13. This is a model impulse response versus baseline, not a forecast. Equities soften 0.13% by Q12.
Demand and trade. Private investment falls 0.12% by Q11; household consumption, the trade balance, government spending, government debt stay close to baseline.
Labour. Employment, unemployment, real wages stay close to baseline.
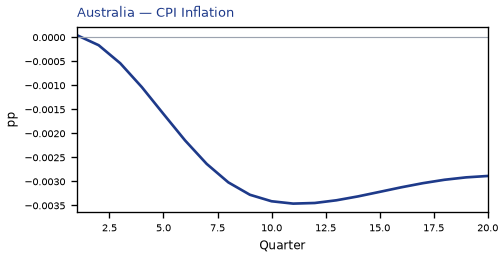
Prices. CPI inflation, domestic inflation, firms' marginal cost stay close to baseline.
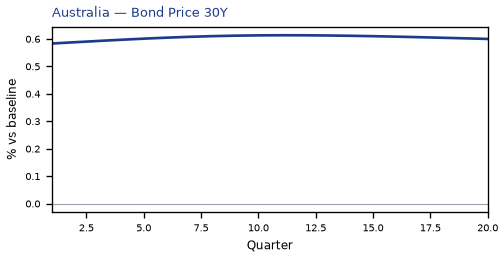
Policy rates and the government curve. 30-year bond prices rally 0.61% by Q11; 10-year bond prices rally 0.32% by Q12; benchmark bond prices rally 0.28% by Q19; 5-year bond prices rally 0.19% by Q13; related moves also show up in 2-year bond prices; the rest of the government curve barely moves.
Exchange rates. The NEER prints a trade-weighted depreciation (-0.14% in Q17); the real exchange rate shows a real depreciation (a weaker, more competitive home currency), peaking at +0.12% in Q15; the home currency is weaker versus the dollar (+0.09% in Q20).
Equities and risk. Equity prices fall 0.13% by Q12; Tobin's Q (the value of installed capital) falls 0.09% by Q11; the VIX (global equity-implied volatility) stays close to baseline.
Housing and credit. Bank equity falls 0.21% by Q20; bank credit supply falls 0.17% by Q20; house prices are close to unchanged.
Commodities. Other published commodity prices stay within 3% of their baselines.
Sectors and capital. Manufacturing output, services output, the capital stock stay close to baseline.
By Q20, GDP is still -0.05% from baseline.
These figures are model IRFs versus baseline, not forecasts and not financial advice.
global_macro_v64 · contract v6.4 · Q1–Q20 JSON · not financial advice
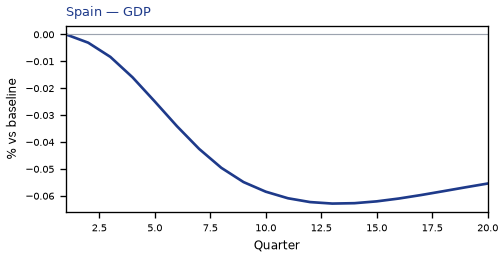
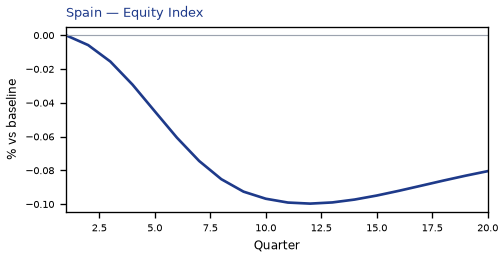
The main impact of a -25% United Kingdom housing shock on Spain is only a small drop in GDP of 0.06% by Q13. This is a model impulse response versus baseline, not a forecast. Equities soften 0.10% by Q12.
Demand and trade. Private investment falls 0.15% by Q12; household consumption, the trade balance, government spending, government debt stay close to baseline.
Labour. Employment, unemployment, real wages stay close to baseline.
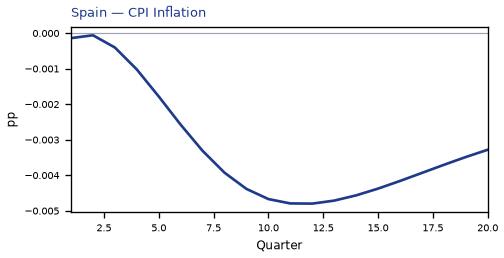
Prices. CPI inflation, domestic inflation, firms' marginal cost stay close to baseline.
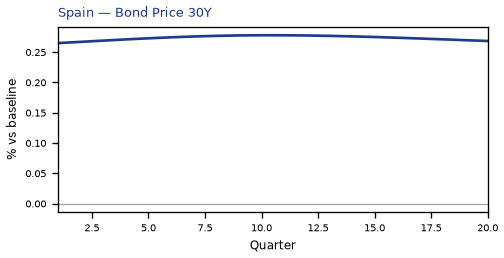
Policy rates and the government curve. 30-year bond prices rally 0.28% by Q10; benchmark bond prices rally 0.16% by Q19; 10-year bond prices rally 0.15% by Q11; 5-year bond prices rally 0.10% by Q13; the rest of the government curve barely moves.
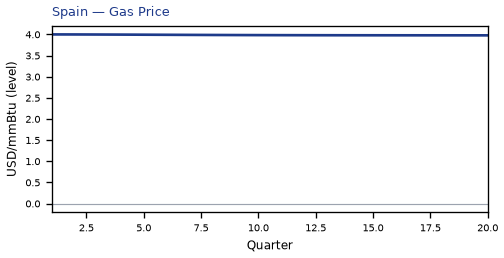
Exchange rates. The home currency is stronger versus the dollar (-0.09% in Q15); the real exchange rate, the nominal effective exchange rate (increase = trade-weighted appreciation) stay close to baseline.
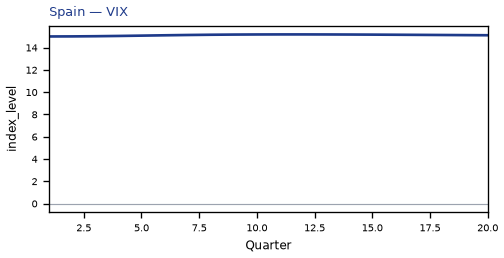
Equities and risk. Tobin's Q (the value of installed capital) falls 0.10% by Q12; equity prices fall 0.10% by Q12; the VIX (global equity-implied volatility) stays close to baseline.
Housing and credit. Bank equity falls 0.22% by Q20; bank credit supply falls 0.17% by Q20; house prices are close to unchanged.
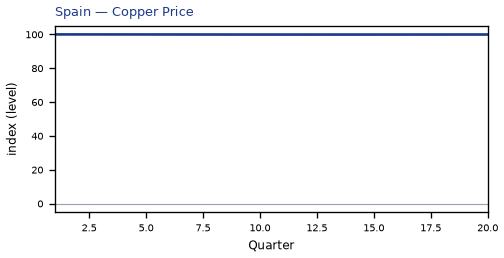
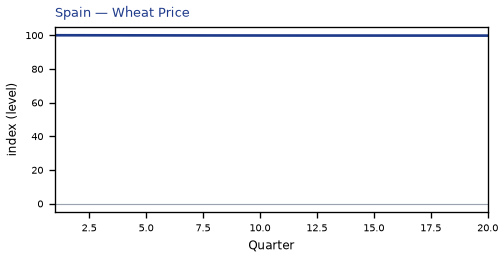
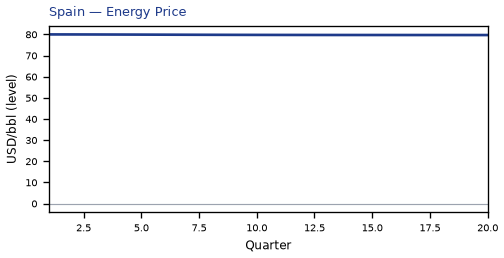
Commodities. Other published commodity prices stay within 3% of their baselines.
Sectors and capital. Manufacturing output, services output, the capital stock stay close to baseline.
By Q20, GDP is still -0.06% from baseline.
These figures are model IRFs versus baseline, not forecasts and not financial advice.
global_macro_v64 · contract v6.4 · Q1–Q20 JSON · not financial advice
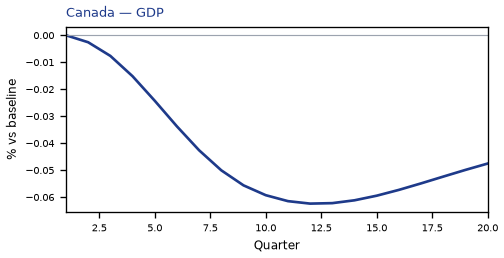
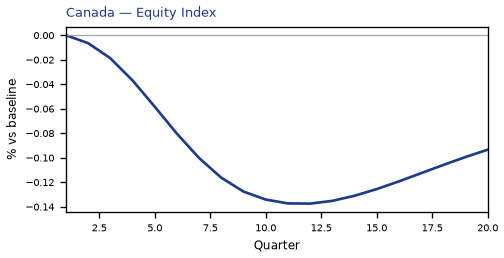
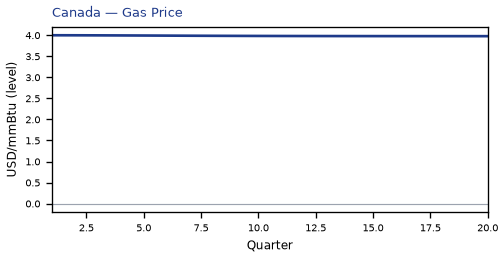
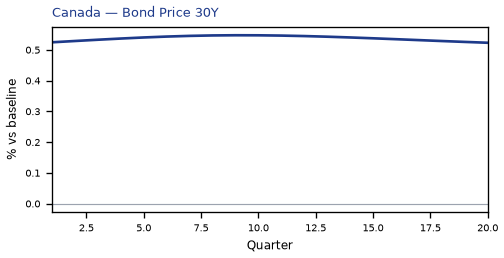
The main impact of a -25% United Kingdom housing shock on Canada is only a small drop in GDP of 0.06% by Q12. This is a model impulse response versus baseline, not a forecast. Equities soften 0.14% by Q12.
Demand and trade. Private investment falls 0.12% by Q10; household consumption, the trade balance, government spending, government debt stay close to baseline.
Labour. Employment, unemployment, real wages stay close to baseline.
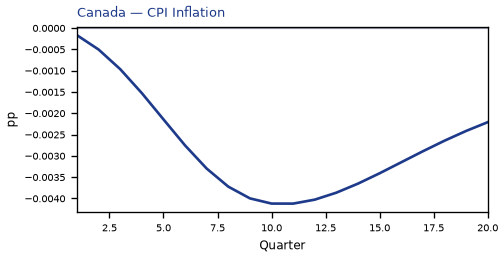
Prices. CPI inflation, domestic inflation, firms' marginal cost stay close to baseline.
Policy rates and the government curve. 30-year bond prices rally 0.55% by Q9; benchmark bond prices rally 0.29% by Q16; 10-year bond prices rally 0.28% by Q9; 5-year bond prices rally 0.19% by Q10; related moves also show up in 2-year bond prices; the rest of the government curve barely moves.
Exchange rates. The real exchange rate shows a real depreciation (a weaker, more competitive home currency), peaking at +0.10% in Q20; the NEER prints a trade-weighted depreciation (-0.10% in Q20); the home currency is weaker versus the dollar (+0.08% in Q20).
Equities and risk. Equity prices fall 0.14% by Q12; Tobin's Q (the value of installed capital) falls 0.08% by Q10; the VIX (global equity-implied volatility) stays close to baseline.
Housing and credit. Bank equity falls 0.16% by Q20; bank credit supply falls 0.13% by Q20; house prices are close to unchanged.
Commodities. Other published commodity prices stay within 3% of their baselines.
Sectors and capital. Manufacturing output, services output, the capital stock stay close to baseline.
By Q20, GDP is still -0.05% from baseline.
These figures are model IRFs versus baseline, not forecasts and not financial advice.
global_macro_v64 · contract v6.4 · Q1–Q20 JSON · not financial advice
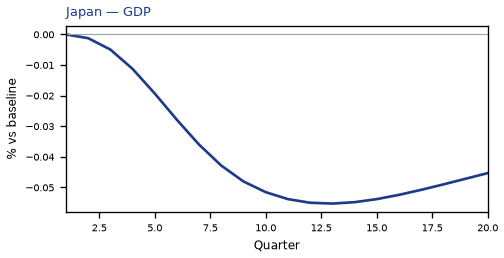
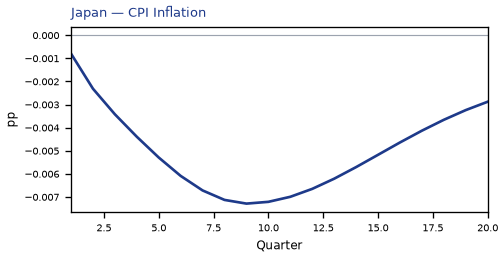
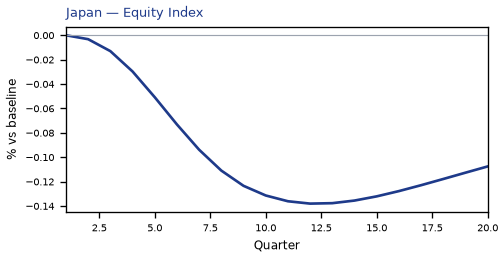
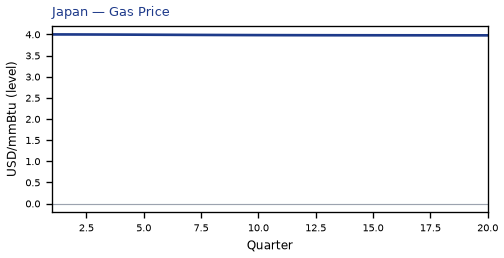
The main impact of a -25% United Kingdom housing shock on Japan is only a small drop in GDP of 0.06% by Q13. This is a model impulse response versus baseline, not a forecast. Equities soften 0.14% by Q12. The three-year CPI impulse is -0.06 percentage points.
Demand and trade. Private investment falls 0.15% by Q12; household consumption, the trade balance, government spending, government debt stay close to baseline.
Labour. Employment, unemployment, real wages stay close to baseline.
Prices. CPI inflation, domestic inflation, firms' marginal cost stay close to baseline.
Policy rates and the government curve. Benchmark bond prices rally 0.11% by Q19; 30-year bond prices rally 0.10% by Q9; the rest of the government curve barely moves.
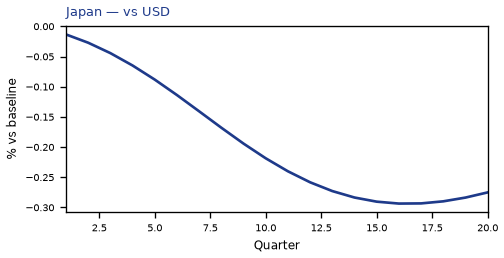
Exchange rates. The home currency is stronger versus the dollar (-0.29% in Q16); the NEER prints a trade-weighted appreciation (+0.26% in Q20); the real exchange rate shows a real appreciation (a stronger home currency), peaking at -0.25% in Q20.
Equities and risk. Equity prices fall 0.14% by Q12; Tobin's Q (the value of installed capital) falls 0.10% by Q12; the VIX (global equity-implied volatility) stays close to baseline.
Housing and credit. Bank equity falls 0.22% by Q20; bank credit supply falls 0.18% by Q20; house prices are close to unchanged.
Commodities. Other published commodity prices stay within 3% of their baselines.
Sectors and capital. Manufacturing output, services output, the capital stock stay close to baseline.
By Q20, GDP is still -0.05% from baseline.
These figures are model IRFs versus baseline, not forecasts and not financial advice.
global_macro_v64 · contract v6.4 · Q1–Q20 JSON · not financial advice
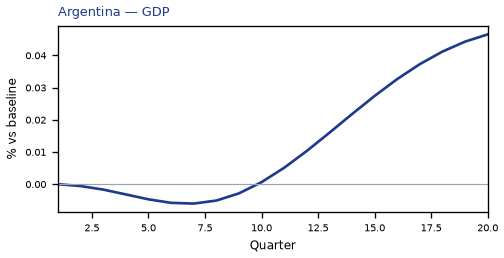
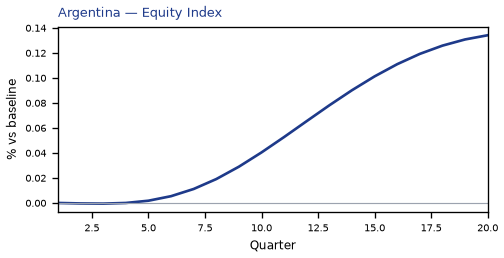
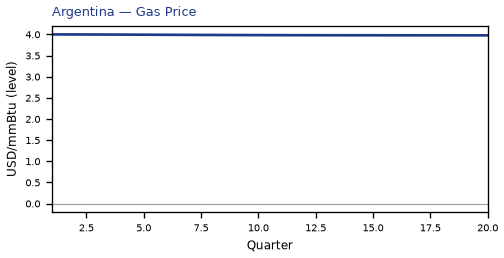
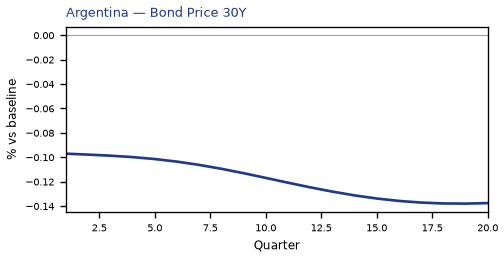
The main impact of a -25% United Kingdom housing shock on Argentina is only a small rise in GDP of 0.05% by Q20. This is a model impulse response versus baseline, not a forecast. Equities firm 0.13% by Q20.
Demand and trade. Private investment rises 0.12% by Q20; household consumption, the trade balance, government spending, government debt stay close to baseline.
Labour. Employment, unemployment, real wages stay close to baseline.
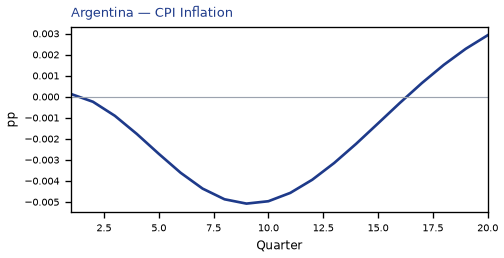
Prices. CPI inflation, domestic inflation, firms' marginal cost stay close to baseline.
Policy rates and the government curve. 30-year bond prices cheapen 0.14% by Q19; 10-year bond prices cheapen 0.10% by Q19; the rest of the government curve barely moves.
Exchange rates. The home currency is stronger versus the dollar (-0.10% in Q16); the real exchange rate, the nominal effective exchange rate (increase = trade-weighted appreciation) stay close to baseline.
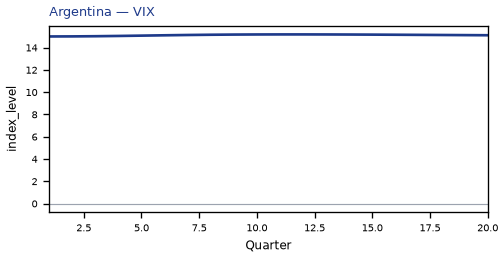
Equities and risk. Equity prices rise 0.13% by Q20; Tobin's Q (the value of installed capital) rises 0.08% by Q20; the VIX (global equity-implied volatility) stays close to baseline.
Housing and credit. House prices and bank credit are close to unchanged.
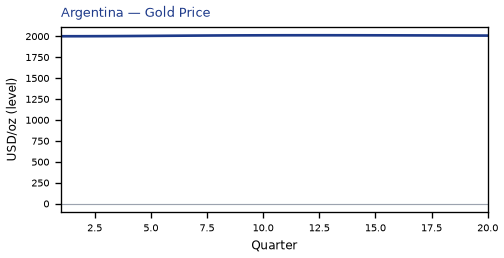
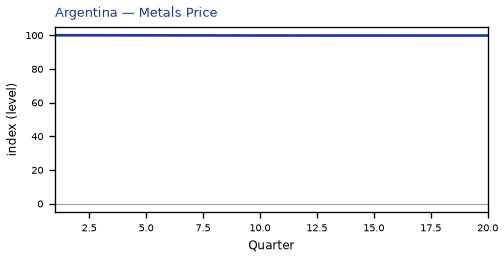
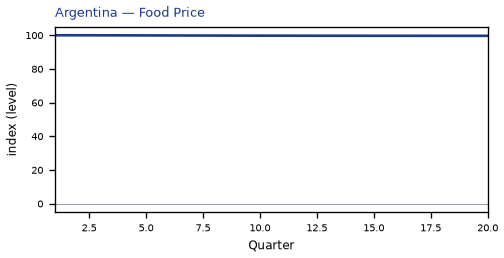
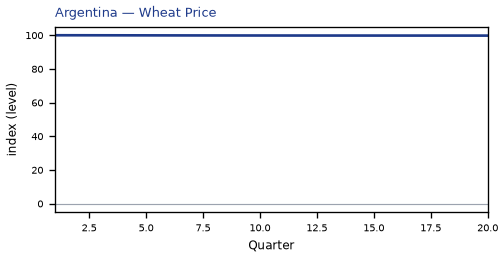
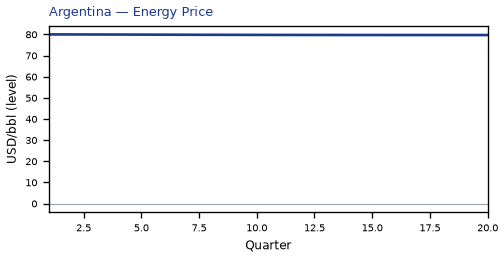
Commodities. Other published commodity prices stay within 3% of their baselines.
Sectors and capital. Manufacturing output, services output, the capital stock stay close to baseline.
By Q20, GDP is still +0.05% from baseline.
These figures are model IRFs versus baseline, not forecasts and not financial advice.
global_macro_v64 · contract v6.4 · Q1–Q20 JSON · not financial advice
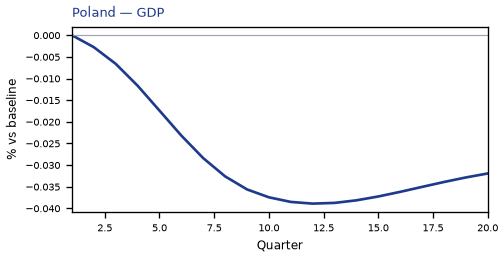
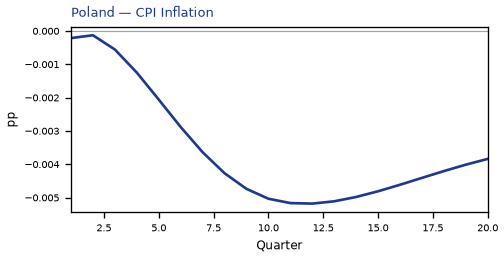
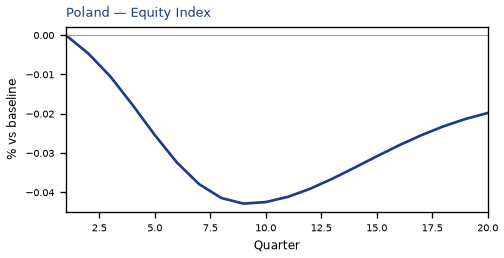
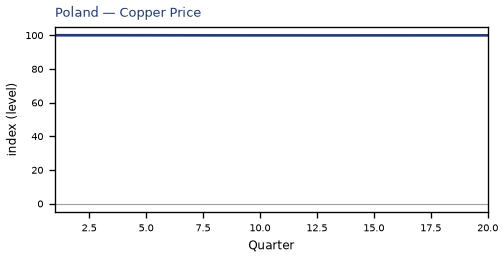
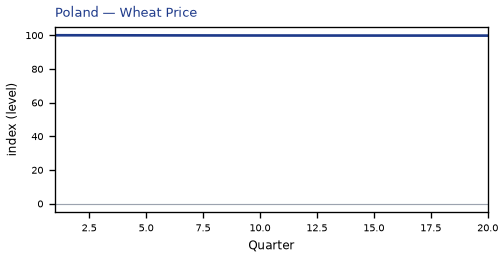
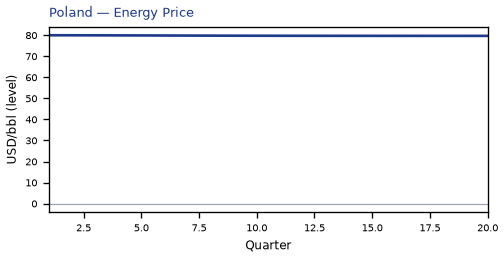
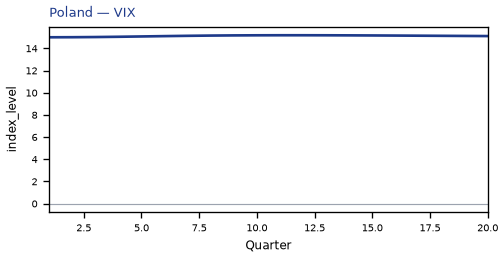
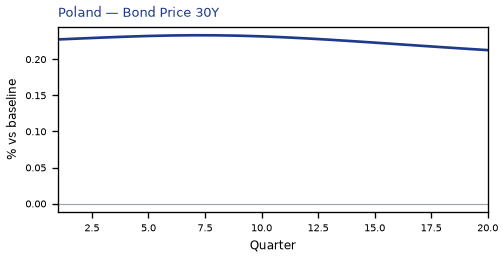
The main impact of a -25% United Kingdom housing shock on Poland is a negligible drop in GDP of 0.04% by Q12. This is a model impulse response versus baseline, not a forecast. This has almost no impact on Poland.
global_macro_v64 · contract v6.4 · Q1–Q20 JSON · not financial advice
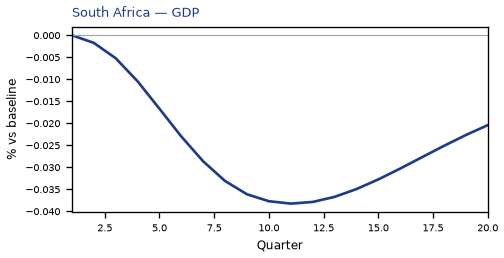
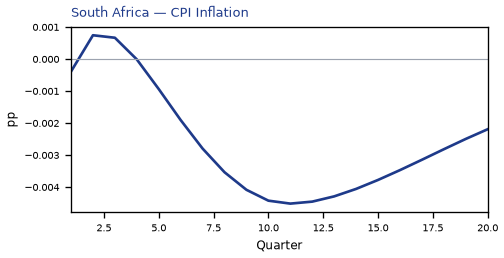
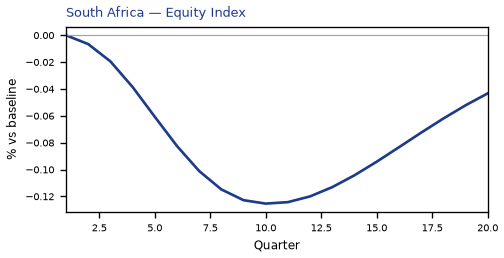
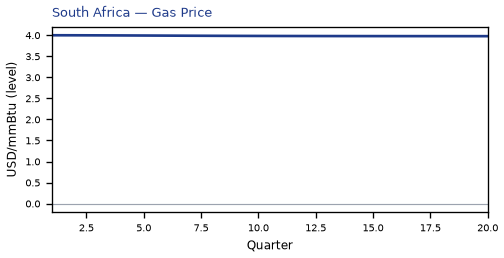
The main impact of a -25% United Kingdom housing shock on South Africa is only a small drop in GDP of 0.04% by Q11. This is a model impulse response versus baseline, not a forecast. Equities soften 0.13% by Q10.
Demand and trade. Private investment falls 0.08% by Q9; household consumption, the trade balance, government spending, government debt stay close to baseline.
Labour. Employment, unemployment, real wages stay close to baseline.
Prices. CPI inflation, domestic inflation, firms' marginal cost stay close to baseline.
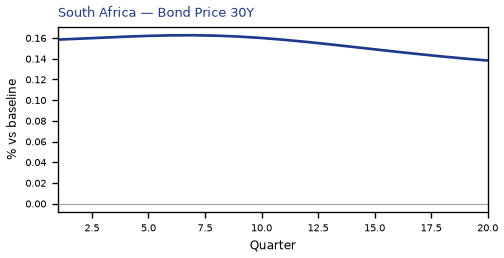
Policy rates and the government curve. 30-year bond prices rally 0.16% by Q7; 10-year bond prices rally 0.10% by Q7; benchmark bond prices rally 0.09% by Q14; the rest of the government curve barely moves.
Exchange rates. The real exchange rate, the nominal effective exchange rate (increase = trade-weighted appreciation), the exchange rate versus the dollar (increase = home weaker vs USD) stay close to baseline.
Equities and risk. Equity prices fall 0.13% by Q10; the VIX (global equity-implied volatility), Tobin's Q (the value of installed capital) stay close to baseline.
Housing and credit. Bank equity falls 0.14% by Q20; bank credit supply falls 0.12% by Q20; house prices are close to unchanged.
Commodities. Other published commodity prices stay within 3% of their baselines.
Sectors and capital. Manufacturing output, services output, the capital stock stay close to baseline.
By Q20, GDP is still -0.02% from baseline.
These figures are model IRFs versus baseline, not forecasts and not financial advice.
global_macro_v64 · contract v6.4 · Q1–Q20 JSON · not financial advice
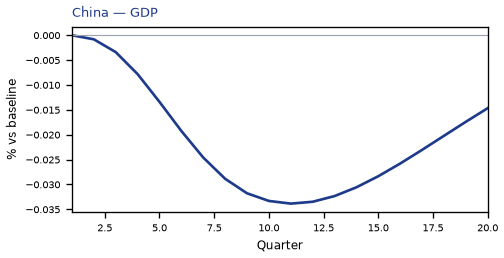
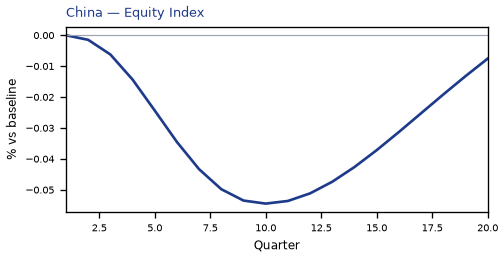
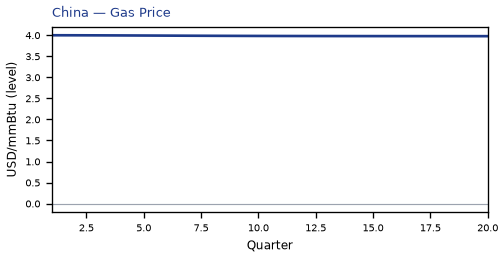
The main impact of a -25% United Kingdom housing shock on China is only a small drop in GDP of 0.03% by Q11. This is a model impulse response versus baseline, not a forecast.
Demand and trade. Household consumption, private investment, the trade balance, government spending stay close to baseline.
Labour. Employment, unemployment, real wages stay close to baseline.
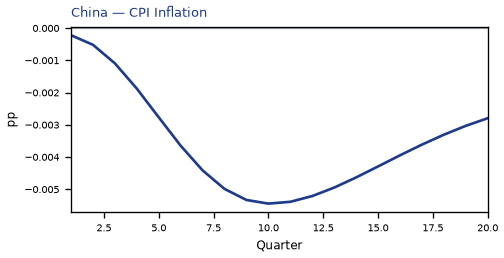
Prices. CPI inflation, domestic inflation, firms' marginal cost stay close to baseline.
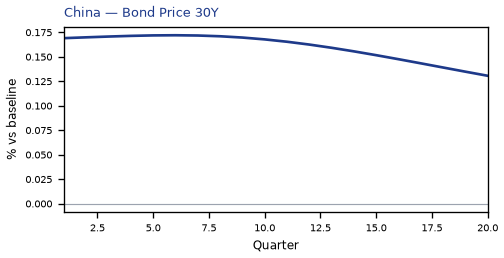
Policy rates and the government curve. 30-year bond prices rally 0.17% by Q6; benchmark bond prices rally 0.17% by Q17; 10-year bond prices rally 0.16% by Q5; 5-year bond prices rally 0.13% by Q10; the rest of the government curve barely moves.
Exchange rates. The real exchange rate, the nominal effective exchange rate (increase = trade-weighted appreciation), the exchange rate versus the dollar (increase = home weaker vs USD) stay close to baseline.
Equities and risk. Equity prices, the VIX (global equity-implied volatility), Tobin's Q (the value of installed capital) stay close to baseline.
Housing and credit. House prices and bank credit are close to unchanged.
Commodities. Other published commodity prices stay within 3% of their baselines.
Sectors and capital. Manufacturing output, services output, the capital stock stay close to baseline.
By Q20, GDP is still -0.01% from baseline.
These figures are model IRFs versus baseline, not forecasts and not financial advice.
global_macro_v64 · contract v6.4 · Q1–Q20 JSON · not financial advice
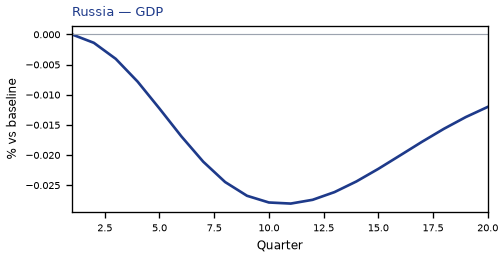
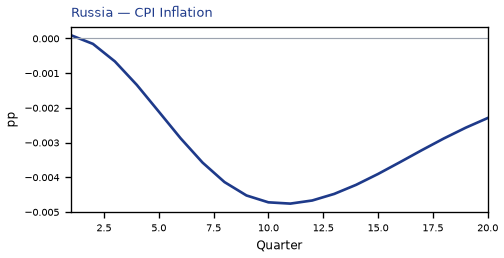
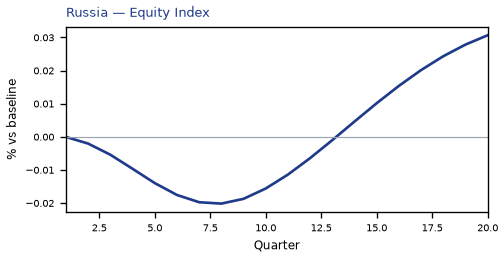
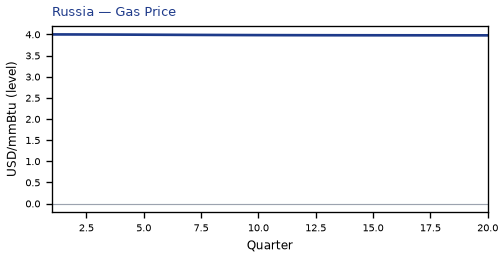
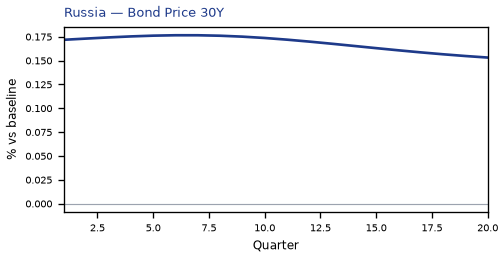
The main impact of a -25% United Kingdom housing shock on Russia is a negligible drop in GDP of 0.03% by Q11. This is a model impulse response versus baseline, not a forecast. This has almost no impact on Russia.
global_macro_v64 · contract v6.4 · Q1–Q20 JSON · not financial advice
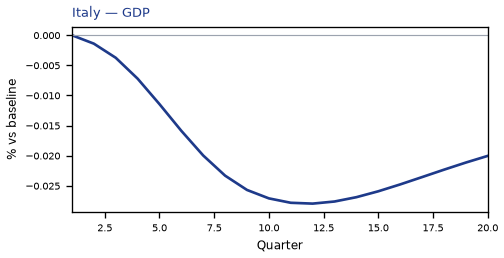
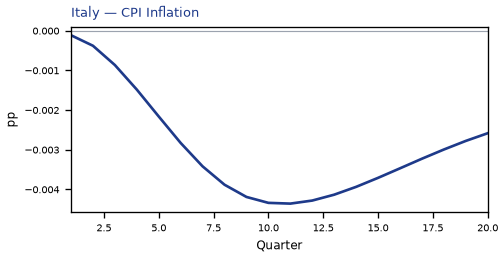
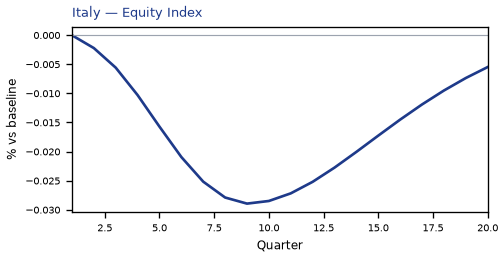
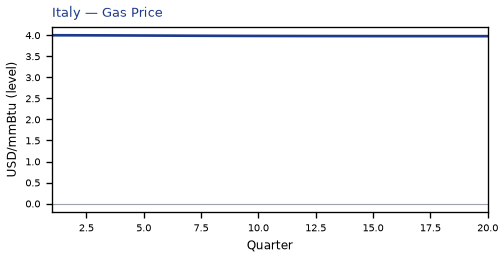
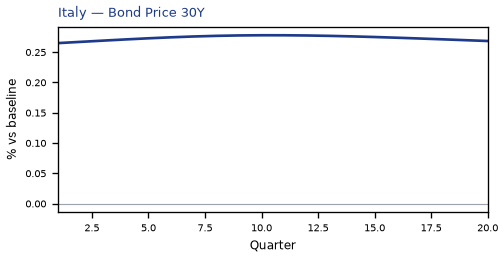
The main impact of a -25% United Kingdom housing shock on Italy is a negligible drop in GDP of 0.03% by Q12. This is a model impulse response versus baseline, not a forecast. This has almost no impact on Italy.
global_macro_v64 · contract v6.4 · Q1–Q20 JSON · not financial advice
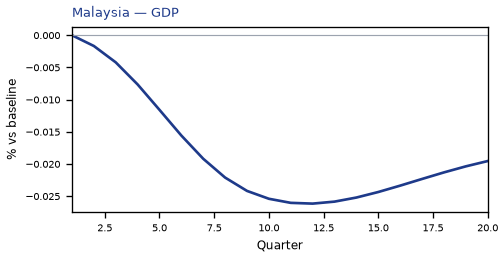
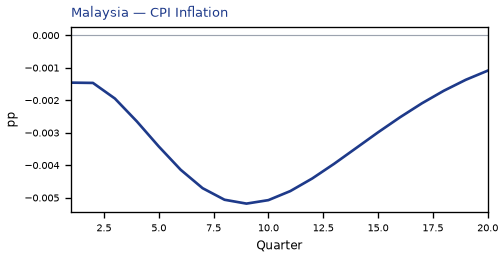
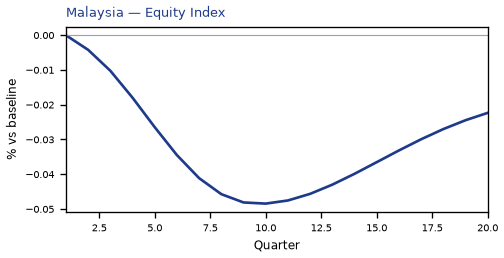
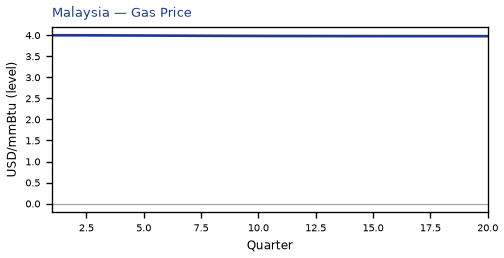
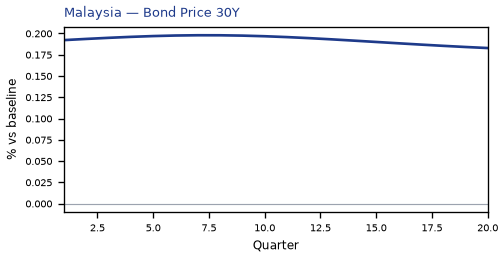
The main impact of a -25% United Kingdom housing shock on Malaysia is a negligible drop in GDP of 0.03% by Q12. This is a model impulse response versus baseline, not a forecast. This has almost no impact on Malaysia.
global_macro_v64 · contract v6.4 · Q1–Q20 JSON · not financial advice
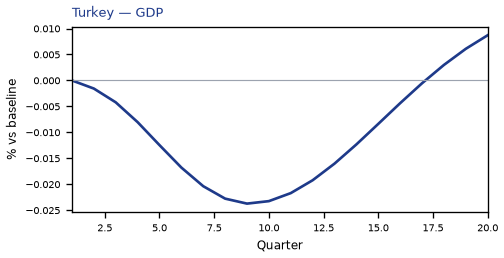
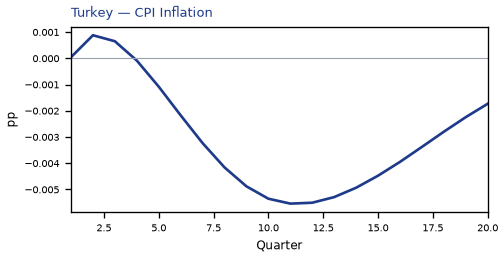
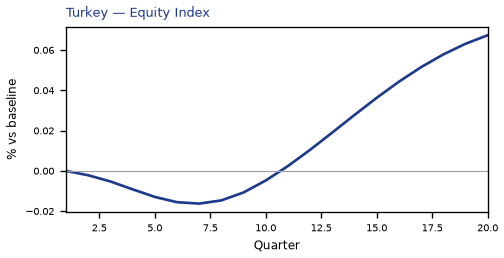
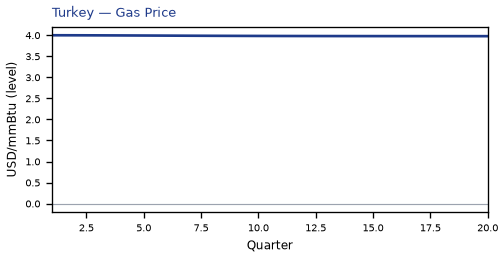
The main impact of a -25% United Kingdom housing shock on Turkey is only a small drop in GDP of 0.02% by Q9. This is a model impulse response versus baseline, not a forecast.
Demand and trade. Household consumption, private investment, the trade balance, government spending stay close to baseline.
Labour. Employment, unemployment, real wages stay close to baseline.
Prices. CPI inflation, domestic inflation, firms' marginal cost stay close to baseline.
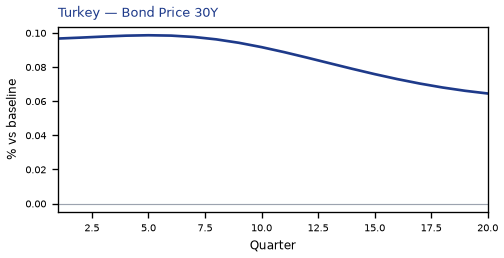
Policy rates and the government curve. 30-year bond prices rally 0.10% by Q5; the rest of the government curve barely moves.
Exchange rates. The real exchange rate, the nominal effective exchange rate (increase = trade-weighted appreciation), the exchange rate versus the dollar (increase = home weaker vs USD) stay close to baseline.
Equities and risk. Equity prices, the VIX (global equity-implied volatility), Tobin's Q (the value of installed capital) stay close to baseline.
Housing and credit. House prices and bank credit are close to unchanged.
Commodities. Other published commodity prices stay within 3% of their baselines.
Sectors and capital. Manufacturing output, services output, the capital stock stay close to baseline.
The GDP response has mostly faded by Q16 (Q20 is still +0.01%).
These figures are model IRFs versus baseline, not forecasts and not financial advice.
global_macro_v64 · contract v6.4 · Q1–Q20 JSON · not financial advice
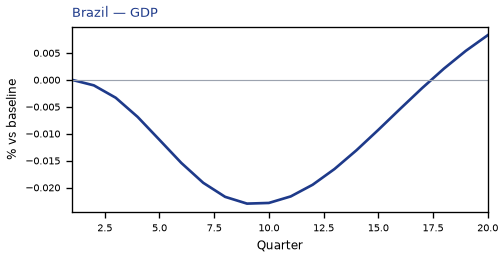
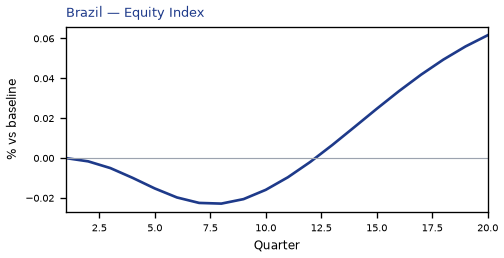
The main impact of a -25% United Kingdom housing shock on Brazil is only a small drop in GDP of 0.02% by Q9. This is a model impulse response versus baseline, not a forecast.
Demand and trade. Household consumption, private investment, the trade balance, government spending stay close to baseline.
Labour. Employment, unemployment, real wages stay close to baseline.
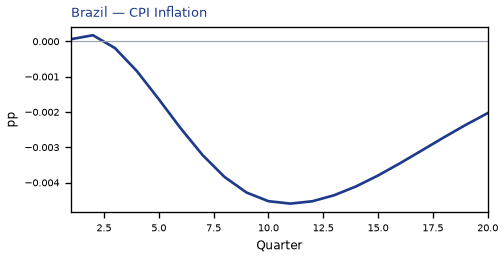
Prices. CPI inflation, domestic inflation, firms' marginal cost stay close to baseline.
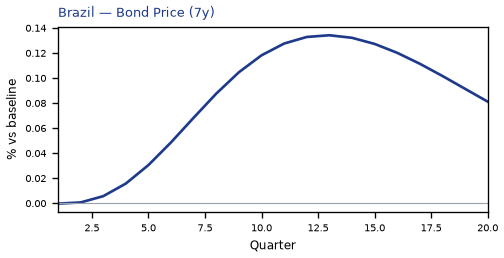
Policy rates and the government curve. Benchmark bond prices rally 0.13% by Q13; 30-year bond prices rally 0.11% by Q5; 5-year bond prices rally 0.10% by Q6; 10-year bond prices rally 0.10% by Q1; the rest of the government curve barely moves.
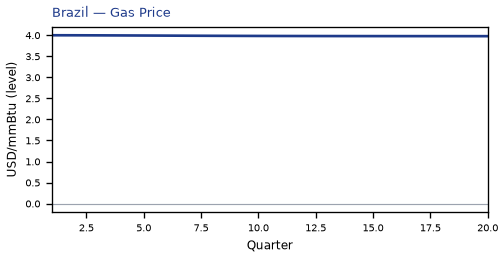
Exchange rates. The real exchange rate, the nominal effective exchange rate (increase = trade-weighted appreciation), the exchange rate versus the dollar (increase = home weaker vs USD) stay close to baseline.
Equities and risk. Equity prices, the VIX (global equity-implied volatility), Tobin's Q (the value of installed capital) stay close to baseline.
Housing and credit. House prices and bank credit are close to unchanged.
Commodities. Other published commodity prices stay within 3% of their baselines.
Sectors and capital. Manufacturing output, services output, the capital stock stay close to baseline.
The GDP response has mostly faded by Q16 (Q20 is still +0.01%).
These figures are model IRFs versus baseline, not forecasts and not financial advice.
global_macro_v64 · contract v6.4 · Q1–Q20 JSON · not financial advice
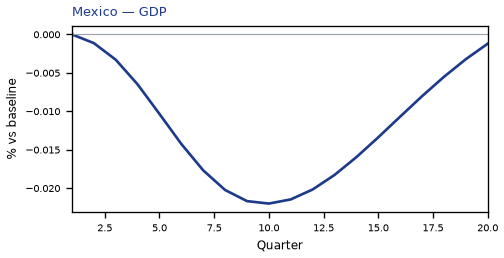
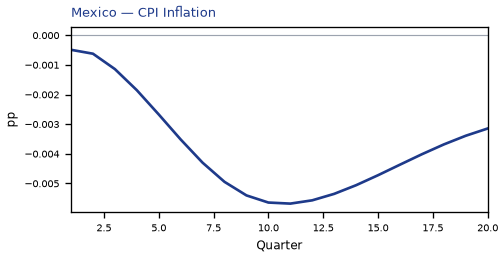
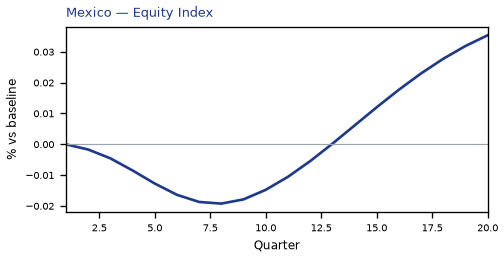
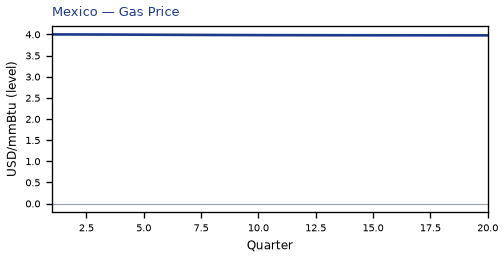
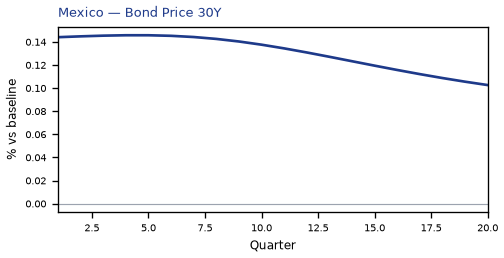
The main impact of a -25% United Kingdom housing shock on Mexico is a negligible drop in GDP of 0.02% by Q10. This is a model impulse response versus baseline, not a forecast. This has almost no impact on Mexico.
global_macro_v64 · contract v6.4 · Q1–Q20 JSON · not financial advice
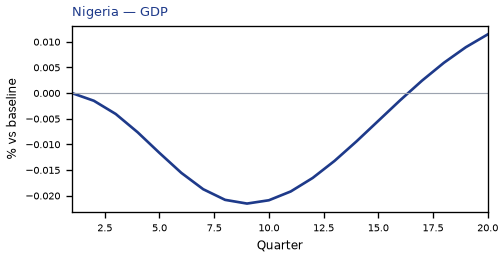
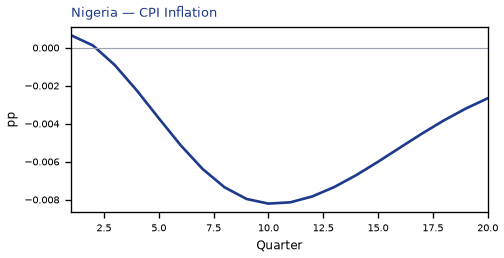
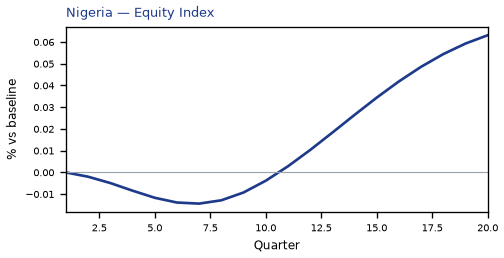
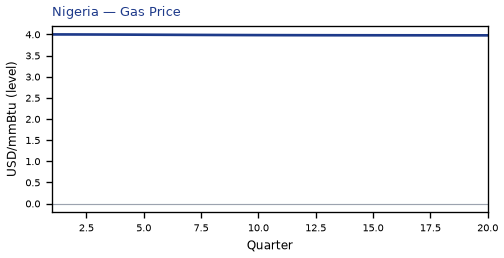
The main impact of a -25% United Kingdom housing shock on Nigeria is only a small drop in GDP of 0.02% by Q9. This is a model impulse response versus baseline, not a forecast. The three-year CPI impulse is -0.06 percentage points.
Demand and trade. Household consumption, private investment, the trade balance, government spending stay close to baseline.
Labour. Employment, unemployment, real wages stay close to baseline.
Prices. CPI inflation, domestic inflation, firms' marginal cost stay close to baseline.
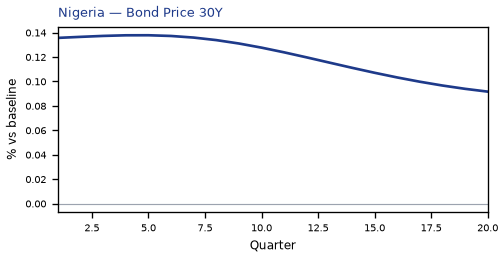
Policy rates and the government curve. 30-year bond prices rally 0.14% by Q5; 10-year bond prices rally 0.11% by Q4; 5-year bond prices rally 0.10% by Q5; benchmark bond prices rally 0.08% by Q12; the rest of the government curve barely moves.
Exchange rates. The real exchange rate, the nominal effective exchange rate (increase = trade-weighted appreciation), the exchange rate versus the dollar (increase = home weaker vs USD) stay close to baseline.
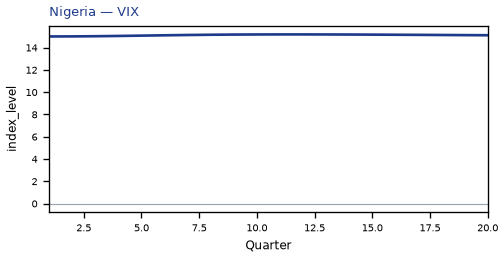
Equities and risk. Equity prices, the VIX (global equity-implied volatility), Tobin's Q (the value of installed capital) stay close to baseline.
Housing and credit. House prices and bank credit are close to unchanged.
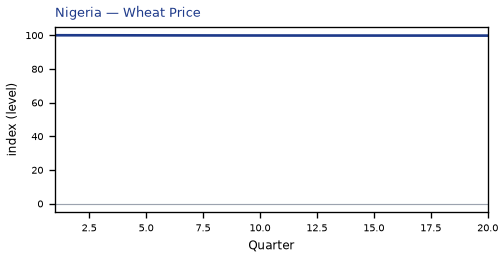
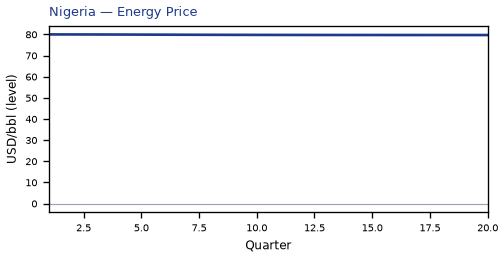
Commodities. Other published commodity prices stay within 3% of their baselines.
Sectors and capital. Manufacturing output, services output, the capital stock stay close to baseline.
By Q20, GDP is still +0.01% from baseline.
These figures are model IRFs versus baseline, not forecasts and not financial advice.
global_macro_v64 · contract v6.4 · Q1–Q20 JSON · not financial advice
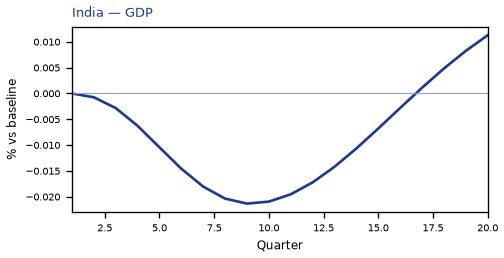
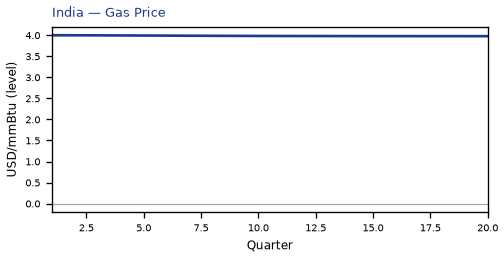
The main impact of a -25% United Kingdom housing shock on India is only a small drop in GDP of 0.02% by Q9. This is a model impulse response versus baseline, not a forecast.
Demand and trade. Household consumption, private investment, the trade balance, government spending stay close to baseline.
Labour. Employment, unemployment, real wages stay close to baseline.
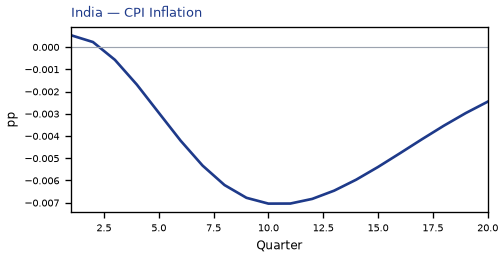
Prices. CPI inflation, domestic inflation, firms' marginal cost stay close to baseline.
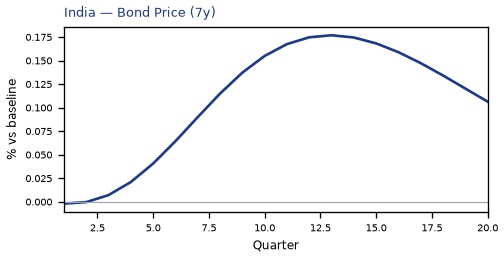
Policy rates and the government curve. Benchmark bond prices rally 0.18% by Q13; 5-year bond prices rally 0.11% by Q6; 10-year bond prices rally 0.10% by Q1; 30-year bond prices rally 0.09% by Q4; the rest of the government curve barely moves.
Exchange rates. The real exchange rate, the nominal effective exchange rate (increase = trade-weighted appreciation), the exchange rate versus the dollar (increase = home weaker vs USD) stay close to baseline.
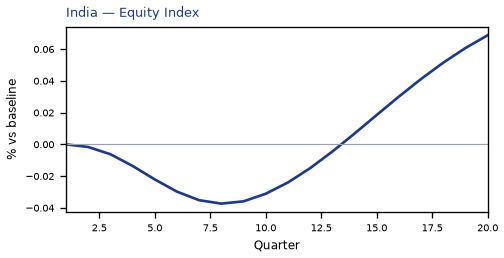
Equities and risk. Equity prices, the VIX (global equity-implied volatility), Tobin's Q (the value of installed capital) stay close to baseline.
Housing and credit. House prices and bank credit are close to unchanged.
Commodities. Other published commodity prices stay within 3% of their baselines.
Sectors and capital. Manufacturing output, services output, the capital stock stay close to baseline.
By Q20, GDP is still +0.01% from baseline.
These figures are model IRFs versus baseline, not forecasts and not financial advice.
global_macro_v64 · contract v6.4 · Q1–Q20 JSON · not financial advice
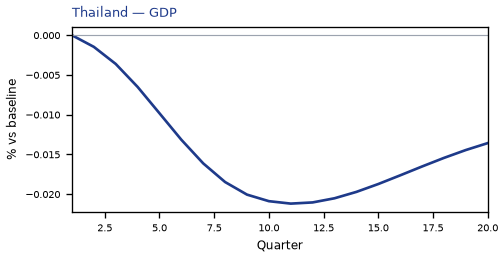
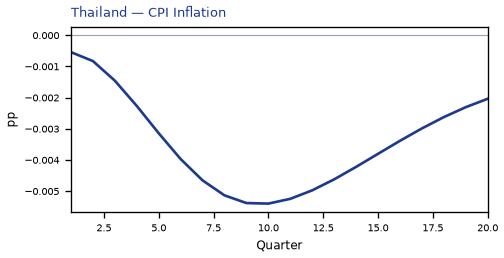
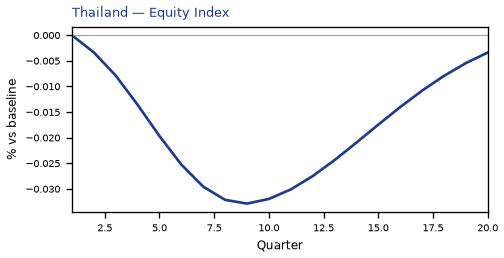
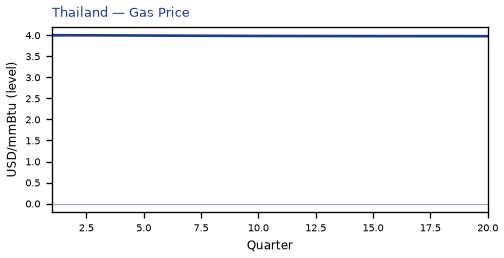
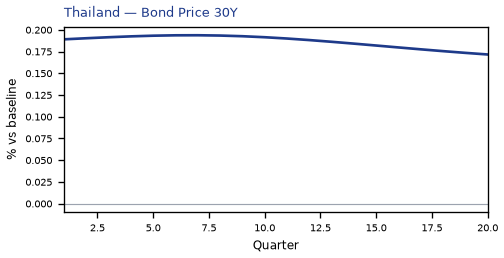
The main impact of a -25% United Kingdom housing shock on Thailand is a negligible drop in GDP of 0.02% by Q11. This is a model impulse response versus baseline, not a forecast. This has almost no impact on Thailand.
global_macro_v64 · contract v6.4 · Q1–Q20 JSON · not financial advice
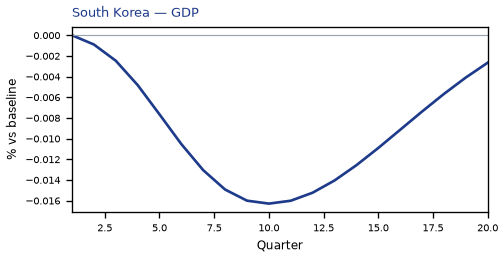
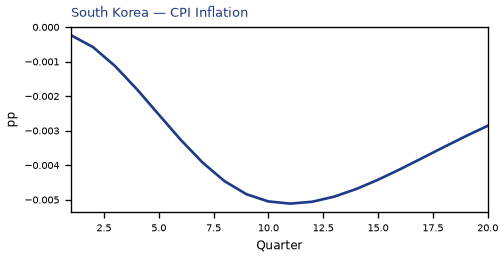
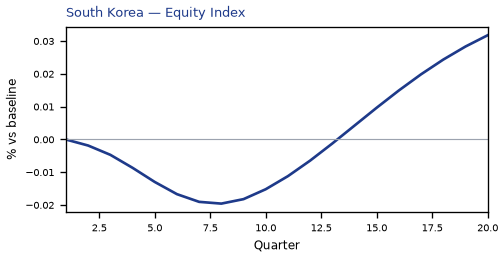
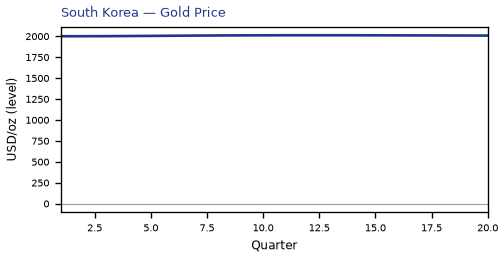
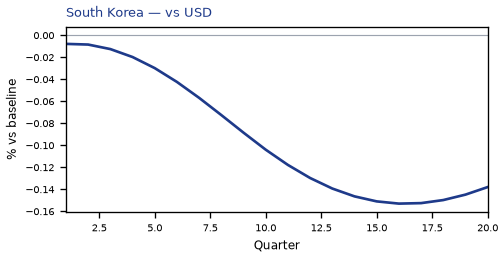
The main impact of a -25% United Kingdom housing shock on South Korea is a negligible drop in GDP of 0.02% by Q10. This is a model impulse response versus baseline, not a forecast. This has almost no impact on South Korea.
global_macro_v64 · contract v6.4 · Q1–Q20 JSON · not financial advice
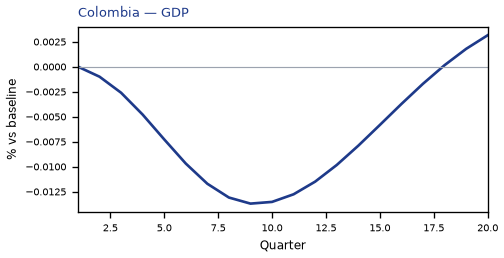
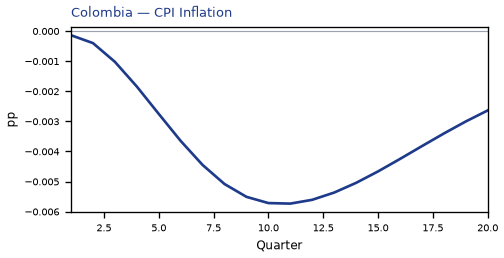
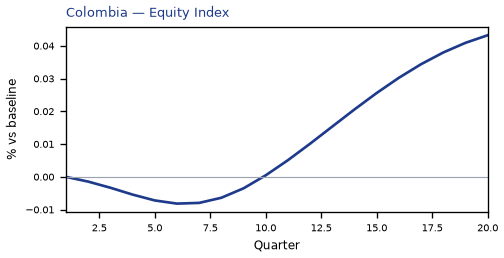
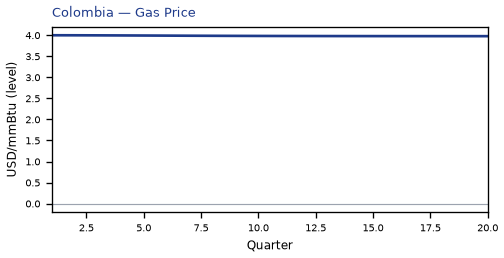
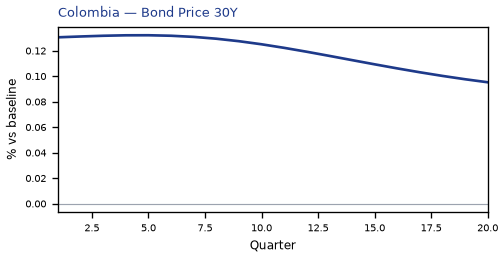
The main impact of a -25% United Kingdom housing shock on Colombia is a negligible drop in GDP of 0.01% by Q9. This is a model impulse response versus baseline, not a forecast. This has almost no impact on Colombia.
global_macro_v64 · contract v6.4 · Q1–Q20 JSON · not financial advice
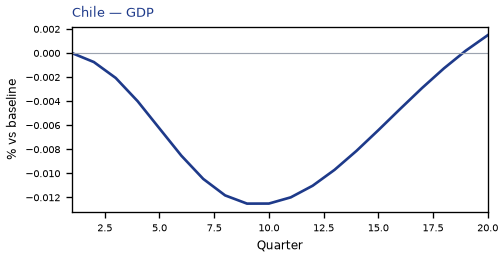
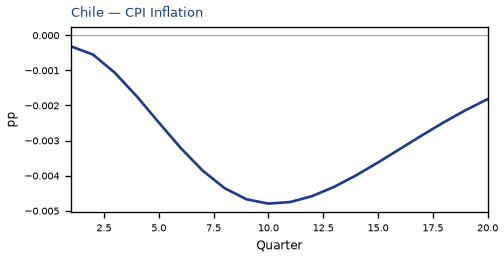
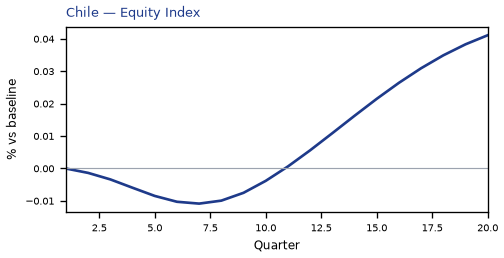
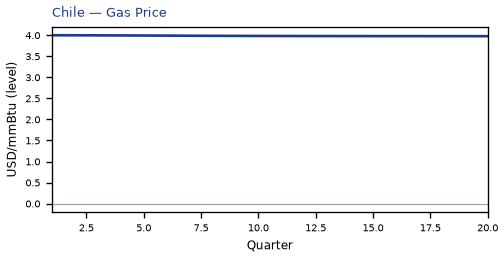
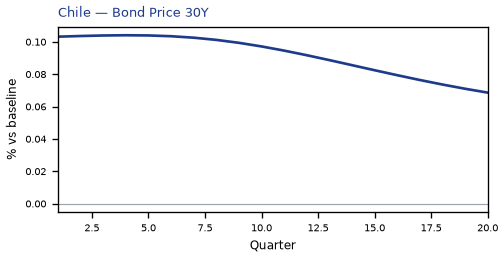
The main impact of a -25% United Kingdom housing shock on Chile is a negligible drop in GDP of 0.01% by Q9. This is a model impulse response versus baseline, not a forecast. This has almost no impact on Chile.
global_macro_v64 · contract v6.4 · Q1–Q20 JSON · not financial advice
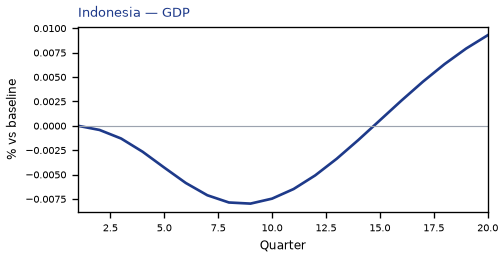
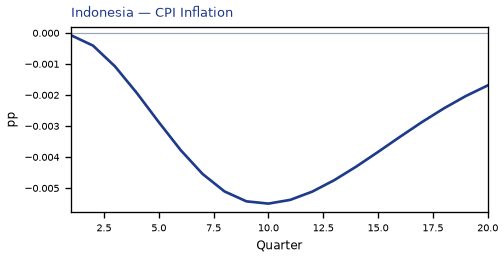
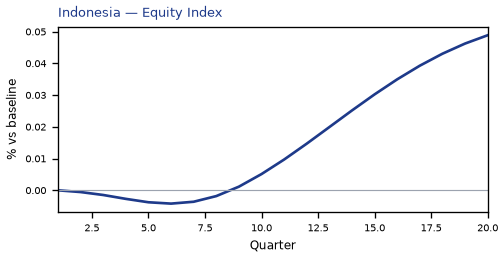
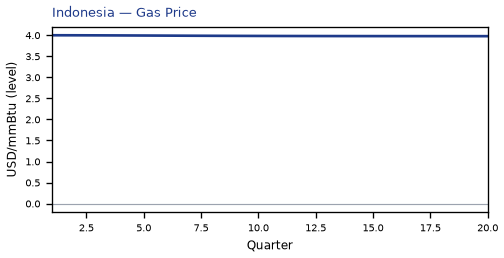
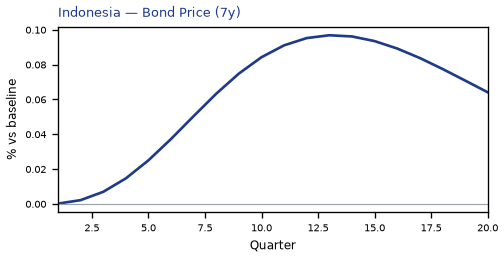
The main impact of a -25% United Kingdom housing shock on Indonesia is a negligible rise in GDP of 0.01% by Q20. This is a model impulse response versus baseline, not a forecast. This has almost no impact on Indonesia.
global_macro_v64 · contract v6.4 · Q1–Q20 JSON · not financial advice
